Regulation of photosynthetic electron flow on dark to light transition by ferredoxin:NADP(H) oxidoreductase interactions - eLife
←
→
Page content transcription
If your browser does not render page correctly, please read the page content below
RESEARCH ARTICLE

                                   Regulation of photosynthetic electron
                                   flow on dark to light transition by
                                   ferredoxin:NADP(H) oxidoreductase
                                   interactions
                                   Manuela Kramer1,2, Melvin Rodriguez-Heredia1, Francesco Saccon1,
                                   Laura Mosebach3, Manuel Twachtmann2, Anja Krieger-Liszkay4, Chris Duffy1,
                                   Robert J Knell1, Giovanni Finazzi5, Guy Thomas Hanke1,2*
                                   1
                                    School of Biochemistry and Chemistry, Queen Mary University of London, London,
                                   United Kingdom; 2Department of Plant Physiology, Faculty of Biology and
                                   Chemistry, University of Osnabrück, Osnabrück, Germany; 3Institute of Plant
                                   Biology and Biotechnology, University of Münster, Münster, Germany; 4Institute for
                                   Integrative Biology of the Cell (I2BC), CEA, CNRS, Univ Paris-Sud, Université Paris-
                                   Saclay, Paris, France; 5Laboratoire de Physiologie Cellulaire et Végétale, UMR 5168,
                                   Centre National de la Recherche Scientifique (CNRS), Commissariat a‘ l’Energie
                                   Atomique et aux Energies Alternatives (CEA), Université Grenoble Alpes, Institut
                                   National Recherche Agronomique (INRA), Institut de Recherche en Sciences et
                                   Technologies pour le Vivant (iRTSV), CEA Grenoble, Grenoble, France

                                   Abstract During photosynthesis, electron transport is necessary for carbon assimilation and
                                   must be regulated to minimize free radical damage. There is a longstanding controversy over the
                                   role of a critical enzyme in this process (ferredoxin:NADP(H) oxidoreductase, or FNR), and in
                                   particular its location within chloroplasts. Here we use immunogold labelling to prove that FNR
                                   previously assigned as soluble is in fact membrane associated. We combined this technique with a
*For correspondence:               genetic approach in the model plant Arabidopsis to show that the distribution of this enzyme
g.hanke@qmul.ac.uk                 between different membrane regions depends on its interaction with specific tether proteins. We
Competing interests: The           further demonstrate a correlation between the interaction of FNR with different proteins and the
authors declare that no            activity of alternative photosynthetic electron transport pathways. This supports a role for FNR
competing interests exist.         location in regulating photosynthetic electron flow during the transition from dark to light.
Funding: See page 24
Received: 17 February 2020
Accepted: 25 February 2021
Published: 09 March 2021           Introduction
                                   Photosynthetic carbon assimilation in chloroplasts requires NADPH. This is generated by the enzyme
Reviewing editor: David M
Kramer, Michigan State
                                   ferredoxin:NADP(H) oxidoreductase (FNR) using electrons from ferredoxin (Fd), which is reduced on
University, United States          excitation of photosystem I (PSI) (Shin et al., 1963). The pathway is referred to as ‘linear electron
                                   flow’ (LEF) because the electrons originate from water splitting at photosystem II (PSII) and are trans-
   Copyright Kramer et al. This
                                   ferred in a linear progression to PSI via plastoquinone/plastoquinol (PQ/PQH2) and the cytochrome
article is distributed under the
                                   b6f complex (Cyt b6f), pumping protons across the thylakoid membrane (Hill and Bendall, 1960;
terms of the Creative Commons
Attribution License, which         Mitchell, 1975). Plastocyanin (PC) takes these electrons and re-reduces the oxidised PSI. This proton
permits unrestricted use and       motive force drives synthesis of ATP, which is also required for carbon fixation among a host of other
redistribution provided that the   reactions. FNR shows an extremely high control co-efficient for photosynthetic rate (meaning that
original author and source are     changing FNR concentrations strongly influences flux through the pathway) in tobacco (Nicotiana
credited.                          tabacum): 0.7 in limiting light and 0.94 in saturating light (Hajirezaei et al., 2002).

Kramer et al. eLife 2021;10:e56088. DOI: https://doi.org/10.7554/eLife.56088                                                        1 of 32
Research article Plant Biology
Chloroplasts are bounded by an envelope membrane and contain a soluble matrix (the stroma)
and an internal membrane (the thylakoid) composed of two distinct domains: stacks of appressed
discs known as grana, connected by sheets of membrane called lamellae (Paolillo, 1970;
Mustárdy et al., 2008). Apart from the electron shuttling proteins PC and Fd, all components of
LEF are unambiguously localised to the thylakoid membrane except FNR, whose location remains
controversial.
Although it has been found associated with PSI (Andersen et al., 1992), it is suggested that
membrane association is unnecessary for FNR function (Benz et al., 2010). This is because mutation
of two, higher plant specific, FNR tethering proteins (Tic62 and TROL) caused all FNR to be soluble
but had little impact on LEF (Lintala et al., 2014). Current dogma therefore states that NADP+ pho-
toreduction is conducted by soluble FNR, free in the stroma (Benz et al., 2010), and indeed a large
proportion of FNR is recovered as a soluble protein after cell fractionation of algae
(Mosebach et al., 2017) and higher plants (Hanke et al., 2005; Okutani et al., 2005; Böhme, 1978).
Contrary to this theory, FNR enzyme activity increases when the protein is associated with the mem-
brane (Carrillo and Vallejos, 1982; Forti and Bracale, 1984).
PSI can be re-reduced by returning electrons from Fd to PQ, thus pumping protons without gen-
erating NADPH. This cyclic electron flow (CEF) protects the photosynthetic machinery when there is
an imbalance between the production of excited electrons and their consumption (Huang et al.,
2018; Yamori et al., 2016), and regulates the ratio between ATP and NADPH produced
(Suorsa et al., 2012; Walker et al., 2014; Munekage et al., 2010; Joliot and Johnson, 2011;
Kramer and Evans, 2011). Two CEF pathways have been defined: one is catalysed by a homologue
of respiratory complex I called NDH (Burrows et al., 1998; Shikanai et al., 1998; Kofer et al.,
1998); the other is defined by its sensitivity to antimycin A, and depends on the Pgr5
(Munekage et al., 2002) and PgrL1 proteins (DalCorso et al., 2008). There are some differences in
CEF pathways between angiosperms, which retain the NDH complex, and algae such as Chlamydo-
monas reinhardtii which replace it with an NDH2 type, monomeric complex (Peltier et al., 2016).
Curiously, FNR is implicated in the antimycin A sensitive pathway, being found in complex with
PgrL1 in the green alga Chlamydomonas (Iwai et al., 2010) and identified as a PgrL1 interaction
partner in higher plants (DalCorso et al., 2008). Moreover, pgr5 knockout in Chlamydomonas
increases FNR solubilisation (Mosebach et al., 2017). There is also some evidence supporting a
function for FNR in higher plant CEF from inhibitor studies (Ravenel et al., 1994; Shahak et al.,
1981; Bendall and Manasse, 1995; Mills et al., 1979; Cleland and Bendall, 1992; Ye and Wang,
1997; Hosler and Yocum, 1985), but a definitive mutant study is hampered by the severe pheno-
type when NADP+ reduction is disrupted (Bendall and Manasse, 1995; Lintala et al., 2012).
Higher plant chloroplasts switch rapidly between LEF and CEF in response to environmental con-
ditions (Joliot and Joliot, 2005; Asada et al., 1993) and dynamic transfer of FNR between mem-
brane complexes has been proposed as part of this mechanism (Joliot and Johnson, 2011;
Breyton et al., 2006). FNR iso-proteins with variable capacity for membrane association could help
to test this hypothesis and have been identified so far in wheat, Arabidopsis, and maize
(Hanke et al., 2005; Okutani et al., 2005; Gummadova et al., 2007). Arabidopsis has two FNR iso-
proteins (AtFNR1 and AtFNR2), and knock-out of the AtFNR1 gene results in complete solublisation
of AtFNR2, indicating cooperativity in membrane association of the two FNR iso-proteins
(Hanke et al., 2008; Lintala et al., 2007). Maize has 3 FNR iso-proteins, which are differentially
localised between cell types engaging predominantly in CEF or LEF (Twachtmann et al., 2012).
Remarkably, when we expressed maize FNRs heterologously in Arabidopsis, they showed specific
association with either TROL (ZmFNR1), Tic62 (ZmFNR2), or were soluble (ZmFNR3). For clarity, the
properties of the different Arabidopsis and maize FNRs are summarised in Supplementary file 1.
The grana and lamellae domains of the thylakoid vary in protein composition (Andersson and
Anderson, 1980), with PSII and its antennae in the appressed grana, and PSI, NDH, and the ATPase
restricted to stroma facing regions (Daum et al., 2010). Cyt b6f is evenly distributed (Allred and
Staehelin, 1986). As LEF requires PSI and PSII, it is thought to predominantly occur at border
regions, where appressed and stroma facing membranes coincide, bringing the necessary compo-
nents into proximity (Anderson et al., 2012). By contrast, the CEF components PSI, PgrL1/Pgr5
(Hertle et al., 2013), NDH (Lennon et al., 2003), and Cyt b6f are all present on the lamellae (Ander-
son, 1992; Chow et al., 2005). In order to understand whether FNR can act as part of a regulatory
switch between LEF and CEF, it is therefore critical to understand (1) where it is located within the
Kramer et al. eLife 2021;10:e56088. DOI: https://doi.org/10.7554/eLife.56088 2 of 32Research article Plant Biology
chloroplast, (2) how this relates to its interaction with different tether proteins, and (3) how these fac-
tors impact on the different electron transport pathways. Fluorescence microscopy with FNR is ham-
pered by difficulties in labelling the protein – the N-terminal is critical for interaction with the
membrane (Twachtmann et al., 2012), while the carboxy-group of the C-terminal Tyr is part of the
catalytic mechanism (Tejero et al., 2005). In this study we therefore undertook a rigorous immuno-
gold-label (IGL) study on FNR location in Arabidopsis chloroplasts. The data indicate that the
enzyme is almost exclusively membrane bound, even in genotypes where it was previously thought
to be totally soluble. Moreover, to dissect the connection between interaction, location, and func-
tion, we have introduced genes for the different ZmFNR proteins into the fnr1 mutants, creating Ara-
bidopsis plants with approximately wild-type levels of FNR but enriched in specific interactions:
either Tic62-bound, TROL-bound, or soluble. The data show that FNR:protein tether interactions
change FNR sub-chloroplast distribution and impact on the dominant CEF pathway that occurs dur-
ing the transition from dark to light.
Results
In order to establish a rigorous protocol for FNR localisation by IGL, we first confirmed our antibod-
ies are highly specific (Figure 1—figure supplement 1). Then we performed transmission electron
microscopy (TEM) IGL on multiple chloroplasts from one individual. We defined sub-compartments
in the chloroplast and calculated the FNR staining density within them as particles per mm2 (Fig-
ure 1—figure supplement 2). The minimum number of chloroplasts necessary for a statistically
sound interpretation was identified using a power analysis of this data in a mixed model test (chosen
as a statistical test because the FNR density in different sub-compartments of each chloroplast is
related). This was defined as three chloroplasts per individual, but we have analysed 15 to generate
additional statistical power (Supplementary file 2a). The distance between a label and its target is
influenced by the size of antibodies – meaning a label can potentially be up to 30 nm away from a
protein (Hermann et al., 1996). To ensure a conservative estimate of membrane localisation, we
therefore defined an area approximately 10 nm either side of the membrane as ‘membrane bound’,
and divided chloroplasts into three sub-compartments: stroma, grana core, and combined stromal
exposed membranes (lamellae + margins). FNR staining density is five times higher at the lamellae/
margin region than in the stroma or the grana core (Figure 1—figure supplement 2), which the
mixed model describes as highly significant (Supplementary file 2a). Although FNR-staining in both
grana core and stroma is higher than in the cytosol, we consider this density likely originates from
FNR at the lamellae/margin region, labelled by antibody oriented such that it extends beyond the
defined 10 nm area either side of the TEM visualised membrane. This interpretation is based on the
following reasons: (1) FNR cannot enter the grana core, due to spatial restriction, and so grana
assignments must originate from antibodies tethered to FNR at the grana margins. (2) There is no
statistical difference between staining density in the grana and stroma, meaning that even the low
level detected in the stroma is also likely due to the orientation of label attached to membrane asso-
ciated FNR. (3) Cyt f is also detected at significantly higher density in the stroma than the cytosol by
IGL-TEM (Figure 1—figure supplement 2, Supplementary file 2b). Cyt f is part of the Cyt b6f, an
integral membrane protein that is never found in the stroma. Nevertheless, we retained the original
10 nm area to define membrane association, as this appears to detect the great majority of mem-
brane bound proteins. We consider that a small amount of false negative assignments to grana core
and stroma are preferable to the risk of false positives associated with extending the membrane
assignment zone from 10 to 30 nm. As expected, there is no significant difference in Cyt f staining
between different thylakoid domains. Based on this analysis, we conclude that chloroplasts contain
very little soluble, stromal FNR.
It has been reported that during some fixation procedures for immunolabelling whole mammalian
cells, soluble cytosolic proteins may be disproportionately washed out of samples in comparison to
membrane bound proteins (Huebinger et al., 2018). To confirm that this is not the reason for the
absence of soluble-localised FNR in our sections, we therefore repeated the experiment to compare
several individuals of Wt and fnr1, a genotype in which the remaining FNR (AtFNR2) is 100% soluble
following mechanical disruption to extract proteins from leaves (Hanke et al., 2008; Lintala et al.,
2007). Again, our analysis shows significantly higher label density of the margins/lamellae than the
stroma in both genotypes (Figure 1, Table 1). There is no significant difference between labelling
Kramer et al. eLife 2021;10:e56088. DOI: https://doi.org/10.7554/eLife.56088 3 of 32Research article Plant Biology
Figure 1. FNR is not detected in the chloroplast stroma of higher plants. (A) Representative micrograph showing
immunogold labelling of FNR in sections of chloroplasts from Wt Arabidopsis detected by IGL-TEM. White arrows
indicate example gold particles. (B) Immunogold labelling density of FNR in different sub-chloroplast
Figure 1 continued on next page
Kramer et al. eLife 2021;10:e56088. DOI: https://doi.org/10.7554/eLife.56088 4 of 32Research article Plant Biology
Figure 1 continued
compartments, n = 15–22 chloroplasts each from three Wt individuals (grey) and 3 fnr1 (white) individuals. Outliers
shown. See Figure 1—figure supplement 1 for quality control of antibodies and Figure 1—figure supplement 2
for optimisation of IG-TEM technique. See Table 1 for statistical significance in a mixed effects model analysis of
variance between genotypes and between sub-compartments within each genotype.
The online version of this article includes the following figure supplement(s) for figure 1:
Figure supplement 1. Specificity of antisera used for Immunogold labelling and blue native PAGE western blots.
Figure supplement 2. Detecting protein localisation in sub-chloroplast compartments.
density of stroma and grana core, indicating that there is negligible FNR in the stroma. This result,
combined with previous observations that organellar proteins are much less prone to loss during fix-
ation than cytosolic proteins (Schnell et al., 2012), strongly suggests that the FNR distribution we
have measured reflects the situation in the native chloroplast. The studies that previously determined
completely soluble distribution of FNR in the fnr1 mutant were based on mechanical separation fol-
lowed by centrifugation. By contrast, our IGL data indicate that in situ almost all FNR is thylakoid
associated. The FNR previously assigned as soluble must therefore be associated with the mem-
brane through weak associations that are disrupted during mechanical extraction.
To try to understand more about the location of tightly bound and weakly associated FNR at the
thylakoid, we analysed plants where FNR is localised to different membrane complexes. We
exploited genes for three maize FNR proteins (ZmFNR1, ZmFNR2, and ZmFNR3) with variable affin-
ity to the TROL and Tic62 membrane tethers (Twachtmann et al., 2012). These were expressed in
the Arabidopsis fnr1 mutant, under control of the Arabidopsis FNR1 promoter – resulting in approxi-
mately wild-type FNR protein contents. Western blots to show FNR proteins in these lines are pre-
sented in Figure 2. SDS-gels (Figure 2A) separate proteins according to mass, while native gels
(Figure 2B) separate proteins according to native charge and retain some strong protein:protein
interactions. As previously reported, mechanical separation of supernatant and pellet fractions from
fnr1 leaves caused recovery of all FNR in the soluble fraction. We have now termed this ‘weakly
bound’ FNR, based on the results in Figure 1. In the fnr1-ZmFNR1 genotype, ZmFNR is recovered in
both the weakly bound and the pellet (now termed ‘tightly bound’) fractions. The tightly bound
ZmFNR1 is mostly in high molecular weight complexes (Figure 2B) associated with TROL
(Figure 2C). Interestingly, when we confirmed the specificity of our TROL antibody, we noted that
total TROL abundance partly correlates with the intensity of the BNP band that reacts with both
FNR and TROL antisera (Figure 2C), being increased in the fnr1-ZmFNR1 line and decreased in the
fnr1, fnr1-ZmFNR2, and fnr1-ZmFNR3 lines (Figure 1—figure supplement 1). Heterologously
expressed ZmFNR2 is also found in both weakly associated and strongly bound fractions, and its
expression results in the rescue of native AtFNR2 recruitment to the tightly bound membrane frac-
tion in the fnr1 genotype (Figure 2A lower band). This lends support to the hypothesis that co-oper-
ative interactions with other FNR iso-proteins are necessary to recruit AtFNR2 to Tic62 and TROL
tethers (Hanke et al., 2008; Lintala et al., 2009; Lintala et al., 2007). FNR is enriched at Tic62 in
this line (Figure 2C). In the fnr1-ZmFNR3 line, nearly all FNR remains weakly associated (Figure 2A).
The plants expressing genes for the maize FNR1, FNR2, and FNR3 iso-proteins in an Arabidopsis
fnr1 mutant background (fnr1-ZmFNR1, fnr1-ZmFNR2, and fnr1-ZmFNR3) were then analysed by
IGL-TEM (Figure 3). In this case we further divided the staining density of lamellae/margin into sepa-
rate margin (any stromal facing membrane adjacent to an appressed membrane) and lamellae (all
thylakoid membrane not adjacent to appressed membrane) areas. See Figure 1—figure supple-
ment 2 for an example of domain area labelling. We consider this a primarily functional, rather than
structural, distinction, as many regions we have classed as margin will not be curved, but should
have PSI and PSII in relatively close proximity. We examined the possibility that differences in chloro-
plast ultrastructure between genotypes might influence our findings, by comparing the relative size
of our defined areas between the genotypes (Figure 3—figure supplement 1). We found that the
fnr1 mutant shows a small increase in relative stromal area and corresponding decrease in relative
margin area. The relative areas of chloroplast sub-compartments did not differ from the Wt in any of
the other genotypes. Analysis of FNR staining density in chloroplasts of all genotypes is shown in
Figure 3 (statistics in Table 2). Absolute staining density might be influenced by variation in FNR-
Kramer et al. eLife 2021;10:e56088. DOI: https://doi.org/10.7554/eLife.56088 5 of 32Research article Plant Biology
Table 1. Mixed effects model investigating changes in FNR density between total chloroplast sub-compartments of three individuals
each of WT and fnr1 Arabidopsis.
Analysis of data presented in Figure 1. Fixed effects taking either label density in the stroma as the intercept or label density in the
margins/lamellae as the intercept. Linear mixed model fit by REML. Signif. codes: 0 ‘***’ 0.001 ‘**’ 0.01 ‘*’ 0.05 ‘.’ 0.1 ‘’ 1.
Deletion test carried out using Satterthwaite’s method with the R package lmerTest (Kuznetsova, Brockhoff & Christensen 2017). The model is a mixed
effects model with random intercepts. The square root of response is the response variable, tissue is the fixed effect, and individual the random effect.
Fixed effect deleted Sum sq Mean sq Num DF Den DF F value Pr (>F)
Sub-compartment 14.231 7.1153 2 295.58 7.4565 0.000693 ***
Model summary:
Random effects:
Groups Name Variance Std. Dev.
individual (Intercept) 0.1896 0.4354
Residual 0.9542 0.9769
Number of obs: 306, groups: individual, 6
Fixed effects when fnr1 stroma is set as the intercept
Estimate Std. Error DF t value Pr (>|t|)
(Intercept) 0.9165 0.2791 4.2686 3.283 0.0276 *
Grana 0.3607 0.1714 295.5794 2.105 0.0361 *
16
Margin/lamellae 2.2884 0.1714 295.5794 13.355 |t|)
(Intercept) 0.9165 0.2791 4.2686 11.482 0.000228 ***
16
Grana 2.6491 0.1714 295.5794 15.460 |t|)
05
(Intercept) 2.8618 0.3041 5.8576 9.411 9.41 ***
11
Grana 1.5544 0.2271 295.5794 6.844 4.44 ***
14
Stroma 1.8223 0.2271 295.5794 8.024 2.43 ***
Table 1 continued on next page
Kramer et al. eLife 2021;10:e56088. DOI: https://doi.org/10.7554/eLife.56088 6 of 32Research article Plant Biology
Table 1 continued
Deletion test carried out using Satterthwaite’s method with the R package lmerTest (Kuznetsova, Brockhoff & Christensen 2017). The model is a mixed
effects model with random intercepts. The square root of response is the response variable, tissue is the fixed effect, and individual the random effect.
Fixed effect deleted Sum sq Mean sq Num DF Den DF F value Pr (>F)
Genotype comparison WT:fnr1 0.343 0.4128 5.0375 0.831 0.443524
Wt grana: fnr1 grana 1.0947 0.2845 295.5794 3.848 0.000146 ***
Wt stroma: fnr1 stroma 0.4661 0.2845 295.5794 1.638 0.102459
isoform antigenicity, so we have compared only between sub-chloroplast domains of each genotype.
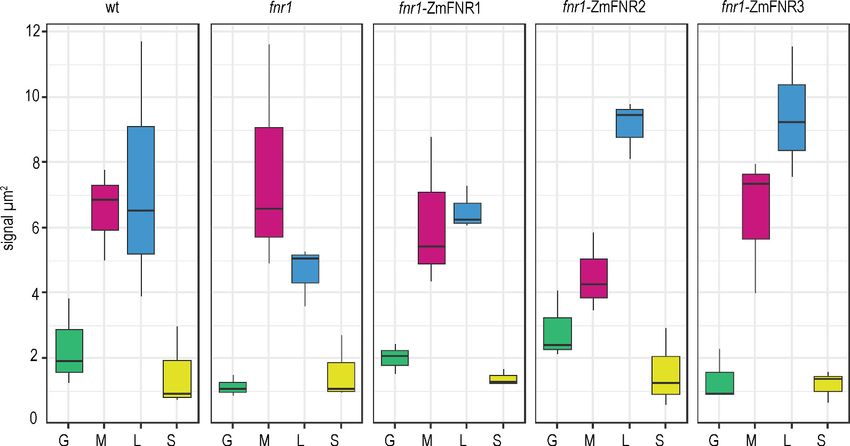
The greatest variation in distribution between genotypes is seen in the density of FNR staining asso-
ciated with the lamellae (blue boxes in Figure 3). While FNR density in the lamellae region is similar
to that at the margin for Wt chloroplasts, the fnr1 mutant shows a significant decrease in label den-
sity at the lamellae relative to the margins (Table 2). Introduction of ZmFNR1 (TROL binding) to the
fnr1 background restored equal FNR density between the margins and lamellae regions. By contrast,
introduction of ZmFNR2 (Tic62 binding) to the fnr1 background results in much higher label density
at the stromal lamellae relative to the margins. This tendency is also seen on introduction of ZmFNR3
(weak binding), but with lower statistical significance. We interpret the dramatic change in FNR local-
isation on ZmFNR2 expression in the fnr1 background as being related to the restoration of native
AtFNR2 recruitment into strong interactions at the thylakoid membrane in this genotype
(Figure 2A).
It has been suggested that the location of FNR at different thylakoid complexes might regulate
electron transport (Breyton et al., 2006; Joliot and Johnson, 2011; Twachtmann et al., 2012), and
we therefore measured whether sub-chloroplast FNR distribution had an impact on enzyme activity
in NADP+ reduction. NADP+ reduction and NADPH oxidation kinetics were followed in chloroplasts
isolated from the different genotypes over a short illumination period followed by a dark period (Fig-
ure 4). Although amplitudes of fluorescence are quite consistent between genotypes (Figure 4),
comparisons of absolute NADPH concentrations between chloroplast preparations are problematic,
as the proportion of broken chloroplasts may vary. However, these data do allow us to accurately
compare the kinetics of reduction and oxidation.
As described previously for pea chloroplasts (Schreiber and Klughammer, 2009;
Latouche et al., 2000) and Arabidopsis (Hanke et al., 2008), isolated chloroplasts show distinct
components of NADP+ reduction. In the measurements shown in Figure 4, only two components
are clearly observed: a fast one of less than 1 s, and a slow one that lasts ~20 s. Further characterisa-
tion of these components is described in Appendix 1. The two observed components of NADP+
reduction can be fitted (Supplementary file 2c) and vary significantly in relative size between geno-
types (Supplementary file 2d), depending on the abundance and location of FNR. The fnr1 mutant
and the genotype expressing weakly bound maize FNR in the mutant background (fnr1-ZmFNR3)
show a relatively small contribution of the slow component when compared to Wt, fnr1-ZmFNR1,
and fnr1-ZmFNR3. NADPH oxidation in the dark was well fit to a single component using a Hill coef-
ficient and no difference between genotypes was detected (Supplementary file 2e).
We then determined that these differences in NADP(H) kinetics are not due to pleiotropic effects
altering the abundance of other proteins that could impact photosynthetic electron transport or
NADP(H) poise (Figure 4—figure supplement 1). We found no differences in protein abundance
that correlate with those in NADP(H) reduction and oxidation kinetics. Although this does not dis-
count the possibility that variable FNR:FNR tether interactions could influence regulation of these
proteins (see later discussion), it does allow us to discount pleiotropic changes in their total capacity.
It is reported that FNR interactions with Tic62 and TROL are weakened by exposure to light
(Alte et al., 2010; Benz et al., 2009). This means that during the illumination period of our NADP
(H) measurement, these interactions will be weakened. Because interaction with Tic62 and TROL is
not detected in the fnr1 and fnr1-ZmFNR3 genotypes (Figure 2C), which also have a diminished
slow phase of NADP+ reduction (Figure 4), we propose that the release of FNR from tightly bound
tether locations could contribute to an increase in the activity of the enzyme. The kinetics in Figure 4
suggest that either (1) strongly bound FNR (prevalent after dark adaptation) has less efficient
Kramer et al. eLife 2021;10:e56088. DOI: https://doi.org/10.7554/eLife.56088 7 of 32Research article Plant Biology
fnr1
A wt fnr1 ZmFNR1 ZmFNR2 ZmFNR3
W T W T W T W T W T ZmFNR2
AtFNR1+2 ZmFNR3
ZmFNR1
B wt fnr1 ZmFNR1
fnr1
ZmFNR2 ZmFNR3
W T W T W T W T W T
high molecular
weight complexes
ZmFNR1
AtFNR2
AtFNR1 ZmFNR2
ZmFNR3
C fnr1 fnr1 fnr1
ZmFNR1
ZmFNR2
ZmFNR3
ZmFNR1
ZmFNR2
ZmFNR3
ZmFNR1
ZmFNR2
ZmFNR3
wt fnr1 wt fnr1 wt fnr1
- 720 -
- 545 -
- 450 -
FNR-Tic62
- 272 -
FNR-TROL
- 146 -
TROL
monomers
- 67 -
kDa
native a-ZmTROL a-ZmFNR2
Figure 2. Arabidopsis plants with variable FNR:membrane tether interactions. Leaf extracts of Arabidopsis wt,
fnr1, and fnr1 mutants transformed to express genes for the maize FNR proteins ZmFNR1, ZmFNR2, and ZmFNR3
in the fnr1 background were separated into soluble and insoluble fractions. These were designated loose (L) and
tight (T) membrane bound FNR fractions, based on the analysis in Figure 1. Samples were subjected to (A) SDS-
PAGE (25 mg protein prior to separation of L and T fractions) or (B) native PAGE (20 mg protein prior to separation
of L and T fractions) before immunoblotting, challenge with antisera against FNR, then detection with alkaline
phosphatase. Migration positions of Arabidopsis (At) FNRs and maize (Zm) FNRs are indicated to the left and
right, respectively. (C) Recruitment of maize FNR proteins into specific Arabidopsis thylakoid membrane
complexes. Chloroplasts were isolated from the same genotypes used in (A) and (B). Thylakoid membranes were
solubilised with DDM and subjected to blue native-PAGE (BNP). Samples were loaded on an equal chlorophyll
basis, with 3.2 mg per lane, western blotted and challenged with antisera raised against FNR (rabbit) and TROL
Figure 2 continued on next page
Kramer et al. eLife 2021;10:e56088. DOI: https://doi.org/10.7554/eLife.56088 8 of 32Research article Plant Biology
Figure 2 continued
(guinea pig) before visualisation using secondary antisera conjugated to horseradish peroxidase
(chemiluminescence) and alkaline phosphatase respectively. Positions of molecular mass markers are indicated
between the gels and the blots in kDa.
NADP+ reduction activity, and that dissociation of FNR from Tic62 and TROL therefore represents a
mechanism for upregulation, or (2) there is a difference between the genotypes in the speed with
which they upregulate downstream NADPH consumption processes.
We then assessed the impact of FNR location on photosynthetic electron transport. Because of
the longstanding debate about the role of FNR in CEF (Bendall and Manasse, 1995; Bojko et al.,
2003; Buchert et al., 2018; Hanke et al., 2008; Hertle et al., 2013; Hosler and Yocum, 1985;
Iwai et al., 2010; Mosebach et al., 2017; Shahak et al., 1981; Ye and Wang, 1997; Zhang et al.,
2001), and the suggestion that relocation of FNR might be a mechanism to switch between LEF and
CEF (Breyton et al., 2006; Joliot and Johnson, 2011), we paid particular attention to CEF related
parameters. It is reported that rates of CEF are highest in the first 20 s of illumination following dark
adaptation (Joliot and Joliot, 2005), and this corresponds to the time scale over which the slow
kinetic phase of NADP+ reduction kinetics develops (Figure 4). We therefore compared the electro-
chromic band shift (ECS), here used to quantify electron flow rates, following either 20 s or 5 min
acclimation to actinic light (Figure 5A). To differentiate LEF from CEF, we applied either a pulse of
actinic light illumination (stimulation of both PSI and PSII, and therefore CEF + LEF), or a pulse of far
red light illumination (PSI excitation only, and therefore CEF only).
As an alternative method, we also performed the experiment following infiltration with DCMU
during dark adaptation. This is a specific PSII inhibitor, which showed the same trend, but with much
greater variation (Figure 5—figure supplement 1). When the data are normalised to a single turn-
over flash, it is possible to calculate rates of CEF/total EF (Figure 5B, see Materials and methods for
a detailed explanation on the calculation procedure). As expected, for WT, there is significantly
Figure 3. Tether interactions determine FNR sub-chloroplast location. Density of immunogold labelled FNR in different sub-chloroplast compartments
of the indicated genotypes. Values are averages of three biological replicates, with combined label and area for the sub-compartments of 15–20
chloroplasts for each individual. Areas shown are: grana core (green), margins (magenta), stromal lamellae (blue), and stroma (yellow). See Figure 3—
figure supplement 1 for confirmation that sub-chloroplast areas do not vary between genotypes. Statistical significance between sub-compartment
signal density within genotypes was calculated with a mixed effects model analysis of variance (Table 2).
The online version of this article includes the following figure supplement(s) for figure 3:
Figure supplement 1. Comparison of areas of different chloroplast sub-compartments between genotypes.
Kramer et al. eLife 2021;10:e56088. DOI: https://doi.org/10.7554/eLife.56088 9 of 32Research article Plant Biology
more CEF following a short (20 s) light exposure in dark adapted leaves than after light acclimation.
This trend is not seen in the fnr1 mutant, suggesting it lacks the capacity to upregulate CEF in dark
adapted leaves. Heterologous expression of either tether bound FNR, ZmFNR1, or ZmFNR2 rescues
this capacity, but the more weakly interacting ZmFNR3 does not. All genotypes show similar CEF/
total EF values after light acclimation, indicating that the impact of FNR location is related to the
tether interactions that occur following dark adaptation. Western blotting confirms that there is little
difference in abundance of major PET components between the genotypes (Figure 4—figure sup-
plement 1). In several replicated experiments the only consistent differences seen are decreased
PsbA in the fnr1 line and increased PC in the fnr1-ZmFNR3 line. Critically, there is no difference in
abundance of PgrL1 or subunit 1 of the NDH complex, indicating that CEF components are equiva-
lent and the variation seen in our measurements of CEF is related to FNR location rather than sec-
ondary effects.
We also compared activity of PSI (P700 oxidation) and PSII (chlorophyll fluorescence) in the same
genotypes under identical conditions to the ECS experiment, in order to understand how these
parameters relate to the ECS. Figure 5C shows selected parameters, measured after a 20 s high
light treatment of either dark adapted or light acclimated plants. PSI activity (FI) during high light
treatment is higher after light acclimation and similar between all genotypes except for a small
decrease in fnr1-ZmFNR3 in dark adapted plants. As expected under high light treatment, acceptor
limitation at PSI (Y(NA)) is high, and this is ameliorated somewhat by light adaptation. Unexpectedly,
after dark adaptation the fnr1 mutant, which theoretically has lower Fd oxidation capacity, shows
lower acceptor limitation than the other genotypes. Correspondingly, measurements of (Y(ND))
show significantly higher limitation in donors to PSI for the fnr1 mutant than all other genotypes.
These data are consistent with the deficiency in CEF seen in dark adapted fnr1 (Figure 5A), with
fewer electrons being cycled back to the donor side of PSI. The opposite trend is seen following
light acclimation, with fnr1 showing higher acceptor limitation and lower donor limitation. This is
consistent with decreased Fd oxidation capacity at PSI resulting in decreasing acceptor availability.
The fnr1-ZmFNR3 plants, which also appear deficient in CEF (Figure 5A), do not show a correspond-
ing donor side limitation at PSI following dark adaptation. This discrepancy could be related to the
elevated levels of PC protein in the fnr1-ZmFNR3 plants (Figure 4—figure supplement 1), as PC is
the electron donor to PSI. As expected, light incubation leads to much greater LEF flux, with an
increase in PSII acceptor availability as seen in FII and qL for all genotypes. Taken together, our data
support a model where FNR location regulates electron transport through both LET and CET
pathways.
To test this further, we repeated our IGL-TEM experiment to examine sub-chloroplast FNR local-
isation following light adaptation. These data are plotted in Figure 6 in a comparison with those
generated in the original dark adapted experiment from Figure 3. Unlike the dark adapted leaves,
where staining density is equivalent between margins and lamellae, light adaptation gives higher
FNR density at the margins than in the lamella. FNR density is significantly higher in the margins of
light acclimated than dark adapted plants (Table 3), a region proposed to be highly active in LEF
(Anderson, 1992; Chow et al., 2005).
Discussion
FNR is not free in the stroma as a soluble protein
Until now it has been the general consensus that in higher plant chloroplasts a significant proportion
of FNR is soluble (Carrillo and Vallejos, 1982; Lintala et al., 2007; Okutani et al., 2005;
Shin et al., 1963; Matthijs et al., 1986; Gummadova et al., 2007). Here we present strong evi-
dence that this is not the case (Figure 1—figure supplement 2, Figure 1, Figure 3, Figure 6,
Tables 1–3, Supplementary files 2a, 2b) with only membrane bound FNR detected, even in geno-
types where FNR was previously considered totally soluble (Hanke et al., 2008; Lintala et al.,
2007). The most likely explanation for this is that the aggressive cell disruption procedures, or
osmotic shock followed by solubilisation for BNP, disrupt weak associations of FNR with other mem-
brane complexes (Andersen et al., 1992; Zhang et al., 2001), or possibly even the membrane itself
(Grzyb et al., 2018; Grzyb et al., 2008). We have therefore redefined soluble FNR as weakly associ-
ated FNR. These results are in good agreement with an IGL study showing FNR is only found
Kramer et al. eLife 2021;10:e56088. DOI: https://doi.org/10.7554/eLife.56088 10 of 32Research article Plant Biology
Table 2. Mixed effects model investigating changes in FNR density between total chloroplast sub-
compartments of three individuals each from Arabidopsis genotypes WT, fnr1 mutant and
expressing ZmFNR1; ZmFNR2 and ZmFNR3 in the fnr1 background.
Analysis of data presented in Figure 3. Fixed effects taking either label density in the stroma as the
intercept or label density in the margins/lamellae as the intercept. Linear mixed model fit by REML.
Signif. codes: 0 ‘***’ 0.001 ‘**’ 0.01 ‘*’ 0.05 ‘.’ 0.1 ‘’ 1.
Wt
Deletion test carried out using Satterthwaite’s method with the R package lmerTest (Kuznetsova, Brockhoff &
Christensen 2017).
The model is a mixed effects model with random intercepts. The square root of response is the response variable,
tissue is the fixed effect, and individual the random effect.
Fixed effect deleted Sum Sq Mean Sq Num DF Den DF F value Pr (>F)
Sub-compartment 4.991 1.6637 3 6 36.152 0.0003089 ***
Model summary:
Random effects:
Groups Name Variance Std. Dev.
Individual (Intercept) 0.21097 0.4593
Residual 0.04602 0.2145
Number of obs: 12, groups: individual, 3
Fixed effects when stroma is set as the intercept:
Estimate Std. Error DF t value Pr (>|t|)
(Intercept) 1.1743 0.2927 2.6475 4.012 0.034961 *
Grana 0.3104 0.1752 6 1.772 0.126711
Lamellae 1.4748 0.1752 6 8.42 0.000153 ***
Margin 1.3736 0.1752 6 7.842 0.000227 ***
Fixed effects when lamellae is set as the intercept:
Estimate Std. Error DF t value Pr (>|t|)
(Intercept) 2.6491 0.2927 2.6475 9.051 0.004601 **
Grana 1.1644 0.1752 6 6.648 0.00056 ***
Margin 0.1012 0.1752 6 0.578 0.584522
Stroma 1.4748 0.1752 6 8.42 0.000153 ***
fnr1
Deletion test carried out using Satterthwaite’s method with the R package lmerTest (Kuznetsova, Brockhoff &
Christensen 2017).
The model is a mixed effects model with random intercepts. The square root of response is the response variable,
tissue is the fixed effect, and individual the random effect.
Fixed effect deleted Sum Sq Mean Sq Num DF Den DF F value Pr (>F)
Sub-compartment 5.6516 1.8839 3 6 26.204 0.000759 ***
Model summary:
Random effects:
Groups Name Variance Std. Dev.
Individual (Intercept) 0.07521 0.2742
Residual 0.07189 0.2681
Number of obs: 12, groups: individual, 3
Fixed effects when stroma is set as the intercept:
Estimate Std. Error DF t value Pr (>|t|)
(Intercept) 1.2117 0.2214 4.4836 5.472 0.003875 **
Grana 0.1584 0.2189 6 0.724 0.496563
Lamellae 0.9353 0.2189 6 4.272 0.005251 **
Margin 1.5161 0.2189 6 6.925 0.000449 ***
Table 2 continued on next page
Kramer et al. eLife 2021;10:e56088. DOI: https://doi.org/10.7554/eLife.56088 11 of 32Research article Plant Biology
Fixed effects when lamellae is set as the intercept:
Estimate Std. Error DF t value Pr (>|t|)
(Intercept) 2.1469 0.2214 4.4836 9.695 0.000356 ***
Grana 1.0937 0.2189 6 4.996 0.002463 **
Margin 0.5808 0.2189 6 2.653 0.037882 *
Stroma 0.9353 0.2189 6 4.272 0.005251 **
fnr1:ZmFNR1
Deletion test carried out using Satterthwaite’s method with the R package lmerTest (Kuznetsova, Brockhoff &
Christensen 2017).
The model is a mixed effects model with random intercepts. The square root of response is the response variable,
tissue is the fixed effect, and individual the random effect.
Fixed effect deleted Sum Sq Mean Sq Num DF Den DF F value Pr (>F)
Sub-compartment 4.5242 1.5081 3 6.01 23.558 0.001009 **
Model summary:
Random effects:
Groups Name Variance Std. Dev.
Individual (Intercept) 0.0005984 0.02446
Residual 0.064017 0.25302
Number of obs: 12, groups: individual, 3
Fixed effects when stroma is set as the intercept:
Estimate Std. Error DF t value Pr (>|t|)
05
(Intercept) 1.1754 0.1468 7.9979 8.009 4.34 ***
Relevel grana 0.2318 0.2066 6.01 1.122 0.304712
Relevel lamellae 1.3774 0.2066 6.01 6.668 0.000547 ***
Relevel margin 1.2849 0.2066 6.01 6.22 0.000793 ***
Fixed effects when lamellae is set as the intercept:
Estimate Std. Error DF t value Pr (>|t|)
07
(Intercept) 2.55285 0.14676 7.9979 17.395 1.22 ***
Relevel grana 1.14567 0.20659 6.01002 5.546 0.001444 **
Relevel margin 0.09252 0.20659 6.01002 0.448 0.669949
Relevel stroma 1.37744 0.20659 6.01002 6.668 0.000547 ***
fnr1:ZmFNR2
Deletion test carried out using Satterthwaite’s method with the R package lmerTest (Kuznetsova, Brockhoff &
Christensen 2017).
The model is a mixed effects model with random intercepts. The square root of response is the response variable,
tissue is the fixed effect, and individual the random effect.
Fixed effect deleted Sum Sq Mean Sq Num DF Den DF F value Pr (>F)
Sub-compartment 5.4414 1.8138 3 6 22.849 0.001106 **
Model summary:
Random effects:
Groups Name Variance Std. Dev.
Individual (Intercept) 0.02741 0.1656
Residual 0.07938 0.2817
Number of obs: 12, groups: individual, 3
Fixed effects when stroma is set as the intercept:
Estimate Std. Error DF t value Pr (>|t|)
(Intercept) 1.1886 0.1887 6.6796 6.3 0.000488 ***
Grana 0.4864 0.23 6 2.114 0.078885 .
Table 2 continued on next page
Kramer et al. eLife 2021;10:e56088. DOI: https://doi.org/10.7554/eLife.56088 12 of 32Research article Plant Biology
Lamellae 1.8298 0.23 6 7.954 0.00021 ***
Margin 0.9239 0.23 6 4.016 0.006989 **
Fixed effects when lamellae is set as the intercept:
Estimate Std. Error DF t value Pr (>|t|)
06
(Intercept) 3.0184 0.1887 6.6796 15.998 1.42 ***
Grana 1.3434 0.23 6 5.84 0.00111 **
Margin 0.9059 0.23 6 3.938 0.00764 **
Stroma 1.8298 0.23 6 7.954 0.00021 ***
fnr1:ZmFNR3
Deletion test carried out using Satterthwaite’s method with the R package lmerTest (Kuznetsova, Brockhoff &
Christensen 2017).
The model is a mixed effects model with random intercepts. The square root of response is the response variable,
tissue is the fixed effect, and individual the random effect.
Fixed effect deleted Sum Sq Mean Sq Num DF Den DF F value Pr (>F)
Sub-compartment 9.0046 3.0015 3 8 25.416 0.0001923 ***
Model summary:
Random effects:
Groups Name Variance Std. Dev.
Individual (Intercept) 0 0
Residual 0.1181 0.3436
Number of obs: 12, groups: individual, 3
Fixed effects when stroma is set as the intercept:
Estimate Std. Error DF t value Pr (>|t|)
(Intercept) 1.06794 0.19841 8 5.383 0.00066 ***
Grana 0.06284 0.28059 8 0.224 0.828395
Lamellae 1.99447 0.28059 8 7.108 0.000101 ***
Margin 1.44343 0.28059 8 5.144 0.00088 ***
Fixed effects when lamellae is set as the intercept:
Estimate Std. Error DF t value Pr (>|t|)
07
(Intercept) 3.0624 0.1984 8 15.435 3.09 ***
Grana 1.9316 0.2806 8 6.884 0.000127 ***
Margin 0.551 0.2806 8 1.964 0.085144 .
Stroma 1.9945 0.2806 8 7.108 0.000101 ***
associated with the algal thylakoid in Chlamydomonas (Suss et al., 1995), though they contradict an
earlier study on higher plants (Negi et al., 2008), where the authors report co-localisation of FNR
and GAPDH. In the chloroplast example shown by Negi et al., 2008 some of the labelled FNR
appears to be in the stroma, but no details of primary or secondary antibody specificity, sample
number or leaf treatment prior to sample preparation are given, which would be necessary for a
valid comparison with our work. It has previously been reported that FNR is a component of the
inner envelope translocon (Stengel et al., 2008), but we detected little evidence for this in analysis
of over 300 mature chloroplasts from 18 individuals (over 4500 gold particles counted). However, we
cannot discount the possibility that such interactions are more prevalent earlier in chloroplast devel-
opment, when protein import is more active.
Benz et al., 2010 propose that FNR tethering by Tic62 is not involved in NADP+ reduction. While
these authors suggest that Tic62-binding prevents proteolytic degradation of FNR in the dark, the
data in Figure 5 reveal another function, critical for transient CEF on dark to light transition. This is
consistent with earlier results in antisense tobacco plants, where transient CEF was negatively
Kramer et al. eLife 2021;10:e56088. DOI: https://doi.org/10.7554/eLife.56088 13 of 32Research article Plant Biology
1
A wt B 0.8
0.015
relative amplitude
0.010 0.6
0.005
0.4
0
-0.005 0.2
fnr1 0
0.015 wt fnr1 ZmFNR1 ZmFNR2 ZmFNR3
0.010
0.005
0
20
-0.005 C 0.6
fnr1 ZmFNR1 0.4
10
k (1/s)
0.015
Fluorescence signal
0.2
0.010
0 0
0.005
fnr1
fnr1
ZmFNR3
ZmFNR3
ZmFNR2
ZmFNR2
wt
wt
ZmFNR1
ZmFNR1
0
-0.005
fnr1 fnr1
fnr1 ZmFNR2
0.015
1.0
0.010 D 0.8
0.005 0.6
k (1/s)
0 0.4
-0.005 0.2
fnr1 ZmFNR3 0
ZmFNR3
ZmFNR2
ZmFNR1
fnr1
wt
0.015
0.010
0.005 fnr1
0
-0.005
0 20 40 60 80
time (s)
Figure 4. Light-dependent NADP(H) reduction and oxidation kinetics are influenced by FNR location and binding
partners. (A) Traces show NADPH fluorescence of dark adapted Arabidopsis chloroplasts measured over a short
light exposure from 10 to 40 s. Traces are averages of three to five independent chloroplast preparations, each of
which was composed of an average of 15 separate measurements. Genotypes from which chloroplasts were
isolated are indicated on each graph. Black traces overlaying signals are fits (two components for reduction, one
component for oxidation), calculated as described in Materials and methods. (B) Relative amplitude of fast (white
bars) and slow (grey bars) components fitted to the NADP+ reduction traces shown in (A). (C) Rate of fluorescence
induction for the fast (white bars, left) and slow (grey bars, right) components fitted to the NADP+ reduction traces
shown in (A). (D) Rate of NADPH fluorescence decay following switching off the light, fitted to the traces shown in
A. B–D are averages of values calculated from three to five separate chloroplast preparations (parameters in
Supplementary file 2c and e). All values given ± standard error (fitting errors with absolute, 95% confidence). See
Figure 4—figure supplement 1 for comparison between genotypes of proteins involved in NADP(H) metabolism.
Appendix 1 describes further characterisation of the two phases of NADP+ reduction and Appendix 1—figure 1
shows further data on this topic.
Figure 4 continued on next page
Kramer et al. eLife 2021;10:e56088. DOI: https://doi.org/10.7554/eLife.56088 14 of 32Research article Plant Biology
Figure 4 continued
The online version of this article includes the following figure supplement(s) for figure 4:
Figure supplement 1. Abundance of the major photosynthetic complexes in the genotypes used in this study.
impacted by decreased FNR (Joliot and Johnson, 2011), although this effect has not previously
been reported in Arabidopsis. Arabidopsis has two genes for FNR, and P700 re-reduction data from
plants knocked-out or knocked-down for either gene have been interpreted as showing an increase
in CEF after high light or temperature stress (Hanke et al., 2008; Lintala et al., 2009). FNR:Tic62
and FNR:TROL interactions are disrupted at higher light intensities (Alte et al., 2010; Benz et al.,
2009), meaning that specific interaction to these tethers is unlikely to withstand illumination during
stress treatments. Indeed, our ECS measurements after light acclimation show no difference in CEF
between genotypes (Figure 5A), and P700 parameters indicate less donor limitation for fnr1 than
other genotypes (Figure 5C). The reported differences in P700 re-reduction (Hanke et al., 2008;
Lintala et al., 2009) therefore likely have another cause in the fnr1 mutants and fnr2 knock-downs or
reflect a different CEF pathway from the dark to light transition CEF measured in our work.
The function of FNR bound to Tic62 and TROL
The study of CEF in full FNR knock-outs is hampered by the essential role FNR plays in generating
NADPH in LEF (Bendall and Manasse, 1995; Lintala et al., 2012), and previous investigation of a
role for FNR-location in CEF has been complicated by the decrease in total FNR content when the
Tic62 or TROL proteins are knocked out (Benz et al., 2009; Jurić et al., 2009). Here we have gener-
ated plants with approximately wild type levels of FNR, but variable location (Figure 2), allowing us
to establish that tight binding to Tic62 or TROL is necessary for the transient CEF associated with
the dark light transition (Figure 5A). In fact, the literature investigating a role for FNR activity in CEF
is extensive, with multiple inhibitor based studies supporting this hypothesis (Ravenel et al., 1994;
Shahak et al., 1981; Bendall and Manasse, 1995; Mills et al., 1979; Cleland and Bendall, 1992;
Ye and Wang, 1997; Hosler and Yocum, 1985). The actual function for FNR in higher plant CEF,
however, remains speculative: it has been proposed as a direct Fd:quinone reductase (Bojko et al.,
2003), or as a binding site for Fd to allow reduction of quinones via PgrL1 (Hertle et al., 2013) or
the Cyt b6f in both algae and higher plants (Buchert et al., 2018; Zhang et al., 2001;
Buchert et al., 2020). Although it is reported that interaction with Tic62 or TROL has no impact on
FNR activity (Alte et al., 2010), another possibility is that by binding to Tic62 or TROL, FNR
becomes less efficient at oxidising Fd. By default, reduced Fd would then donate electrons to other
pathways, including CEF. This would be consistent with the recent finding that the NDH complex
uses Fd as the direct electron donor (Yamamoto and Shikanai, 2013; Schuller et al., 2019). It has
recently been reported that both the NDH and antimycin A CEF pathways are regulated by the ATP:
ADP ratio (Fisher et al., 2019). In both cases ATP was found to act as a competitive inhibitor of
reduced Fd association. It follows that an increase in the rate of Fd oxidation by FNR would result in
greater ATP inhibition of CEF. Indeed, the fnr1 and fnr1-ZmFNR3 genotypes both show a greater
fast-component of NADP+ reduction (Figure 4), implying faster Fd oxidation at the onset of light,
and both genotypes also lack upregulated CEF following dark adaptation (Figure 5).
The fact that transient CEF does not occur when total FNR content is decreased in the fnr1
mutant (Figure 5A) and is decreased in FNR antisense tobacco (Joliot and Johnson, 2011) seems
to support an active role for FNR, as any default Fd oxidation pathway would be expected to
increase in these circumstances. Because several CEF pathways are regulated by redox signals
(Breyton et al., 2006; Takahashi et al., 2013; Strand et al., 2015; Strand et al., 2016), it also
remains possible that the impact of decreased FNR activity on CEF is indirect, through a failure to
effectively poise the NADP(H) pool.
FNR as a dynamic switch between LEF and CEF
Because the fnr1 and fnr1-ZmFNR3 genotypes, which lack Tic62 and TROL interaction (Figure 2C),
retain FNR bound to the thylakoid (Figure 3), the enzyme must occupy alternative, weaker binding
sites on the membrane following release from Tic62 and TROL. This is further supported by the IGL-
staining on illuminated leaves (Figure 6), in which Tic62/TROL interactions with FNR should be
Kramer et al. eLife 2021;10:e56088. DOI: https://doi.org/10.7554/eLife.56088 15 of 32Research article Plant Biology
250 0.30
A *** *** B
***
200 ** 0.25
*** **
0.20
electrons s -1
150
CEF / (total EF)
0.15
100
0.10
50
0.05
0 0
wt fnr1 wt fnr1
fnr1-ZmFNR1
fnr1-ZmFNR2
fnr1-ZmFNR3
fnr1-ZmFNR1
fnr1-ZmFNR2
fnr1-ZmFNR3
fnr1-ZmFNR1
fnr1-ZmFNR3
fnr1-ZmFNR2
fnr1-ZmFNR1
fnr1-ZmFNR3
fnr1-ZmFNR2
fnr1
fnr1
wt
wt
fnr1 fnr1 fnr1 fnr1
C
0.3 0.6
0.8 *
**
0.2 0.6 0.4
Y(NA)
Y(ND)
*
ФI
0.4
**
0.1
* 0.2
0.2
0 0 0
0.1 ** *
0.04
0.6
0.08
0.03
0.06
NPQ
0.4
qL
ФII
0.02
0.04
0.2
0.01
0.02
0 0 0
Figure 5. Impact of FNR location on photosynthetic electron transport in Arabidopsis following dark adaptation or light acclimation. (A) ECS
measurements after a 20 s high light pulse on dark adapted leaves (grey background) and light acclimated leaves (5 min 150 mE m 2 s 1, actinic light).
The relaxation kinetics of ECS were measured at 520–546 nm after a 20 s pulse of actinic light at 1100 mmol photons m 2 s 1 (LEF + CEF stimulating,
white boxes) or far red light (CEF stimulating, red boxes). Averages are shown for between five and seven independent measurements ± s.d. (B)
Relative amount of CEF as a function of total electron flow calculated from the data in (A). Figure 5—figure supplement 1 shows a comparable
experiment preformed with DCMU rather than far red light to drive PSI activity. (C) The response to high light in dark adapted leaves (grey background)
and light acclimated leaves (5 min 150 mE m 2 s 1, actinic light, white background) was measured by detecting chlorophyll fluorescence and P700
oxidation with saturating pulses following 20 s of actinic light at 1100 mmol photons m 2 s 1. Measurements are averages ± s.e. of 6–12 replicates of the
following genotypes: black, wt; white, fnr1; orange, fnr1-ZmFNR1; cyan, fnr1-ZmFNR2; purple, fnr1-ZmFNR3. Photosystem I parameters (quantum
efficiency, FI; donor limitation, Y(ND); acceptor limitation, Y(NA)) and photosystem II parameters (quantum efficiency, FII; non-photochemical
quenching, NPQ; photochemical quenching, qL). p-value significance in Tukey post hoc analysis of ANOVA is indicated as 0 ‘***’, 0.001 ‘**’ 0.01 ‘*’ 0.05
Figure 5 continued on next page
Kramer et al. eLife 2021;10:e56088. DOI: https://doi.org/10.7554/eLife.56088 16 of 32Research article Plant Biology
Figure 5 continued
‘.’. Unless indicated by bars, stars indicate variation from all other genotypes. Representative P700 and ECS traces are shown in Figure 5—figure
supplement 2.
The online version of this article includes the following figure supplement(s) for figure 5:
Figure supplement 1. DCMU inhibition of PSII for measurement of cyclic electron flow in Arabidopsis.
Figure supplement 2. Raw data from ECS and PSI responses to high light treatment.
disrupted (Alte et al., 2010; Benz et al., 2009), but FNR remains membrane bound. We have no
direct evidence for the identity of these weak sites of FNR-interaction, but it seems likely they
include proteins that have previously been reported as FNR interaction partners, such as PSI
(Andersen et al., 1992) or the Cytb6f (Zhang et al., 2001; Clark et al., 1984). Indeed, specific inter-
action between FNR and PSI has recently been demonstrated in vitro (Marco et al., 2019), and the
authors suggest a binding site comprising PsaE and the light harvesting complexes. Proximity to PSI
would result in more efficient flux of electrons from PSI to NADP+, consistent with the dominant fast
component of NADP+ reduction in the fnr1 mutant and fnr1-ZmFNR3 genotypes (Figure 4), where
all FNR is weakly associated (Lintala et al., 2007; Hanke et al., 2008; Figure 2). The fnr1 mutant is
also the only genotype with higher FNR density at the margin than on the lamellae (Figure 3), con-
sistent with the theory that LEF occurs predominantly on these regions of the thylakoid (Ander-
son, 1992; Chow et al., 2005). As the contribution of the slow component in NADP+ reduction
(Figure 4) matches the timescale of transient CEF on light to dark transition (Joliot and Joliot,
2005), and FNR interaction with Tic62 and TROL tethers is weakened in the light (Alte et al., 2010;
Benz et al., 2009) we tentatively propose the following model to explain our data: in the dark, a
large amount of FNR is sequestered at Tic62 and TROL on the lamellae in a location sub-optimal for
Fd oxidation, limiting NADPH production before carbon fixation is upregulated. In this location FNR
promotes CEF by an as yet uncharacterised mechanism, possibly related to Pgr5 and/or PgrL1. Over
light induction, these interactions are disrupted, and the enzyme relocates to associate with PSI,
resulting in increased efficiency of NADP+ reduction. This speculative model is presented in Fig-
ure 6—figure supplement 1. Our measurements of NADP+ reduction kinetics could be fitted by
two components (Figure 4A, Supplementary file 2c), while this model would imply three possible
changes in kinetics corresponding to dissociation, diffusion, and re-association. If the model in Fig-
ure 6—figure supplement 1A is correct, at least one component must be too fast to be detected.
This could either be diffusion, due to close proximity of the Tic62/TROL membrane tethers to PSI, or
association with PSI following a slow diffusion phase.
Although we propose that the slow phase of NADP+ reduction kinetics (Figure 4) results from
changes in FNR activity, we cannot exclude the possibility that it is caused by regulation of the rate
of NADP+ consumption. In this way, variable slow phase contributions could reflect differential regu-
lation (originating in the redox state of the Fd and NADP(H) pools) of fast, NADPH consuming enzy-
matic processes downstream. The dominant NADPH consuming reaction in the chloroplast is
catalysed by glyceraldehyde 3 P dehydrogenase (GAPDH) in the Calvin Benson Basham (CBB) cycle
of CO2 fixation, which is regulated by thioredoxin (Trx)-mediated thiol reduction and oxidised gluta-
thione (Wolosiuk and Buchanan, 1978). Indeed, we previously measured differences in both steady
state Trx regulation and glutathione redox poise associated with FNR abundance and membrane
localisation (Kozuleva et al., 2016). Because thiol reduction of GAPDH acts to increase allosteric
upregulation by 1,3 bisphosphoglycerate (Baalmann et al., 1995), and levels of CBB intermediates
in isolated chloroplasts are very low, leading to a lag phase in starting the cycle (Baldry et al., 1966)
it is unlikely that GAPDH activity will change significantly in dark adapted chloroplasts during the 30
s time-frame of our experiment. Nevertheless, it may be that even small changes in activity of such
an abundant enzyme could contribute to the kinetics shown here. We also previously found that
FNR abundance and location correlated with the thiol-mediated activation state of NADPH malate
dehydrogenase (NADP-MDH) (Kozuleva et al., 2016), another powerful sink, which is upregulated
much faster than GAPDH in isolated chloroplasts, as the allosteric regulator involved is NADPH itself
(Scheibe, 2004). We therefore repeated the NADPH kinetic measurements with an nadp-mdh
knock-out (Appendix 1—figure 1), but found no change in the amplitude of the slow phase of
NADP+ reduction relative to wild type. We cannot rule out an impact on other NADPH-dependent
Kramer et al. eLife 2021;10:e56088. DOI: https://doi.org/10.7554/eLife.56088 17 of 32You can also read