Task Based Discrimination - Erik Hurst, Yona Rubinstein, and Kazuatsu Shimizu - Becker Friedman Institute
←
→
Page content transcription
If your browser does not render page correctly, please read the page content below
WORKING PAPER · NO. 2021-40

Task Based Discrimination
Erik Hurst, Yona Rubinstein, and Kazuatsu Shimizu
JUNE 2021

                                                                     5757 S. University Ave.
                                               Ronzetti Initiative       Chicago, IL 60637
                                               for the Study of         Main: 773.702.5599
                                               Labor Markets              bfi.uchicago.edu
Task-Based Discrimination∗
             Erik Hurst            Yona Rubinstein                Kazuatsu Shimizu

                                          June 23, 2021

                                              Abstract

      Why did the Black-White wage gap converge from 1960 to 1980 and why has it stag-
      nated since? To answer this question, we introduce a unified model that integrates
      notions of both taste-based and statistical discrimination into a task-based model of
      occupational sorting. At the heart of our framework is the idea that discrimination
      varies by the task requirement of each job. We use this framework to identify and
      quantify the role of trends in race-specific factors and changing task prices in explain-
      ing the evolution of the Black-White wage gap since 1960. In doing so, we highlight
      a new task measure - Contact tasks – which measures the extent to which individuals
      interact with others as part of their job. We provide evidence that changes in the racial
      gap in Contact tasks serves as a good proxy for changes in taste-based discrimination
      over time. We find that taste-based discrimination has fallen and racial skill gaps have
      narrowed over the last sixty years in the United States. However, since the 1980s,
      the effect of declining racial skill gaps and discrimination on the Black-White wage
      gap were offset by the increasing returns to Abstract tasks which, on average, favored
      White workers relative to Black workers.

  ∗
    We thank Jack Hurst for his help in constructing some of the data files used within the paper. We
also thank David Autor, Joydeep Bhattacharya, Sandy Black, Kerwin Charles, David Deming, Chinhui
Juhn, Patrick Kehoe, Pat Kline, David de Meza, Derek Neal, Matt Notowidigdo, and Elena Pastorino for
helpful comments as well as seminar participants at Berkeley, Chicago, Edinburgh, Houston, LSE, the 2021
SOLE meetings, and Virginia. Author contact: erik.hurst@chicagobooth.edu, y.rubinstein@lse.ac.uk, and
kazuatsu@uchicago.edu.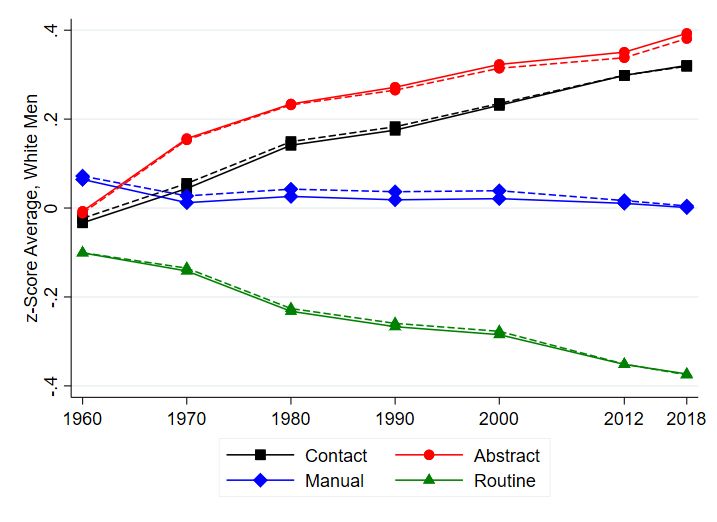
1       Introduction
Why did the Black-White wage gap decline so much during the 1960s and the 1970s, and
why has it stagnated since? After the passage of the Civil Rights Act, the unconditional
Black-White wage gap narrowed substantially from about 50 percent in the early 1960s to
about 30 percent by 1980. Some attributed the rapid growth in Black relative wages to
declining discrimination (Freeman (1973), Donohue and Heckman (1991)). Others pointed
to improvements in Blacks’ school quality and market skills (Smith and Welch (1989), Card
and Krueger (1992)). However, since 1980, the Black-White wage gap has remained constant.
The relative stagnation in labor market progress of Black men during the last forty years
has been seen as a puzzle given the documentation of notable declines since 1980 in White’s
reported discriminatory attitudes (Krysan and Moberg (2016), Lang and Lehmann (2012))
and a racial convergence in characteristics and skills that are rewarded in the labor market
(Altonji et al. (2012), Bayer and Charles (2018), Dickens and Flynn (2006), Murray (2007)).1
    In this paper, we introduce a framework that integrates racial skill gaps and various no-
tions of discrimination into a task-based model of occupational sorting. At the heart of our
framework is the idea that discrimination against Black workers varies by the task require-
ments of each job. For example, one can imagine that taste-based discrimination operates
more through tasks that require interactions with others, whereas statistical discrimination
is more likely to be present in tasks where there exist large racial differences in underlying
required skills.2
    Merging notions of discrimination and racial skill gaps into a task-based model of oc-
cupational sorting has two benefits. First, the framework allows us to explicitly model
and quantify how well-documented changes in task returns over time influence Black-White
wage gaps recognizing that Black and White workers sort into occupations with different
task requirements due to either labor market discrimination among equally skilled workers
or differences in endogenously determined labor market skills. Second, by measuring the
tasks content of jobs, we can better distinguish among different types of discrimination that
contribute to racial wage differentials. Disciplining this framework with detailed micro data
allows us to separately quantify the role of changing returns to tasks, declining racial prej-
    1
     While some measures of racial skill gaps have narrowed post-1980, like gaps in standardized test scores
as measured by the National Longitudinal Survey of Youths (NLSY), Neal (2006) documents that other
measures of racial skill gaps have not narrowed between 1980 and the early 2000s.
   2
     We wish to stress that taste-based and statistical-based motives for discrimination are neither mutually
exclusive nor unrelated. Specifically, the racial gaps in labor market skills reflect the intergenerational
transmission of discrimination via skills’ formation in early ages (Heckman et al. (2006)) or the influence of
schooling and job training later in life (Coate and Loury (1993)). Nevertheless, separating discrimination
from racial skill gaps is particularly useful – especially in modern economies – when the labor market returns
to certain skills are large and rising (Autor and Dorn (2013), Deming (2017)).

                                                      1
udice, and narrowing racial skills gaps in explaining the decline of the male racial wage gap
between 1960 and 1980 and its stagnation thereafter.
    The paper has three main sets of findings. First, we document a new set of facts about
how the propensities of Black and White men to sort into an occupation differ by types of
labor market tasks required in the occupation, and how those differences have evolved over
time. These facts are used as ingredients to estimate the evolution of race-specific barriers
faced by Black men in each task over the last half century in our model of occupational
sorting. Second, using our structurally estimated model and reduced-form estimates, we
offer a task-based explanation as to why racial wage gaps converged from 1960 to 1980 and
then stopped converging thereafter despite a narrowing of racial skill gaps and declining
measures of discrimination during this time period. We show that increasing returns to
tasks that require complex analytical activities (Abstract tasks) post-1980 relatively disad-
vantaged Black workers and masked wage gains resulting from improvements in race-specific
factors. Finally, bringing in additional micro data which includes measures of pre-labor
market skills, we separate changes in taste-based discrimination over time from changes in
other race-specific factors. We show that changes in the racial gap with respect to working
in occupations that require individuals to interact with customers and co-workers (Contact
tasks) is a good approximation for changes in taste-based discrimination over time.
    We now provide more details on each of these findings. In the first part of the paper we
present new facts about racial differences in occupational sorting. Drawing on the work of
Autor et al. (2003), Dorn (2009), Autor and Dorn (2013) and Deming (2017), we characterize
the task content of occupations along four key labor demand factors: “Abstract”, “Routine”,
“Manual ”, and “Contact”. The first three task measures come directly from Dorn (2009)
and Autor and Dorn (2013), while the last measure is new and guided by Becker (1957)’s
work on taste-based discrimination. Specifically, “Contact” measures the extent to which
an occupation requires interaction and communication with others within the organization
(co-workers) or outside the organization (customers/clients). This task provides a measure
of labor market activities where taste-based discrimination is likely to be the most salient
because the task requires interacting with others who may have discriminatory preferences.
Using data from the US Censuses and American Community Surveys (ACS), we document
that there was a large racial gap in the extent to which workers sort into jobs that require
Abstract tasks in 1960 and that gap has remained essentially constant through 2018. This
finding holds regardless of whether or not we control for trends in racial gaps in accumulated
levels of schooling. Conversely, we show that there has been a large racial convergence in
the Contact task content of jobs between 1960 and 2018. The large racial gap in the extent
to which workers sort into jobs that require Contact tasks that existed in 1960 has almost

                                              2
disappeared by 2018. These differential trends in the racial gaps in occupational sorting
associated with various tasks becomes the launching point for the rest of the paper.
    In the second part of the paper, we develop a model of task-based discrimination based on
the occupational sorting framework of Autor and Handel (2013). In our model, individuals
are endowed with task-specific skills that are drawn from a known distribution. There
are many potential tasks and, in turn, many different types of skills. Occupations are
combinations of tasks with different weights and individuals have different mixtures of skills.
We generalize the Autor and Handel (2013) model by allowing for: (1) individuals of differing
races to differ in the mean skill levels they have, (2) taste-based discrimination to differ by
task, (3) skills to be noisily observed by employers so as to have a meaningful notion of
statistical discrimination, and (4) a non-employment option so to match differential trends
in employment rates by race. The differences in pre-labor market skills and discrimination
facing Black workers give rise to differential sorting into tasks between Black and White
individuals in the spirit of Roy (1951). These sorting differences need to be accounted for
in order to parse out the effects of race-neutral driving forces (such as time trends in task
specific returns) and race-specific driving forces (such as a narrowing of racial skill gaps
and/or declining discrimination) when explaining changes in racial wage gaps over time.
Using the model structure and empirical moments on the differential occupational sorting
of Black and White men, the changing returns to various tasks, and the evolution of the
aggregate racial wage gap, we estimate the key driving forces of the model.
    Using our estimated model, we find that the stagnation in the racial wage gap post-1980
is a product of two offsetting forces. On the one hand, a narrowing of racial skill gaps and
declining discrimination between 1980 and 2018 caused the racial wage gap to narrow by 8
percentage points during this period, all else equal. On the other hand, the changing returns
to tasks since 1980 – particularly the increasing return to Abstract tasks – widened the
racial wage gap by about 7 percentage points during the same period. A rise in the return to
Abstract tasks disadvantages Black workers because they are underrepresented in these tasks
due to a combination of racial skill gaps and discrimination. In sum, the estimated model
highlights that race-specific barriers have continued to decline in the U.S. economy post-1980
but the rising relative return to Abstract tasks has favored Whites since 1980. As a result,
the Black progress stemming from narrowing racial skill gaps and/or declining discrimination
did not translate into Black-White wage convergence during this period. On the other hand,
we show that the relative wage gains of Black men relative to White men during the 1960
to 1980 period stemmed solely from declining discrimination and a narrowing of racial skill
gaps; changing task prices did not undermine any of these gains during this earlier period.
    Our structural model provides a road map to empirical researchers looking to uncover

                                              3
changing race specific factors in micro data. Specifically, the model suggests that researchers
must not only control for racial differences is skills but also for changes in the returns to
different skills when analyzing racial wage gaps over time. Using data from the NLSY, we
show that controlling for time-varying returns to skills uncovers a strong convergence in
racial wage gaps during the last four decades in the United States. The magnitude of the
convergence in the racial wage gap is similar to the effect of declining race specific factors
predicted by our structural model. With this discussion we also highlight why our task-based
model yields quantitatively different conclusions about the extent to which race-specific forces
have changed in the U.S. economy during the last forty years relative to methodologies that
rely on purely statistical decomposition procedures (e.g., Juhn et al. (1991)) which ignore
task-based sorting forces.
    In the third part of the paper, we go one step further and decompose the change in race-
specific forces over time into the part that is due to changes in racial skill gaps, the part due to
changes in taste-base discrimination, and the part due to changes in statistical discrimination.
The taste-based discrimination in our model is something akin to pure racial prejudice in
the spirit of Becker (1957) while statistical discrimination stems from employers using easily
observable characteristics such as race to forecast the expected productivity of their workers
in the spirit of Phelps (1972) and Arrow (1973). To perform this decomposition, we bring in
additional data from the 1979 and 1997 National Longitudinal Survey of Youths (NLSY’s).
Building on the work of Heckman et al. (2006), Altonji et al. (2012), and Deming (2017),
we exploit three pre-labor market skill measures in the NLSY: cognitive, non-cognitive and
social skills. The former is determined by respondent scores on AFQT tests while the latter
two are based on responses to survey questions designed to measure personality traits like
self-motivation, self-determination, and extroversion. We use these skill measures to impute
racial gaps in model-generated task-specific skills.
    We start by documenting the mapping between worker pre-labor market skills and the oc-
cupations to which they sort. In particular, we show that cognitive skills are most predictive
of entry into occupations that require Abstract tasks while social skills are most predictive
of entry into occupations that require Contact tasks. Additionally, we document large but
declining racial gaps in cognitive skills over time but find no racial gaps in social skills in
any of the time periods we explore.
    We then develop a procedure to translate racial gaps in NLSY skill measures into racial
gaps in model-generated task-specific skill gaps. The procedure consists of two steps. First,
we load our structurally-imputed average task-specific skills by occupation onto the NLSY
measures of average cognitive, non-cognitive, and social pre-labor market skills by occupa-
tion, as measured among White workers. Second, we use these loadings and the racial gap

                                                 4
in NLSY skills to create a model-based estimate of racial skill gaps associated with each task
in each period consistent with the racial skill gaps in the NLSY.
Based on this procedure, our model estimates that the convergence in the sorting into
occupations that require Contact tasks between 1960 and 2018 is driven almost entirely by
declining taste-based discrimination. This result stems from the fact that there are almost
no racial gaps in social skills, which implies that the racial barriers we estimate for Contact
tasks can be mainly attributed to taste-based discrimination. This finding confirms our ex-
ante conjecture that the evolution of the racial gap in Contact tasks is a good predictor of
the change in taste-based discrimination. To further provide evidence for this conclusion, we
use data from Charles and Guryan (2008), which provide survey-based measures of taste-
based discrimination for each U.S. state. Using cross-state variation, we show that racial
gaps in Contact tasks are strongly correlated with the Charles-Guryan state-level measures
of taste-based discrimination. We find a much weaker correlation with state-level measures
of racial gaps in Abstract tasks.
Finally, we use the estimated model to quantify how much the changes in each of the
driving forces over time contributed to the evolution of the racial wage gap over the last half
century. We estimate that at least half of the decline in the overall racial wage gap between
1960 and 2018 can be attributed to declining taste-based discrimination. On the other hand,
a racial gap in skills required for Abstract tasks explains much of the remaining racial wage
gap post-1980.
Before proceeding, we note that our work is closely related to the recent paper by Bayer
and Charles (2018). Bayer and Charles (2018) importantly attribute the lack of positional
improvement for median Black men since 1940 despite the narrowing of the racial education
gaps to differential trends in the returns to high school versus post-secondary schooling. The
rising return of college education relative to high school education disadvantaged Blacks as
they still disproportionately possess lower levels of school credentials. We use their result
as a launching point for our approach and study the trends in Black-White gaps conditional
on schooling. In particular, focusing on the fact that Black-White labor market progress
has stalled even conditional on education, we extend their insights to a task-based model
of occupational sorting with multiple tasks and show that higher returns to Abstract tasks
have disadvantaged Black men relative to White men even conditional on education.
Our paper is also related to the recent paper by Hsieh et al. (2019) which proposes and
estimates a multi-sector Roy model of occupational sorting with workers of different races
and gender who face differential frictions in both human capital and labor markets.3 The
3
There is an extensive literature exploring racial differences in labor market outcomes. Smith and Welch
(1989), Altonji and Blank (1999), and Lang and Lehmann (2012) provide excellent surveys of this literature.
5goal of Hsieh et al. (2019) is to provide a framework with economically meaningful sorting
to assess the role of changes in racial and gender barriers during the last half century to
economic growth. Our work complements this paper by extending the occupational sorting
decision to a multi-dimensional task frame work in the spirit of Autor et al. (2003), Acemoglu
and Autor (2011), and Autor and Handel (2013). Instead of trying to explain U.S. economic
growth, our goal is to use our model of sorting to decompose racial wage gaps into taste-based
discrimination, racial skill gaps, and statistical discrimination. Additionally, by embedding
our model of racial differences into a task model of occupational sorting, we can address
the extent to which changes in task returns can help to reconcile the puzzle as to why the
Black-White wage gap stagnated since 1980.
2 Data and Measurement
In this section, we provide an overview of the data and measures used throughout the paper.
The online appendix provides more detail on both our data and sample selection.
2.1 Task Measures
To assess whether Black and White workers sort into different jobs, preform different tasks
and consequently earn different amounts, we measure the skill demands in each occupation
using the following data: (i) the U.S. Department of Labor’s Dictionary of Occupational
Titles (DOT) and (ii) the Occupational Information Network (O*NET) sponsored by the
U.S. Department of Labor/Employment and Training Administration (USDOL/ETA). The
DOT was constructed in 1939 to help employment offices match job seekers with job openings.
It provides information on the skills demanded in over 12,000 occupations. The DOT was
updated in 1949, 1964, 1977, and 1991, and replaced by the O*NET in 1998.
We focus on four occupational task measures that are relevant for our study: Abstract,
Routine, Manual and Contact. The first three measures are taken exactly from Autor and
Dorn (2013) and Deming (2017) using the DOT data. Below, we provide a brief summary
of these measures. The last task measure is new and was created specifically for this paper
to help get at the concept of taste-based discrimination. Building on the work in Dem-
ing (2017), Contact measures the extent to which an occupation requires interaction and
communication with others within the organization (co-workers) or outside the organization
(customers/clients). The intensity of this task hence provides a measure of labor market
Surveying this literature is beyond the scope of our paper. But, it should be noted that our paper builds
upon the seminal papers modeling both taste-based (Becker (1957)) and statistical discrimination (Phelps
(1972), Arrow (1973), Aigner and Cain (1977), and Coate and Loury (1993)).
6activities where the intensity of taste-based discrimination is likely to be the most salient.
Our conjecture is therefore that the trend in the Black-White difference in the propensity
to sort into occupations that intensively require Contact tasks, conditional on other task
requirements, proxies the trend in the intensity of taste-based discrimination facing Black
workers. One of the main objectives of the paper is to provide evidence for this conjecture.
We now summarize the four task measures:
Abstract: indicates the degree to which the occupation (i) demands analytical flexibility,
creativity, reasoning, and generalized problem-solving and (ii) requires complex interpersonal
communications such as persuading, selling, and managing others. Occupations with high
measures of Abstract tasks include accountants, software developers, high school teachers,
college professors, judges, various medical professionals, engineers, and managers.
Routine: measures the degree to which the task requires the precise attainment of
set standards and/or repetitive manual tasks. Occupations with high measures of Routine
tasks include secretaries, dental hygienists, bank tellers, machinists, textile sewing machine
operators, dressmakers, x-ray technology specialists, meter readers, pilots, drafters, auto
mechanics, and various manufacturing occupations.
Manual : measures the degree to which the task demands eye, hand, and foot coordi-
nation. Occupations with high measures of Manual tasks include athletes, police and fire
fighters, drivers (taxi, bus, truck), skilled construction (e.g, electricians, painters, carpenters)
and landscapers/groundskeepers.
Contact: measures the extent that the job requires the worker to interact and communi-
cate with others (i) within the organization or (ii) with external customers/clients or potential
customers/clients. To create our measure of Contact tasks we use two 1998 O*NET work
activity variables taken from Deming (2017). Specifically, we use the variables Job-Required
Social Interaction (Interact) and Deal With External Customers (Customer).4 Interact mea-
sures how much workers are required to be in contact with others in order to perform the
job. Customer measures how much workers have to deal with either external customers (e.g.,
retail sales) or the public in general (e.g., police work). To make our measure of the Contact
task content of an occupation, we take the simple average of Interact and Customer for each
occupation. Occupations with high measures of Contact tasks include various health care
4
Deming (2017)’s focus is creating a measure of occupational tasks that require social skills and document
how the returns to social skills have increased over time. His measure of social skills include measures of
whether the job requires the worker to have social perceptiveness and the ability to coordinate, persuade
and negotiate with others. His measure of social skills do not include measures for whether the task requires
interactions with other co-workers or customers. He uses the measures of customer (Customer ) and broader
social interactions (Interact) as controls in some of his specifications. These questions are much more suited to
our purpose of trying to measure taste-based discrimination. We explore the relationship between Deming’s
Social Skills task measure and our Contact task measure in the online appendix.
7workers, waiter/waitress, sales clerks, lawyers, various teachers, and various managers.
Our goal is to stay as close as possible to the definitions of task measures developed by
others so as to provide new evidence on the racial differences in these measures. However, in
the online appendix, we show that the racial differences in the task content of occupations
that we highlight are very similar using alternative task definitions. We directly download all
of our DOT and O*NET measures from the replication kit associated with Deming (2017).
The occupational task measures are available at the 3-digit occupational code level. We use
Deming (2017)’s crosswalk to merge these measures to our samples from the other data sets
we use. A full discussion can be found in the online appendix.
Finally, we convert the task measures into z-score space by taking unweighted differences
across occupations. This transforms the units of our task measures into standard deviation
differences in the task content of a given occupation relative to all other occupations; an
Abstract task measure of 2.0 in a given occupation means that occupation has an Abstract
task requirement that is two standard deviations higher than the average occupation. Some
occupations require all tasks in relatively high intensities. For example, civil engineers have
Abstract, Routine, Manual, and Contact task intensities of 2.3, 1.2, 0.6, and 0.1, respectively.
Some other occupations require all tasks in relatively low intensities. For example, mail
carriers have Abstract, Routine, Manual, and Contact task intensities of -0.8, -1.5, -0.7, and
0.0, respectively. Other occupations are mixed in their task demands, and the differences
in task demands differentiate between occupations. For example, both physicians and retail
sales clerks are high in Contact intensities, but physicians are also high in Abstract task
intensities while retail sales clerks are low in Abstract task intensities.
2.2 Census and American Community Survey
To measure long-run trends and cross regional differences in the task content of occupations
and wages, we use data from the decennial U.S. Censuses from 1960 through 2000 and the
annual American Community Surveys (ACS) thereafter. We pool together the micro data
from the annual ACS’s between 2010 and 2012 and again between 2016 and 2018. We refer
to the former as the 2012 ACS and the latter as the 2018 ACS. Given this, we have seven
separate waves of harmonized data for the years 1960, 1970, 1980, 1990, 2000, 2012 and 2018.
Within each wave, we restrict our sample to Black and White native born men between the
ages of 25 and 54 who do not live in group quarters. We also exclude workers who are
self-employed. Finally, we always weight the data using the survey weights provided by the
Censuses and the ACS’s, respectively.
As discussed above, we use the DOT and O*Net data to define the task content of
8Figure 1: Trends in Black-White Wage Gaps Since 1960, Census/ACS Data
0 −.1
Wage Gap Relative to White Men
−.4 −.3 −.2
−.5
1960 1970 1980 1990 2000 2012 2018
Notes: Figure shows the trend in the demographically adjusted Black-White gap in log wages using
Census/ACS sample. Wage gaps are conditional on individual age and education dummies.
occupations. We hold the task content of an occupation fixed over time. We measure wages
as self-reported annual earnings during the prior year divided by self-reported annual hours
worked during the prior year. We only measure wages for individuals who are currently
employed working at least 30 hours per week and who reported working at least 48 weeks
during the prior year. We treat individuals who are not working as being in the home sector
occupation. In most specifications, we control for the worker’s age and accumulated years
of schooling. All values in the paper are in 2010 dollars.
Figure 1 shows the difference in log wages between Black and White workers conditional
on age and education using our sample of Census/ACS individuals. In particular, for each
year, we regress an individual’s log hourly wage on a race dummy and controls of age (five-
year age dummies) and series of dummies indicating the individual’s accumulated level of
education. Consistent with other findings in the literature, the demographically adjusted
racial wage gap narrowed substantially between 1960 and 1980 but has been constant at a
gap of roughly 20 log points since 1980.5 Our goal is to explain both the wage convergence
in Figure 1 between 1960 and 1980 as well as its stagnation post-1980.
5
Chandra (2000), Heckman et al. (2000) and Bayer and Charles (2018) caution the literature about
focusing on mean racial wage gaps over time given differential trends in labor force participation between
Black and White men. For this reason, we explicitly include a margin of labor force participation in the
model we develop below and highlight that our calibrated model matches moments of the wage distribution
inclusive of those who do not work.
92.3 National Longitudinal Survey of Youths
We augment our analysis with data from 1979 and 1997 waves of the National Longitudinal
Survey of the Youth (NLSY). The NLSY data allows us to link a worker’s subsequent occu-
pational choice with pre-labor market measures of cognitive, non-cognitive, and social skills.
The NLSY waves are representative surveys of 12,686 and 8,984 individuals, respectively,
who were 15 to 22 years old in 1979 or 13-17 years old in 1997 when they were first surveyed.
The surveys were conducted either annually or bi-annually every year since for each cohort.
When using the NLSY data, we restrict the main sample to Black and White non-self-
employed men 25 years of age and older.6 As with the Census/ACS data, we hold the task
content of occupations constant across both NLSY cohorts. Finally, in specifications where
we measure the evolution of the racial gap in the task content of occupations over time, we
restrict our NLSY samples to those aged 25-37. The reason for this is the cohort nature
of the NLSY data. In the 1980s/early 1990s, respondents from the NLSY-79 were in their
mid-20s to mid-30. Likewise in the 2010’s, respondents from the NLSY-97 were also aged
25-37. This restriction ensures that we are comparing the occupational sorting and monetary
rewards for young adults of similar ages when comparing across cohorts on the NLSY.
The key reason we use the NLSY data is to have measures of racial differences in pre-
labor market skills. We use measures of performance on cognitive test and psychometric
assessments to generate a set of unified proxies for cognitive, non-cognitive and social traits
across the two NLSY waves. These skill measures were primarily collected before the indi-
viduals entered the labor market. Again, our goal is to take these skill measures directly
from the existing literature. We summarize these measures briefly here and include a more
detailed discussion in the online appendix.
Cognitive Skills (COG): We follow the literature and use the respondent’s standard-
ized scores on the Armed Forces Qualifying Test (AFQT) as our measure of cognitive skills.
The AFQT is a standardized test which is designed to measure an individual’s math, verbal
and analytical aptitude. The test score was collected from all respondents in their initial
year of the survey and was measured in both the 1979 and 1997 waves.7
Non-cognitive Skills (NCOG): We use the measures of non-cognitive skills created
by Deming (2017). Deming (2017) uses questions pertaining to the Rotter Locus of Control
6
As in with the Census/ACS data, we measure wages as annual earnings divided by annual hours worked.
Following Altonji et al. (2012) and Deming (2017), we trim values of deflated hourly wage that are below
$2/hour and above $500/hour.
7
The AFQT score has been used by many in the literature to measure respondent’s cognitive skills
including Neal and Johnson (1996), Heckman et al. (2006), Neal (2006), Altonji et al. (2012) and more
recently Levine and Rubinstein (2017) and Deming (2017). We follow Altonji et al. (2012) and Deming
(2017) to generate age-adjusted AFQT scores.
10Scale and the Rosenberg Self-Esteem Scale for the NLSY79 cohort to make a measure of non-
cognitive skills.8 Likewise, for the NLSY97 cohort Deming (2017) uses respondent answers
(provided prior to entering the labor market) to the question “How much do you feel that
conscientious describes you as a person?” to approximate respondents’ non-cognitive skill.
Deming (2017)’s non-cognitive skill measures are expressed in z-score units.
Social Skills (SOC): We again follow Deming (2017) to generate a unified measure
of social skills using a standardized composite of two variables that measure extroversion
in both waves. Specifically, for the NLSY79, we use self-reported measures of sociability
in childhood and sociability in adulthood. Individuals were asked to assess their current
sociability (extremely shy, somewhat shy, somewhat outgoing, or extremely outgoing) and
to retrospectively report their sociability when they were age 6. For the NLSY97, we proxy
for social skills using the two questions that were asked to capture the extroversion factor
from the commonly-used Big 5 personality inventory. For each wave, we normalize the two
questions so they have the same scale and then average them together. We then convert
the measures into z-score units. Deming (2017) shows that these measures of social skills
positively predict individual wages when they are adults even conditional on controlling for
individual measures of cognitive skills (AFQT).
When using these skill measures, it is important to keep in mind that racial differences in
skills can be the results of current or past discrimination. A large body of research documents
the impact of interventions on different skills at different ages, suggesting that skills can
be fostered (Knudsen and Shonkoff (2006), Heckman (2008), Almond and Currie (2011),
Chetty et al. (2011) and Heckman and Kautz (2012)). Any racial differences in measures of
standardized tests or in personality assessments measured among teenagers therefore almost
certainly reflect differences in family, neighborhood or school environments stemming from
current or past discrimination.
3 Racial Differences in Occupational Tasks
In this section, we document a set of key facts on the differential evolution of the task
content of jobs between White and Black men during the last 60 years. We begin by showing
aggregate patterns from the Census/ACS data. We then use data from the NLSY to highlight
the relationship between pre-labor market skills and task-based occupational sorting.
8
The Rotter scale measures the degree of control individuals feel they possess over the life. The Rosenberg
scale measures perceptions of self-worth. Higher values of both are interpreted as high levels of non-cognitive
skills. For example, Heckman and Kautz (2012) documents notable associations between educational attain-
ment, health and labor market performance and these non-cognitive measures using NLSY data.
113.1 Trends in Racial Gaps in Tasks: Census/ACS
While much attention is focused on measuring racial wage gaps, less is known on racial
differences in occupational sorting by task requirements. In this subsection, we fill this gap
by documenting trends in racial task gaps from the early 1960s to the last 2010s. To measure
the racial gaps in task content of occupations, we estimate the following linear probability
model separately in each year restricting the sample using our sample of prime age men:
X
k
Blackijt = αt + βkt τijt + Γkt Xit + ijt . (1)
k
where Blackijt is a dummy variable equal to 1 if individual i working in occupation j during
k
year t is Black; τijt is the task content of task k for individual i working in occupation j in
period t; and Xit is a vector of individual 5-year age dummies and five dummies measuring
educational attainment (less than high school, high school, some college, a bachelor’s degree,
or more than a bachelor’s degree).9 Our coefficients of interest are the βkt ’s, which inform
the change in the proportion of Black workers associated with a one standard deviation
increase in task k requirements in year t, holding all other task requirements fixed. Each
yearly regression yields four βkt ’s – one for each of our four task measures.
The results of these regressions are summarized in Figure 2. Panels A and B, respectively,
show the patterns excluding and including the vector Xit of demographic controls. The main
take-away from the figure is that both the level difference in racial task gaps in 1960 and
the subsequent time series trend differ markedly by task. The differences are especially
pronounced when we compare the racial gaps in Abstract and Contact tasks. In the early
1960s, Black workers were systematically underrepresented both in occupations that required
a high intensity of Abstract tasks and in occupations that required a high intensity of Contact
tasks. In terms of magnitudes, in 1960 a one-standard deviation increase in the Abstract
task contents of an occupation reduced the probability that an individual working in that
occupation was Black by about 3 percentage points, and a one-standard deviation increase
in the Contact task contents reduced the probability that the individual was Black by about
4 percentage points, both conditional on education. Over the last half a century, however,
Black men have made significant progress relative to White men with respect to sorting
into occupations that require Contact tasks, while they made no progress relative to White
men in the extent to which they sort into occupations that require Abstract tasks. Whereas
9 k
In the online appendix, we show the raw trends in the τijk ’s by year for Black and White men separately.
The raw patterns for Abstract, Routine, and Manual tasks for White men are similar to the findings in Autor
k
and Dorn (2013). In the appendix, we also show a different specification where we regress τijt on a race
dummy and controls separately for each task in each year. The time series patterns for the coefficients on
the race dummies from this specification matches nearly identically to the patterns shown in Figure 2.
12Figure 2: Race Gaps in Task Trends
.01
.01
0
0
−.06 −.05 −.04 −.03 −.02 −.01
−.06 −.05 −.04 −.03 −.02 −.01
Task Racial Gap
Task Racial Gap
1960 1970 1980 1990 2000 2012 2018 1960 1970 1980 1990 2000 2012 2018
Contact Abstract Contact Abstract
Manual Routine Manual Routine
Panel A: No Controls Panel B: With Controls
Notes: Figure shows the estimated βkt ’s from the regression specified in equation (1). The co-
efficients measure the racial gap in the task content of occupations. Sample restricted to native
born individuals between the ages of 25 and 54 within the Censuses and ACS years who are not
self-employed and who are working more than 30 hours per week. Panel A excludes controls for age
and education while Panel B includes those controls. Standard errors on the coefficients (omitted
from the figure) had a value of less than 0.001 for all asks in all years.
the racial gap in Abstract tasks remained essentially constant through 2000 and widened
slightly after 2000, the large racial gap in Contact tasks that existed in 1960 has all but
disappeared by 2018. This finding persists whether or not we control for individual age and
education (Panel A vs. Panel B), although the level of the Abstract task gap narrows once we
control for them. If discrimination took the form of co-workers and customers not wanting
to interact with Black workers in 1960, the patterns in Figure 2 are consistent with that
form of discrimination abating over time.10 Although we focus on such differences to a lesser
extent, there were only small racial differences in the propensity for Black and White men
to work in occupations that require Manual tasks. Likewise, there was some convergence in
the propensity to work in occupations that require Routine tasks between 1960 and 1980,
but large racial gaps still remain post-1980.
There is a large body of research documenting that taste-based discrimination was ini-
tially larger in the South region of the U.S. in the 1960s and 1970s (relative to other regions)
and subsequently declined more in the South after 1980 (Charles and Guryan (2008), Bobo
et al. (2012)). If the racial gap in sorting into occupations that require Contact tasks reflects
taste-based discrimination, we should expect larger declines in the racial gap of this task
10
In the online appendix Figure A5, we show that both the sub-components of Contact tasks – interacting
with co-workers and interacting with customers – had large racial gaps in 1960 with those gaps narrowing
sharply through 2018.
13Figure 3: Census/ACS Task Content of Occupations: South Region vs Other Regions
.02
.02
0
0
−.02
−.02
Task Racial Gap
Task Racial Gap
−.04
−.04
−.06
−.06
−.08
−.08
−.1
−.1
1960 1970 1980 1990 2000 2012 2018 1960 1970 1980 1990 2000 2012 2018
Contact Abstract Contact Abstract
Panel A: South Region Panel B: All Other Regions
Notes: Figure replicates the analysis in Panel B of Figure 2 separately for individuals residing in
the South region (Panel A) and individuals residing in all other regions (Panel B).
measure in the South relative to other regions. Given that, we now explore cross-region vari-
ation in racial task gaps. Figure 3 replicates the analysis in Panel B of Figure 2 separately
for the individuals in the Census/ACS data living in the South region (Panel A) and all
other regions (Panel B). Consistent with our conjecture that the racial gap in Contact tasks
proxies for taste-based discrimination, the racial gap in Contact tasks was much larger in
the South relative to all other regions in 1960, and the subsequent convergence in Contact
tasks over the last half century was also greater in the South relative to the other regions.
Note, in both the South and the other regions, there was no racial convergence in Abstract
tasks over time despite the racial gaps in Abstract tasks being larger in the South.
The contrasting trends in racial task gaps – namely the persistence of the large racial gap
in Abstract tasks and the substantial narrowing of the racial gap in Contact tasks – highlight
the need for a task-based approach to analyzing racial discrimination in the US labor market.
The underlying factors that disadvantaged Blacks in the labor market – whether it may be
discrimination, racial skill gaps, or a combination of both – impacted Blacks differently across
tasks over time and induced differential trends in occupational sorting between Black and
White workers.
The value-added from using a task-based approach to understand trends in racial wage
gaps further arises where there are differential trends in task prices over time. To measure
how the price of each task has evolved over time, we run the following regressions separately
by year for each race group g using the the Census/ACS data:
14X
wijt = αtg + g k
βkt τijt + Γgkt Xit + ijt . (2)
k
where wijt is the log wage of individual i working in occupation j during year t. Our
g
coefficients of interest are again the βkt ’s, the Mincerian wage premium of task k in year t
for group g. For this regression, we use are sample of full-time workers.
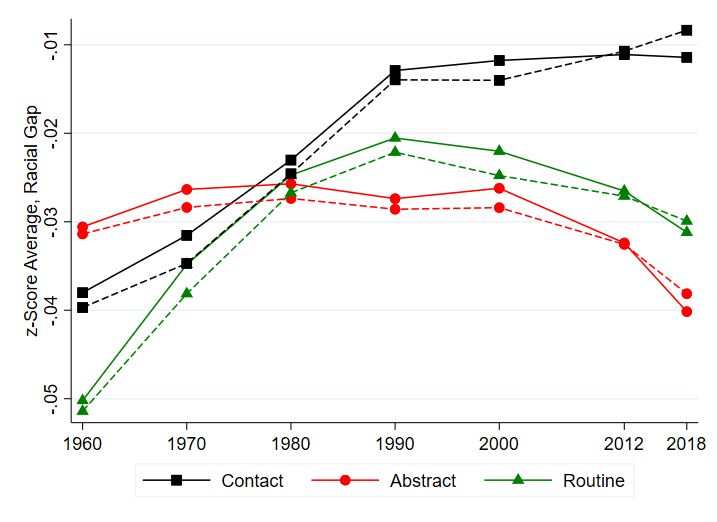
Figure 4 reports estimates of the raw wage premium by task requirement for White men
(Panel A) and the demographically adjusted Black-White gaps in the wage premium by
task requirement (Panel B). Three main findings emerge from this figure. First, the average
wage premium of Abstract tasks for White men was between 10 and 15 percent higher than
the return to the other tasks in 1960. Moreover, the relative return of Abstract tasks has
been increasing since 1980. This increase in the return to Abstract tasks has received lots
of attention in the literature (Autor and Dorn (2013), Deming (2017)). Second, in contrast,
the wage premium associated with Contact tasks was notably lower in the early 1960s and
has not changed much since then. Finally, the racial gaps in the wage premiums to tasks are
relatively small and roughly constant over time. Most of the racial gaps in the average task
returns are slightly negative suggesting that the task return to Black men are systematically
smaller than White men of similar age and education.
Figure 4: Mincerian Task Premiums, White Men and Racial Gap
.25
.25 .2
.2
Racial Gap in Task Return
Task Return, White Men
.15
.15
.1
.1
.05
.05
0 −.05
0
−.05
−.1
1960 1970 1980 1990 2000 2012 2018 1960 1970 1980 1990 2000 2012 2018
Contact Abstract Contact Abstract
Manual Routine Manual Routine
Panel A: White Men, Panel B: Racial Gap,
Unconditional Conditional
Notes: Figure shows the average labor market return to occupational task content for White men
in Panel A using our primary Census/ACS samples with the additional restriction that individuals
report working at least 48 weeks during the prior year. This panel shows coefficients from a
regression of log wages on the four task measures, separately by year. Panel B shows the racial
gap in average task returns of Black men relative to White Men conditional on education and age.
Before concluding this subsection, we briefly mention the variety of alternate specifica-
15tions we explored to examine the robustness of our results. All of the details of the robustness
exercises are discussed in more detail in the online appendix. One concern is that the task in-
tensities of occupations proxy the demand for general human capital rather than the demand
for specific tasks. To explore this concern, we re-estimated all our main analysis separately
segmenting our sample by those with less than a bachelor’s degree and those with a bach-
elor’s degree or more. Within both samples, we find that there was a racial convergence in
the Contact tasks and no racial convergence in Abstract tasks; although, the convergence in
the Contact tasks was much stronger among individuals with less than a bachelor’s degree.
These results highlight that our main findings about the time series patterns in racial task
gaps are not being driven by the educational requirement of the occupations associated with
the task. We also explored racial gaps in the task content of occupations for different birth
cohorts (as opposed to pooling different cohorts together and exploring time series patterns).
We find that the same patterns emerge across cohorts. In particular, whereas older cohorts
and younger cohorts have the same racial gap in Abstract tasks, the racial gap in Contact
tasks is large for older cohorts and almost zero for younger cohorts.11
3.2 Occupational Sorting and Racial Skill Differences
The ACS/Census data highlight racial differences in occupational sorting and how those
differences have evolved over time. We now use data from the NLSY to assess the extent to
which racial gaps in skill supplies can potentially explain racial gaps in sorting patterns. We
begin by reporting whether the mixture of tasks demanded in each occupation predicts the
mixture of skills supplied by workers who have sorted into the occupation. Specifically, we
focus on the matching between relative task demands and pre-labor market skills for White
men between the ages of 25 and 54 pooling together respondents from both the NLSY79 and
NLSY97 samples. The results are shown in Table 1. Each column comes from a separate
regression projecting an individual’s cognitive, non-cognitive or social skills on the relative
task content of the occupation in which they work. We define the relative task content of
occupation j in which individual i works as τijk − τ̄ij where τ̄ij is the simple average of the
Abstract, Routine, Manual, and Contact task measures for occupation j.12 Specifically, the
11
This paper focuses on labor market differences between Black and White men. The appendix, however,
also documents differences in task measures between White men and White women, as well as differences
between White women and Black women. Like their male counterparts, the gap in Abstract tasks between
Black and White women remained essentially constant since 1960. Further, the gap in Contact tasks between
Black and White women narrowed substantively between 1960 and 2018. We choose to focus on Black and
White men so as to abstract from the large trends in female labor supply that have also occurred during
this time period.
12
For example, suppose individual i works in occupation j = Civil Engineer. As noted above, the Abstract,
Routine, Manual, and Contact task content for the Civil Engineering occupation are, respectively, 2.3, 1.2,
16Table 1: The Matching Between Individual Skills and Relative Job Tasks
Cognitive Non-Cognitive Social
Skills Skills Skills
(1) Abstract Tasks 0.179 0.043 0.030
(0.015) (0.021) (0.020)
(2) Routine Tasks 0.077 0.010 0.004
(0.019) (0.025) (0.025)
(3) Contact Tasks 0.117 0.067 0.082
(0.019) (0.024) (0.023)
Difference (1) - (3) 0.062 -0.024 -0.052
(0.021) (0.029) (0.029)
Demographic Controls Yes Yes Yes
Notes: Table shows the relationship between the individual skills and the relative task content
of the individual’s occupation. Each column is a separate regression. The last row shows the
difference between the coefficient on relative Abstract tasks and relative Contact tasks. Robust
standard errors clustered at the individual level show in parenthesis. Data uses the pooled sample
of the NLSY 1979 and 1997 waves. Sample restricted to White men between the ages of 25 and
54. Individual skills and occupational task contents measured in z-score units.
regression coefficients in the first column of Table 1 come the following specification:
X
N LSY
Sij,cog =α+ ωk (τijk − τ̄ij ) + ΓXi + ij (3)
k
N LSY
where Sij,cog is the cognitive skill measure of individual i working in occupation j and Xi
is a vector of individual age and education controls. Our coefficients of interest are the ωk ’s.
Given collinearity, we omit the relative task measure for Manual tasks from the regression
implying that the ωk ’s should be interpreted as the effect of working in an occupation that
requires more of task k relative to Manual tasks on the cognitive skills of workers. In columns
2 and 3, we replace the dependent variable in equation (3) with the individual’s non-cognitive
N LSY N LSY
skills (Sij,ncog ) and social skills (Sij,soc ), respectively.
Table 1 highlights that individual skill supplies respond differentially to relative task de-
mands. Workers with higher cognitive skills are more likely to match with jobs that require
higher Abstract tasks and workers with higher social skills are more likely to match with jobs
0.6, and 0.1 (in z-score units). For individuals working in Civil Engineering, τ̄ij would equal 0.9 and the
relative task demand for Abstract tasks in this occupation would be 1.4 (2.3 - 0.9).
17that require higher Contact tasks. For example, occupations where their relative Abstract
task requirement is one-standard deviation higher attract workers who score approximately
0.2 standard deviations higher on cognitive tests. Occupations where their Contact tasks
requirement is one-standard deviation higher attract workers whose social score is 0.08 stan-
dard deviation higher. The results in this table highlight that the NLSY skill measures are
informative about the types of jobs into which individuals sort.
Having shown that the occupational task measures are associated with particular NLSY
skill measures within the sample of White men, we now explore differences in pre-labor
market skills between Black and White men within the NLSY cohorts.13 Table 2 reports
the racial gap in cognitive, non-cognitive, and social skills with various controls for the two
separate NLSY samples. The first column for each sample includes all NLSY respondents in
the sample without conditioning on employment; each of these samples has only one NLSY
respondent per regression. The remaining columns pool over all years and only include
individuals that were working. The second column within each sample adds no further
controls, while the third column controls for the individual’s maximum level of education
and the last column controls also for their occupation.
The main takeaway from this table is that the racial gap in cognitive skills is large and
narrows over time (especially for working men), whereas the gaps in non-cognitive and social
skills are relatively small and constant over time. As seen from Table 2, Black men from
the NLSY79 have AFQT scores that are 1.20 standard deviations lower than White men
from the NLSY79 cohort. The gap declines to 0.93 when we additionally control for racial
education and occupation differences. The race gap in AFQT scores narrowed somewhat
between the NLSY79 and NLSY97 cohorts but was still large at -0.58 standard deviations
conditional on education and occupation in the later period. On the other hand, the racial
skill gaps in non-cognitive and social skills conditional on education and occupation were
close to zero for both NLSY cohorts.
4 A Theory of Task Based Discrimination and Occu-
pational Sorting
Autor and Handel (2013) propose a Roy model where workers with differential skill en-
13
It is worth stressing again that racial differences in measures of pre-labor market skills are likely the
result of current or past discrimination. Such a caveat should always be kept in mind when interpreting our
results. For our purposes, these skill measures do predict occupational sorting patterns for both Black and
White men as highlighted above. But, to the extent that such differences exist, the differences likely stem
from factors such as differences in parental background, neighborhood choice, or school quality that resulted
from current or past discrimination.
18Table 2: Racial Gaps in Skill Measures (Z-Score Differences), NLSY Data
1979 Cohort 1997 Cohort
(1) (2) (3) (4) (5) (6) (7) (8)
(A) Cognitive Skills -1.17 -1.18 -1.01 -0.93 -0.96 -0.80 -0.62 -0.58
(0.03) (0.04) (0.03) (0.03) (0.05) (0.06) (0.05) (0.05)
(B) Non-Cog. Skills -0.20 -0.19 -0.10 -0.05 -0.12 0.06 0.16 0.17
(0.04) (0.04) (0.04) (0.04) (0.05) (0.07) (0.07) (0.07)
(C) Social Skills -0.09 -0.11 -0.09 -0.06 -0.17 -0.15 -0.14 -0.12
(0.04) (0.04) (0.04) (0.04) (0.05) (0.06) (0.06) (0.06)
Employed Only Sample No Yes Yes Yes No Yes Yes Yes
Education Controls No No Yes Yes No No Yes Yes
Occupation Controls No No No Yes No No No Yes
Sample Size Clusters 4,226 3,702 3,702 3,702 2,354 1,870 1,870 1,870
Sample Size Observations 4,226 22,479 22,479 22,479 2,354 7,923 7,923 7,923
Note: Table shows the racial gap in various NLSY skill measures for various samples and with various
controls. We show results separately for the 1979 cohort (columns (1)-(4)) and the 1997 cohort (columns
(5)-(8)). Cognitive skills are measured as normalized AFQT scores. All racial gaps are measured in
z-score differences between Black and White men. Columns (1) and (5) shows results for all individuals
regardless of employment status; in these specifications each individual is only in the sample once. In the
remaining columns we condition on the individual being employed in a given year. In these specifications,
individuals can be in the sample multiple times. Robust standard errors are in parentheses.
dowments self-select into occupations according to their task requirements. We utilize the
framework to build a task-based model of discrimination where racial differences in underly-
ing skills and the existence of labor market discrimination creates differential sorting patterns
between Black and White workers. Discrimination may take a form of taste-based or statis-
tical discrimination, and the extent to which statistical discrimination impacts the returns
will differ by tasks based on underlying gaps in average skill levels across racial groups.
As in Autor and Handel (2013), occupations are represented by bundles of K tasks, where
the relative importance of tasks differs across occupations. We denote the task content of
occupation j with a vector Λj = (λj1 , ..., λjK ) ∈ RK + . Workers, in turn, perform tasks by
allocating a unit of labor to the occupation of their choice, but each worker has differential
efficiencies at performing each type of tasks. We denote the skill-endowment of worker
i belonging to race group g with a vector Φgi = {φi1 , ..., φiK } ∈ RK + . In particular, we
suppose that each φik is drawn from a Frechet distribution with shape parameter θk and
scale parameter 1, both of which are common across race groups.14
14
The assumption that the scale parameter of the Frechet distribution equals one is innocuous as we let
19In absence of discrimination or racial differences in human capital, the potential log
output of worker i belonging to race group g in occupation j is given by:
X
ygij = αj + λjk φik ,
K
where αj is an occupation-specific constant that represents the potential log output of a
worker with no skills in occupation j. If employers possess perfect information on individual
worker’s skills φik ’s – an assumption we will relax below – workers are paid their marginal
revenue product, so that their potential log earnings in occupation j is given by:
X
wgij ≡ pj + ygij = Aj + λjk φik ,
K
where pj is the log price of the output of occupation j and Aj ≡ pj + αj . Conditional on
working, each worker self-selects into the occupation j that maximizes her utility, which
is the sum of log earnings and her non-pecuniary idiosyncratic preference for occupations
log νij :
ugij = wgij + log νij .
We suppose that νij is drawn from a Frechet distribution with shape parameter ψ and a
normalized scale parameter of 1, both of which are common to all race groups.
Workers sort based on their comparative advantage. The optimal occupational choice of
worker i in group g is given by
∗
jgi = arg maxj=1,...,J,H {ugij } . (4)
Everything else equal, occupations that require a large amount of one type of tasks tend
to attract workers who are good at performing that type of tasks. So an occupation that
requires many Abstract tasks will tend to attract workers with higher Abstract skills than an
occupation that requires few Abstract tasks, assuming that the two occupations are identical
in other task requirements. This is the basic Autor and Handel framework.15
New to our model is differential returns to performing each type of tasks across different
the λ’s to be scaled freely when calibrating the model. In addition, below we will introduce a parameter that
controls differentials in overall skill-endowment levels across racial groups which is equivalent to allowing for
a differential scale parameter between Black and White individuals.
15
The original Autor and Handel framework does not have the idiosyncratic preference for occupations. It
is added here to give the model an extra level of flexibility to fit differentials in employment across otherwise
similar occupations. Below, we further expand on the Autor and Handel model by including racial groups
that differ by average skill levels, modeling both taste-based and statistical discrimination, and adding a
meaningful home sector.
20You can also read