Bachelor thesis - Analysing and visualising data to improve the productivity level - University of Twente Student Theses
←
→
Page content transcription
If your browser does not render page correctly, please read the page content below

Analysing and visualising data to improve the productivity level
                 of an Agile organised company

                     Bachelor thesis

                       Ceret van der Vegt
                Industrial Engineering & Management
                             Bachelor
                       University of Twente
                             02-07-2021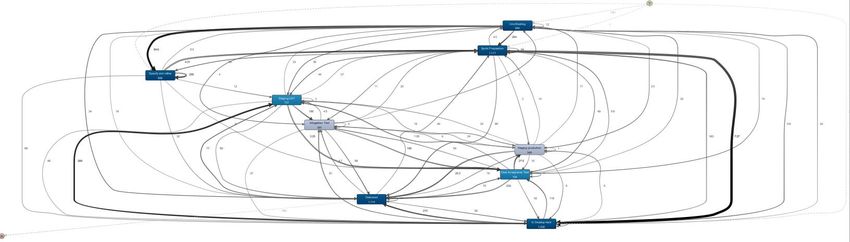
Analysing and visualising data to improve the productivity level
                          of an Agile organised company

Author                                               University of Twente
Ceret van der Vegt                                   Drienerlolaan 5
S2145677                                             7522 NB Enschede
BSc Industrial Engineering & Management              Netherlands

A.S. Watson Group                                    First supervisor
Nijborg 17                                           prof. dr. J. van Hillegersberg
3927 DA Renswoude                                    Faculty of BMS, IEBIS
The Netherlands

Supervisor A.S. Watson Group                         Second supervisor
Mr. B. Jekel                                         dr. G. Sedrakyan
A.S. Watson Group IT Europe                          Faculty of BMS, IEBIS
Product owner

                                                                        Page 2 of 92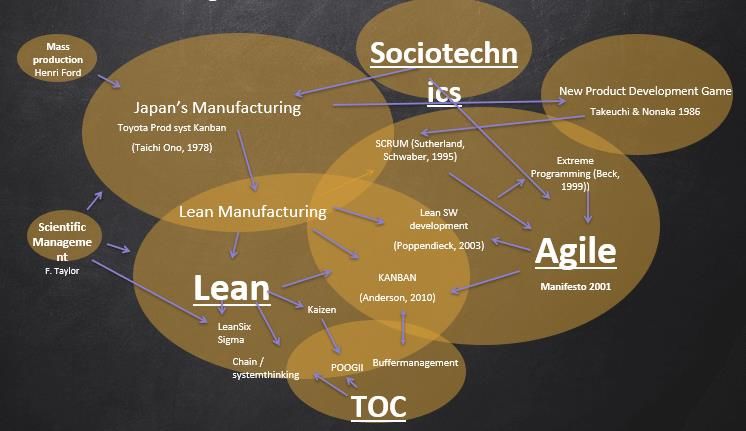
Preface
This document contains my bachelor thesis on “how to analyse and visualise data to improve the
productivity level of an Agile organised company”, to complete the bachelor Industrial Engineering and
Management at the University of Twente.

I would like to thank my company supervisor Bram Jekel for supporting me every Friday morning during
my research. I would like to thank Laurens Priemis for giving me the opportunity to do my graduation
at the CRM Tribe of A.S. Watson. Also a special thanks to Menno Noorloos, who supported me during
my research on the IT systems and different coding parts.

Furthermore, I would like to thank my supervisor Jos van Hillegersberg from the University of Twente,
for sharing his enthusiasm about the subject and providing me feedback. Moreover, I would like to
thank Gayane Sedrakyan for providing me feedback on my concept version to bring my research to a
higher level. Besides my supervisors, a special thanks to my fellow student Lisa Nonhof, for stimulating
each other and for her suggestions on improving my research.

Ceret van der Vegt

                                                                                           Page 3 of 92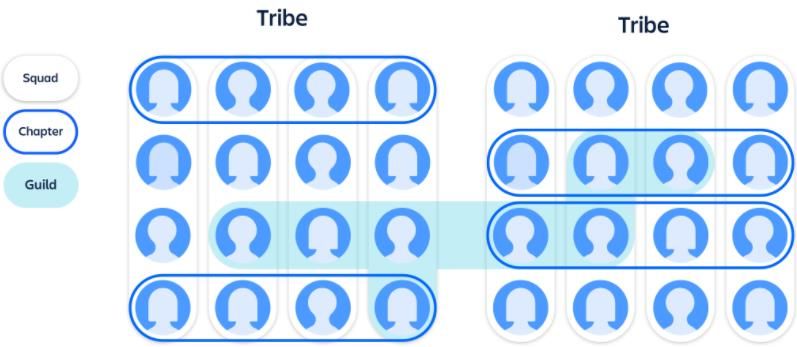
Management summary

Introduction
AS Watson Group is the world’s largest international health and beauty retailer. The Group is a member
of CK Hutchison Holdings, also known as Hutchison Whampoa. A.S. Watson operates in four different
sectors: health & beauty, luxury perfumeries & cosmetics, food, electronics & wine and last beverages.
The CRM department, part of Group IT Europe, is responsible to deal with the software related
changing needs of its customers to put a smile on its customers’ faces.

Research is conducted within this CRM department. The CRM department is continuously improving
the process to ensure their services are matching the changing techniques and needs of their internal
as well as external customers as closely as possible. Having an optimal productivity level is importa nt
to ensure high quality of their services in this dynamic environment. To be able to respond adequately
to those changing needs, a clear overview of different processes is necessary. However, A.S. Watson
is not aware of which problems are affecting the productivity level. Currently, decisions to react on
changing needs are made based on feelings instead of on data. Therefore, a dashboard with a set of
metrics suitable for the CRM Tribe is necessary to identify the problems affecting the productivity level
to be able to ensure high quality solutions.

Research approach
To identify a proper solution for the company, different research methods were used. A company
analysis is conducted by doing a bottleneck analysis with process mining and by having conversations
with employees, a survey is held, literature reviews are conducted, data is analysed, and the own
expertise is used.

The solution
During the research, the following is found to solve the problem:

    1)   Important bottlenecks to monitor
    2)   Desired improvements by employees
    3)   Suggestions on increasing productivity by literature
    4)   Visualisation suggestions on tools and charts
    5)   Optimal set of metrics with explanations
    6)   Recommended dashboards

Conclusions & recommendations
A combination of the findings above results in a recommendation for a CRM Tribe (department)
dashboard with concerning CRM Squads (teams) dashboards. The bottleneck analysis provides the
input which is important to focus on, together with the desires from the employees and the
suggestions from literature. As a result, the recommended set of metrics focus on quality, productivity,
and performance. Five tools are selected as suitable and several recommendations are provided on
how to visualise the data on the dashboard. A demo dashboard is provided to visualise the solution.

By increasing the number of available indicators to a well-determined set of metrics and by increasing
the awareness of the need for data visualisation, the core problem has been solved.

                                                                                            Page 4 of 92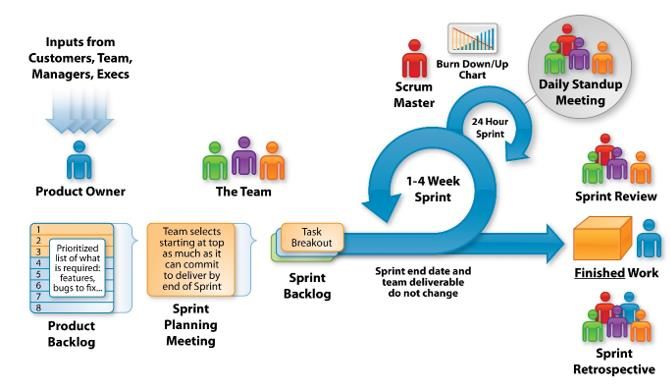
Table of Contents
Reader’s guide.............................................................................................................................. 7
Definitions ................................................................................................................................... 8
List of figures................................................................................................................................ 9
List of tables ................................................................................................................................10
1. Introduction ............................................................................................................................11
   1.1. Introduction to A.S. Watson Group .....................................................................................11
       1.1.1.        Scope of the research .............................................................................................12
   1.2. Problem identification ........................................................................................................12
       1.2.1.        Reason for research ...............................................................................................13
       1.2.2.        Problem statement ................................................................................................13
       1.2.3.        Core problem.........................................................................................................13
   1.3. Problem solving approach ..................................................................................................14
       1.3.1.        Research methodology ...........................................................................................14
       1.3.2.        Research goal ........................................................................................................14
       1.3.3.        Research questions ................................................................................................15
   1.4. Problem quantification .......................................................................................................17
2. Company analysis ....................................................................................................................18
   2.1. The current work process ...................................................................................................18
       2.1.1.        CRM in Group IT of A.S. Watson ..............................................................................18
       2.1.2.        The Agile principles ................................................................................................19
       2.1.3.        The A.S. Watson model ..........................................................................................22
   2.2. Problem analysis ................................................................................................................26
       2.2.1.        The bottlenecks .....................................................................................................26
       2.2.2.        The productivity level .............................................................................................37
       2.2.3.        The bottlenecks and the actors involved..................................................................38
   2.3. Desired situation................................................................................................................38
       2.3.1.        Desired metrics ......................................................................................................38
       2.3.2.        Survey ...................................................................................................................39
3. Theory on improving productivity level of an Agile organised company.....................................40
   3.1. Agile optimisations on improving productivity suggested in research ....................................40
       3.1.1.        Systematic Literature Review ..................................................................................40
       3.1.2.        Suggestions on the framework................................................................................47
   3.2. Suggested indicators by research ........................................................................................48
       3.2.1.        Suggestions from literature review..........................................................................48
       3.2.2.        Suggestions by experts ...........................................................................................50

                                                                                                                               Page 5 of 92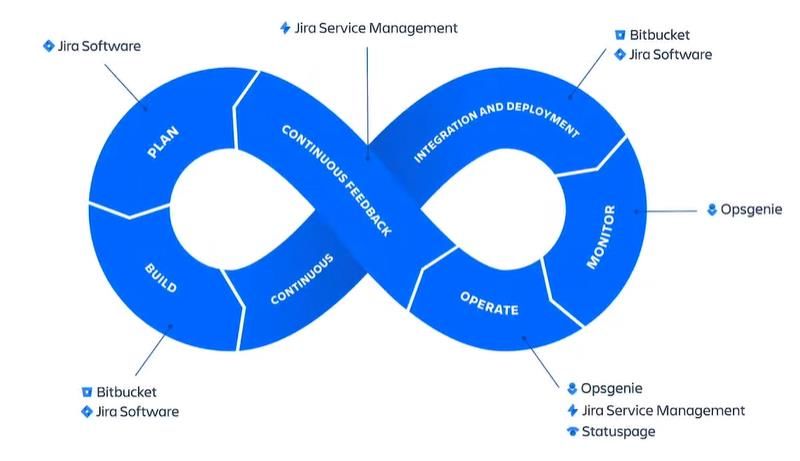
3.2.3.        Results ..................................................................................................................50
   3.3. Data visualisation ...............................................................................................................51
       3.3.1.        Analysis and visualisation .......................................................................................51
       3.3.2.        The design .............................................................................................................54
       3.3.3.        Implementation .....................................................................................................55
4. Improving the productivity level of the CRM Tribe by using suggested metrics ..........................56
   4.1. The metrics........................................................................................................................56
   4.2. The dashboard ...................................................................................................................58
   4.3. Evaluation .........................................................................................................................59
5. Conclusion, recommendations & limitations.............................................................................60
   5.1. Conclusion .........................................................................................................................60
   5.2. Recommendations .............................................................................................................61
   5.3. Limitations.........................................................................................................................63
References ..................................................................................................................................64
Appendix ....................................................................................................................................67
   Appendix A Agile Manifesto ......................................................................................................67
   Appendix B Data analysis ..........................................................................................................68
       Jira report cumulative flow diagram.......................................................................................68
       Jira report control chart ........................................................................................................68
       Jira report average age .........................................................................................................69
       Jira report resolution time.....................................................................................................70
       Script ...................................................................................................................................71
       Disco analysis .......................................................................................................................72
   Appendix C Survey....................................................................................................................73
   Appendix D Systematic Literature Review ..................................................................................77
       SLR – 1 .................................................................................................................................77
       SLR – 2 .................................................................................................................................81
   Appendix E Data visualisation....................................................................................................84
       Jira.......................................................................................................................................84
       Python .................................................................................................................................85
   Appendix F Dashboard ..............................................................................................................89

                                                                                                                                  Page 6 of 92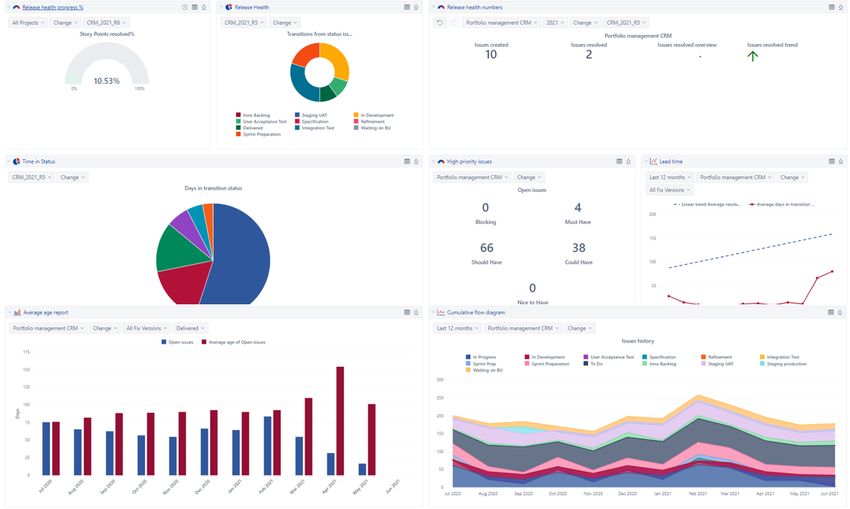
Reader’s guide
The research on analysing and visualising data to improve the productivity of an Agile organised
company is structured in five chapters. To explain the structure of the report, a brief introduction per
chapter is provided below.

Chapter 1. Introduction
Chapter 1 provides all details to understand the company, the problems there are, the reason why it
needs to be researched and the research strategy. This chapter provides the approach taken to solve
the core problem, and research questions are provided to achieve the research goal.

Chapter 2. Company analysis
For analysis and visualisation, it is important to have an overview of the bottlenecks. Chapter 2
provides a clear explanation of the principles of the department in which research takes place. An
insight into the bottlenecks is given by analysing available reports and by applying the technique
process mining. The needs of the company are investigated in this chapter as well. The results from
the bottleneck analysis and the needs addressed by the employees serve as important input for the
solution.

Chapter 3. Theory on improving productivity level of an Agile organised company
Chapter 3 provides the suggestions and theory from literature needing to improve the productivity
level. More important, it indicates which indicators are important for data visualisation. The way data
should be visualised within a company using the Agile principle is addressed as well within this chapter.

Chapter 4. Improving the productivity level of the CRM Tribe by using suggested metrics
This chapter provides the solution on how to solve the core problem together with a demo dashboard.

Chapter 5. Conclusion, recommendations & limitations
This chapter concludes whether the solution solves the core problem and to what extent the norm set
by the company has been achieved. Recommendations are given and limitations are explained.

                                                                                            Page 7 of 92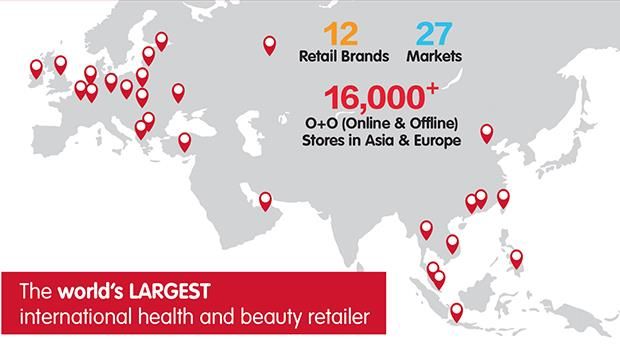
Definitions

  Definition            Explanation

  CRM                   Customer Relationship Management

  CRM Tribe             Name of CRM department in Agile terms

  Business unit (BU)    For A.S. Watson a group of customers (e.g. Kruidvat) doing a request

  Ticket                Another term for the work item that must be addressed

  Issue                 Agile term which could represent a story, bug, or task in a project

  Topdesk               Software service desk

  GIC Project           All tickets related to CRM software changes

  Native integration    A pair of applications provide direct integration with one other via APIs

  Real-time dashboard Type of visualisation automatically updating the most current data available

  Metric                A quantifiable measure for comparing and tracking performance

                                                                                                    Page 8 of 92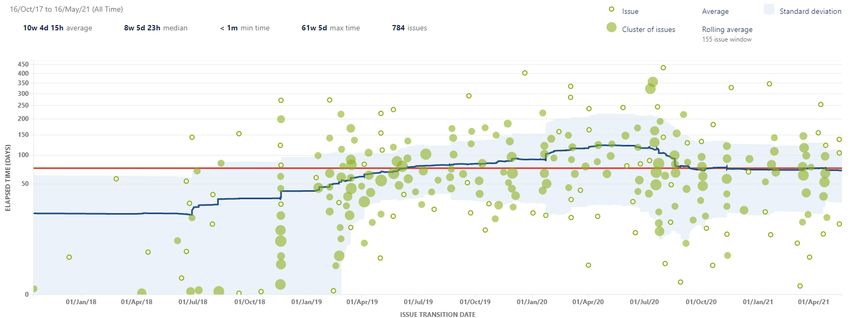
List of figures
Figure 1: Markets in which A.S. Watson operates (A.S. W atson, 2020) .......................................................................................................................... 11
Figure 2: A.S. Watson’s brands ................................................................................................................................................................................................ 11
Figure 3: Organogram ............................................................................................................................................................................................................... 12
Figure 4: Problem cluster ......................................................................................................................................................................................................... 13
Figure 5: Problem solving approach ....................................................................................................................................................................................... 14
Figure 6: Overview of the research questions...................................................................................................................................................................... 16
Figure 7: Reality vs Norm ......................................................................................................................................................................................................... 17
Figure 8: Scrum framework ..................................................................................................................................................................................................... 20
Figure 9: Scaling Agile at Spotify (Cruth, 2021) .................................................................................................................................................................... 21
Figure 10: Nexus framework (Scrum.org, 2021) .................................................................................................................................................................. 21
Figure 11: Roots of Agile .......................................................................................................................................................................................................... 22
Figure 12: Organisation of CRM Tribe.................................................................................................................................................................................... 22
Figure 13: Main roles ................................................................................................................................................................................................................ 22
Figure 14: Scrum process ......................................................................................................................................................................................................... 23
Figure 15: Incoming request.................................................................................................................................................................................................... 24
Figure 16: Process structure .................................................................................................................................................................................................... 24
Figure 17: Change management process flow ..................................................................................................................................................................... 25
Figure 18: Incoming request flow ........................................................................................................................................................................................... 25
Figure 19: Cumulative flow diagram (CFD) ........................................................................................................................................................................... 26
Figure 20: Control chart............................................................................................................................................................................................................ 27
Figure 21: Average age report................................................................................................................................................................................................. 28
Figure 22: Resolution time report .......................................................................................................................................................................................... 28
Figure 23: Input in Advanced Report ..................................................................................................................................................................................... 29
Figure 24: Process flow Jira...................................................................................................................................................................................................... 30
Figure 25: Animation of the flow generated by Disco (100% activities, 0% paths) ....................................................................................................... 31
Figure 26: Control-flow perspective (left) and performance perspective (right) of the process model generated by Disco ............................... 32
Figure 27: Case duration generated by Disco for tickets between 2016 -2021 .............................................................................................................. 33
Figure 28: Events per case generated by Disco (10 events) for tickets between 2016 -2021 ...................................................................................... 33
Figure 29: Case duration generated by Disco between 2019-2021 ................................................................................................................................. 34
Figure 30: Events per case generated by Disco (10 events) for tickets between 2019 -2021 ...................................................................................... 34
Figure 31: Example of data uncertainty ................................................................................................................................................................................ 35
Figure 32: Problems to visualise ............................................................................................................................................................................................. 36
Figure 33: Currently available metrics ................................................................................................................................................................................... 37
Figure 34: Desired metrics ....................................................................................................................................................................................................... 39
Figure 35: DevOps cycle (Atlassian, 2019) ............................................................................................................................................................................ 47
Figure 36: Result of exporting data from Jira ....................................................................................................................................................................... 51
Figure 37: Format of exported data with python ................................................................................................................................................................ 52
Figure 38: Dashboard design guidelines................................................................................................................................................................................ 54
Figure 39: Overview of charts ................................................................................................................................................................................................. 55
Figure 40: Recommended metrics.......................................................................................................................................................................................... 56
Figure 41: Metrics for CRM Tribe dashboard ....................................................................................................................................................................... 58
Figure 42: Metrics for CRM Tribe dashboard ....................................................................................................................................................................... 58
Figure 43: Demo dashboard .................................................................................................................................................................................................... 59
Figure 44: Cumulative flow diagram ...................................................................................................................................................................................... 68
Figure 45: Control chart............................................................................................................................................................................................................ 68
Figure 46: Average age report................................................................................................................................................................................................. 69
Figure 47: Resolution time ....................................................................................................................................................................................................... 70
Figure 48: Jira Script for data extraction ............................................................................................................................................................................... 71
Figure 49: Control-flow perspective generated by Disco (100% activities, 100% path) ............................................................................................... 72
Figure 50: Overview of tickets in Jira) .................................................................................................................................................................................... 84
Figure 51: Anaconda platform................................................................................................................................................................................................. 85
Figure 52: Installing jira library ................................................................................................................................................................................................ 85
Figure 53: The dashboard ........................................................................................................................................................................................................ 89
Figure 54: Release health metric ............................................................................................................................................................................................ 90
Figure 55: High priority issues ................................................................................................................................................................................................. 91
Figure 56: Days in status metric .............................................................................................................................................................................................. 91
Figure 57: Lead time metric ..................................................................................................................................................................................................... 91
Figure 58: Average age metric ................................................................................................................................................................................................ 92
Figure 59: Cumulative flow metric ......................................................................................................................................................................................... 92

                                                                                                                                                                                                             Page 9 of 92
List of tables
Table 1: Factors affecting productivity (Fate ma & Sakib, 2018) ....................................................................................................................................... 41
Table 2: Metrics ......................................................................................................................................................................................................................... 48
Table 3: Metrics classified in four perspectives ................................................................................................................................................................... 49
Table 4: Set of Metrics .............................................................................................................................................................................................................. 50
Table 5: Balanced scorecard for dashboard tools................................................................................................................................................................ 53
Table 6: Results of balanced scorecard ................................................................................................................................................................................. 53
Table 7: Inclusion and Exclusion criteria ............................................................................................................................................................................... 77
Table 8: Search terms ............................................................................................................................................................................................................... 78
Table 9: Initial search results ................................................................................................................................................................................................... 78
Table 10: Results ........................................................................................................................................................................................................................ 79
Table 11: Inclusion and Exclusion criteria ............................................................................................................................................................................. 81
Table 12: Search terms ............................................................................................................................................................................................................. 82
Table 13: Initial results.............................................................................................................................................................................................................. 82
Table 14: Final results ............................................................................................................................................................................................................... 83

                                                                                                                                                                                                              Page 10 of 92
1. Introduction
In the first chapter, an introduction to the company and its problem is provided. The approach for
solving the problem is given by explaining the research questions to be solved.
1.1. Introduction to A.S. Watson Group
A.S. Watson Group is the world’s largest international health and beauty retailer. The Group is a
member of CK Hutchison Holdings, also known as Hutchison Whampoa. The holding has f our core
businesses in 50 countries: ports and related services, telecommunications, infrastructure and retail
(Atlassian, 2021a). This research is focused on the retail sector, represented by A.S. Watson Group.
The group has over 16,000 stores located in Asia & Europe, visualised in Figure 1 (Watson, 2020).
Figure 1: Markets in which A.S. Watson operates (A.S. Watson, 2020)
A.S. Watson operates in four different sectors: health & beauty, luxury perfumeries & cosmetics, food,
electronics & wine, and last beverages. The different sectors are divided into different brands, also
called business units. An example of one of the business units is Kruidvat, which is probably familiar to
almost everyone in the Netherlands. To understand the Group, the different business units are
visualised in Figure 2 (Watson, 2020).
Figure 2: A.S. Watson’s brands
Page 11 of 921.1.1. Scope of the research
Since A.S. Watson is a large company, research is conducted within one department of the Group. With
the help of Figure 3, the scope of the research becomes clear. As depicted, A.S. Watson Group consists
of an E lab, ASW Benelux and Group IT. The latter is divided into two continents; Asia and Europe.
Research is focused on Group IT Europe, specifically within the Customer Relationship Management
(CRM) department.
Figure 3: Organogram
1.2. Problem identification
The problem occurs in the CRM department, organised based on the Agile principle. Therefore, the
CRM department is further called the CRM Tribe. The CRM Tribe is responsible for handling software
related issues and requests from the Business Units. The request or issue, also called ‘ticket’, comes
across several phases within the CRM Tribe. Because the CRM Tribe is Agile organised, all phases are
related to each other. One problem in a specific phase could therefore cause another problem in a
different phase. There are two types of problems, the knowns and the unknowns. On the one hand,
A.S. Watson is aware of the fact that some factors or actions are having a consequence on the
productivity level. These actions are the known problems. An example is the lack of communication
between the different development teams concerning a cross-team ticket. On the other hand, there
are actions affecting the productivity level the company is not aware of. Those are the unknown
problems. The consequences of both the known and unknown problems are for example long lead
times and missed agreed deadlines, all having an impact on the productivity level.
Page 12 of 921.2.1. Reason for research
The main characteristic of Agile is the iterative approach. Terms like continuous improvement and
responding quick and easy describe the approach. The CRM Tribe is continuously improving the
process to ensure their services are matching the changing techniques and needs of their internal as
well as external customers as closely as possible. Having an optimal productivity level is important to
ensure high quality of their services in this dynamic environment. Therefore, it is important to identify
the problems affecting the productivity level first. Besides, it is of importance to identify indicators to
keep track of the problems. When having a clear picture of the indicators affecting the productivity
level, adequate response to changes is possible.
1.2.2. Problem statement
Within the software industry, it is important to meet the changing needs of the customers. To be able
to respond adequately to those changing needs, the productivity of the process should be optimal.
However, A.S. Watson is not aware of which known and unknown problems are affecting the
productivity level. Therefore, the action problem is: “the productivity level is lower than desired.” To
deal with the action problem, it is important to identify both the known and unknown problems to
increase productivity. Currently, there is no insight into those important factors. When having no
insight, it is hard to make decisions to react to problems or changes. Since the CRM Tribe is Agile
organised, all phases are related. One problem arising in a specific phase is causing other problems in
different phases. To visualise the problems, a problem cluster is created which is depicted in Figure 4.
Figure 4: Problem cluster
1.2.3. Core problem
From the problem cluster can be concluded that there are several problems all causing a lower
productivity level than desired. However, it is unclear to what extent the problems are having an
impact on the process, which is a problem to be able to increase productivity. It is proven in literature
that data visualisation, instead of using all the raw data which is available, provides a quick insight into
the problems to explore, discover, summarise and present, such that adequate response is possible
(Sedrakyan et al., 2019). Not having visualisations can cause a lack of overview. To solve the action
problem and thus improve the productivity level, a clear insight into the extent of the problems is
necessary, which is currently lacking because of the few visualisations available. Following the problem
cluster, the limited level of data visualisation is a problem that needs to be solved, leading to the
following core problem:
“Limited level of data visualisation to identify known and unknown problems”
Page 13 of 921.3. Problem solving approach
A.S. Watson is already using Jira to manage their projects. Jira is the tool for Agile project management
and provides possibilities for using metrics. These metrics help to identify known and unknown
problems. Therefore, it is chosen, together with the company, to design a dashboard as a solution to
solve the core problem. This section explains what steps are taken to solve the problem.
1.3.1. Research methodology
To solve the core problem of having a limited level of data visualisation to identify known and unknown
problems, the Managerial Problem-Solving Method (MPSM) is used. The MPSM is a systematic
approach by Heerkens and Winden (2017) to solve business problems handled in their organisational
context. The method consists of seven phases, of which the first one “defining the problem” has
already been conducted in the second paragraph.
Phase 2, formulating the approach
A scheme is created and visualised in Figure 5 to show the approach of this research.
Figure 5: Problem solving approach
Phase 3, analysing the problem
After having an understanding of the process, an extensive analysis of the problem is conducted to
completely analyse the process and its problems.
Phase 4, formulating alternative solutions
Key in this research is to identify indicators to track productivity. However, alternative solutions will
be researched as well by doing literature research on suggestions from the literature on Agile.
Phase 5, choosing a solution
After doing research, the most suitable solutions will be chosen using the balanced scorecard method
to determine about the tool. Besides, the most suitable options are chosen based on the research
which will serve as input for data visualisation.
Phase 6, implementing the solution
Implementation of the solutions in the company takes place during this phase of the MPSM.
Phase 7, evaluation of solution
To determine whether the productivity level increased and to determine if the company is able to
respond better to the changing needs of their customers.
1.3.2. Research goal
The goal of this research is to get insight into the most suitable indicators for Agile organised
companies to identify known and more important, unknown problems. The goal is to increase
productivity by solving this problem, so the company can respond better to problems and changing
needs. When the company is aware of the problems, an adequate response is possible. After selecting
the most important indicators, this information can be visualised on a dashboard, so the company is
able to track the process by focusing on important indicators.
Page 14 of 921.3.3. Research questions
To solve the core problem of having a limited level of data visualisation to solve known and unknown
problems, the following research question is formulated.
“How to analyse and visualise data to improve the productivity level of an Agile organised company?”
The following set of sub-research questions is defined to answer the main research question.
1) How is the work process of the CRM Tribe organised?
a. What is the meaning of CRM within Group IT Europe of A.S. Watson?
b. What are the Agile principles on which the Tribe is operating?
c. How is the process of the A.S. Watson model organised?
First, insight into the environment in which research takes place is necessary to understand the
process. The problem analysis can only be conducted correctly if the context is properly understood.
It is important here to understand the main tasks of the CRM tribe, how Agile works and last the
different flows of the process. Research is conducted with the use of sources, available on the
Confluence page of the company. Besides, information is gathered by communicating with employees
and by observing the processes.
2) Where in the process are the bottlenecks?
a. Which bottlenecks are there?
b. What is the current productivity level?
c. How can these bottlenecks be explained by the actors involved?
Second, it is important to have a view on the current situation of the productivity level. Therefore, it is
important to identify the bottlenecks affecting it to make a problem analysis. By researching the
problems, it will become clear what factors are affecting the productivity level. This is an important
indication of where to focus on while designing the dashboard. Research is done by doing an
observation of the process to identify bottlenecks, communicating with employees about problems
and by process mining. This current situation will serve as the initial situation to measure the improved
situation.
3) What are the needs of the company for important indicators to track?
a. What are the norms for those needs?
Third, the preferences and goals of the employees play an important role while designing the
dashboard. This will indicate what is seen as important according to the employees. Research is done
by communicating with a few employees and with survey research, to include all opinions of all
employees. The information is used to measure the difference between the initial and the improved
situation.
Page 15 of 924) What optimisations on Agile software development teams to improve productivity are
suggested in research?
Fourth, a literature study is conducted to identify possible solutions suggested by research to improve
the productivity of an Agile organised company. The productivity level is not optimal at this moment.
By creating a clear visibility of the data to identify known and unknown problems, the expectation is
to solve the core problem. However, it could be that only a data visualisation is not enough to solve
the entire problem. Therefore this literature study is conducted. Based on the findings, a
recommendation is written to be provided to the company.
5) What indicators are suggested for agile software development companies?
Fifth, a second literature study is important to identify important indicators suggested by research for
the company. To control productivity, it is important to identify which indicators should be tracked to
be able to do so. Already a lot of research has been conducted on this topic, therefore it is chosen to
use the method of a literature study for this knowledge question.
6) What constitutes a dashboard to improve productivity of an Agile process and how to
implement this?
Sixth, literature research is conducted to understand how to design and how to implement a
dashboard in an Agile process. The company is pragmatic, so it is important to introduce the solutions
pragmatically. Implementing a dashboard in an Agile process is already a widely investigated question,
so therefore it is chosen to use literature. The results will be provided to the company.
In Figure 6, an overview of the research questions is provided. As described, both research question 1
and 2 contributes to the third phase of MPSM, analysing the problem. The goal of the other research
questions is to formulate solutions, phase 4 of MPSM. After doing research, a solution is chosen which
is phase 5 of the MPSM. In this phase, the design of the dashboard takes place. Implementing the
dashboard is part of phase 6 and evaluation is phase 7 of the MPSM.
Research question MPSM step Section
Research question 1 Phase 3 Section 2.1.
Research question 2 Phase 3 Section 2.2.
Research question 3 Phase 4 Section 2.3.
Research question 4 Phase 4 Section 3.1.
Research question 5 Phase 4 Section 3.2.
Research question 6 Phase 4 Section 3.3.
Page 16 of 921.4. Problem quantification
A problem is often described as a difference between norm and reality. The desired productivity level
is lower than desired, resulting in different problems. Some of the problems, the company is aware of,
others not. After a quick problem analysis, the underlying problem, the core problem, causing the
lower productivity level became clear: there is a limited of data visualisation. Currently, the company
is making decisions to react to those problems based on their gut feeling, instead of on data, visualising
the problems.
To determine whether the solution solved the core problem or not, it is necessary to set a norm on
what the company strives for. The company prefers to have the input for an overview visualising all
data affecting productivity. By keeping track of important indicators problems can be detected in an
early stage. Figure 7 represents the current situation and the desired situation.
Current situation | Reality Desired situation | Norm
Figure 7: Reality vs Norm
After implementing the solution, a comparison can be made between norm and reality to see whether
the core problem and thus the action problem, has been solved. Measuring the increase in productivity
is beyond the scope of this research, since the period after the dashboard is out of the research period.
To measure the comparison between norm and reality, two variables are assessed:
1) Available indicators
This variable expresses the number of indicators currently available to keep track of the
problems. By having clear what this number is, the current insight into the problems can be
measured. After implementing the solution, the available indicators are measured again to see
whether the solution improved the situation.
2) Insight into the problems affecting productivity
The second variable is the level of insight into the problems affecting productivity. This variable
assesses whether the awareness of the problems affecting productivity is improved. The
current insight into the problems has been determined in section 2.2.1.3. To measure norm
and reality, the improved insight into the problems affecting the productivity level is
determined after implementing the solution.
Page 17 of 922. Company analysis
In this chapter, research questions 1, 2 and 3 are answered in section 2.1, 2.2, 2.3, respectively. The
answers to these questions are used to select and design the right solution, to create the most suitable
dashboard for the CRM Tribe of A.S. Watson.
2.1. The current work process
To have a complete understanding of the work process, this section is divided into subsections to have
a complete overview of the whole process. First, an explanation is provided of what CRM actually is
and what their tasks and responsibilities are. Second, the principle of Agile is explained. This is
important since Agile plays a major role in the way the process is organised. A.S. Watson created their
Agile method, which is explained in subsection 3. In this section are all details of the process described.
Research question 1: how is the work process of the CRM Tribe organised?
2.1.1. CRM in Group IT of A.S. Watson
CRM is a combination of people, processes and technology that seeks to understand a company’s
customers. It is an integrated approach to managing relationships by focusing on customer retention
and relationship development (Chen & Popovich, 2003). Customer Relationship Management has a
key role in the software industry. While the software world is changing continuously, CRM applications
take full advantage of this. Their ability of collecting and analysing data is valuable to respond timely
and efficiently to everything related to online activities. Some examples of functionalities are being
able to manage marketing campaigns, manage sales and many more.
Within A.S. Watson, the CRM Tribe is responsible to manage the CRM software for their business units.
The tools used are Siebel, Adobe and OSB Middleware. The Oracle-powered Siebel CRM is a package
of CRM solutions that can easily be modified to the business requirements. It supports major aspects
such as marketing, sales, services etc. Adobe Campaign is a powerful campaign marketing solution with
a wide variety of options. Personalised deals can be offered to the customers by using this tool. OSB
Middleware is software functioning as a transition layer to enable different applications to work
together.
There are several processes to manage everything around the software tools the CRM Tribe is dealing
with. This varies from the customer, the store and the online environment to the offers and the
campaigns. To manage all these different aspects, seven processes are used and shortly explained:
1) Test management: this is simply the procedure around the testing process of the product.
2) User management: this process is about dealing with important aspects for the user. Examples
are GDPR, privacy issues and access to several systems.
3) Change management: this process involves managing changes to the systems, such as
improvements, new requests, or changes to codes.
4) Release management: the process of deploying changes in the software.
5) Incident management: incident management plays a role when there is a problem with a direct
impact on the functional processes.
6) Problem management: when a problem is arising with an indirect impact on the processes,
problem management plays a role. This has less priority than incident management.
7) Escalation management: when there is an escalation (often a problem with a high financial
impact), escalation management is needed.
Page 18 of 922.1.2. The Agile principles
Agile is an iterative approach, a methodology, to project management and software development that
helps teams deliver value to their customers faster (Atlassian, 2021). Different from regular project
management tools are the continuous, small launches instead of one big bang launch. Open
communication, collaboration, adaptation, and trust amongst team members are at the heart of Agile.
Although the project lead or product owner typically prioritises the work to be delivered, the team
takes the lead on deciding how the work will get done, self-organizing around granular tasks and
assignments (Atlassian, 2021). The origin of Agile goes back to 2001 when 17 developers met and wrote
the Agile Manifesto. Agile is based on twelve principles, included in Appendix A.
The main reason for companies to choose Agile is the ability to respond quickly to changes in the
marketplace or feedback from customers, without derailing a year’s worth of plans. "Just enough"
planning and shipping in small, frequent increments lets your team gather feedback on each change
and integrate it into future plans at minimal cost (Atlassian, 2021). According to the Agile Manifesto of
Beck et al. (2001), the main focus is on people. Authentic human interactions are more important than
rigid processes.
Since Agile is a methodology, many Agile frameworks have emerged over the last couple of years. The
most famous framework is Scrum, but Kanban, Lean, and Extreme Programming (XP) are also
frequently used frameworks. Each framework embodies the core principles of Agile, such as
continuous improvements and frequent iterations. Many Agile teams combine concepts of the
different frameworks today to create their own unique framework. This is also how A.S. Watson is
organised. The Agile method of the CRM Tribe of A.S. Watson is based on principles from Scrum, the
Spotify model, and the Nexus model. First, a clarification of those different methods is given to
understand the unique method of the company. Second, the Agile framework within A.S. Watson is
discussed.
Scrum
The first framework is Scrum, which is a framework that helps teams to work together. The framework
describes a set of roles, meetings, and tools to help structure and organise the team. In this subsection,
the main principles are explained. Within Scrum, there are three artifacts. An artifact is an object made
by humans, comparable with a tool to solve a problem. Those artifacts in Scrum are defined as a
product backlog, a sprint backlog, and an increment which contains the definition of done according
to the team.
The product backlog
The following description is the definition of the product backlog according to Drumond (2018).
A product backlog is the master list of work that needs to get done maintained by the product owner
or product manager. This is a dynamic list of features, requirements, enhancements, and fixes that acts
as the input for the sprint backlog. It is, essentially, the team’s “To Do” list. The product backlog is
constantly revisited, re-prioritised and maintained by the Product Owner because, as we learn more
or as the market changes, items may no longer be relevant, or problems may get solved in other ways.
The sprint backlog
According to (Drumond, 2018), the sprint backlog is the list of items, user stories, or bug fixes, selected
by the development team for implementation in the current sprint cycle. Before each sprint, in the
sprint planning meeting, the team chooses which items it will work on for the sprint from the product
backlog. A sprint backlog may be flexible and can evolve during a sprint.
Increment
The increment is the usable end-product from a sprint, often referred to as the team’s definition of
“Done”(Drumond, 2018).
Page 19 of 92You can also read