A Minimum Compensation Standard for Seattle TNC Drivers - James A. Parrott and Michael Reich
←
→
Page content transcription
If your browser does not render page correctly, please read the page content below
A Minimum Compensation Standard
      for Seattle TNC Drivers
      James A. Parrott and Michael Reich
         Report for the City of Seattle
                   July 2020
Center for New York City Affairs

The Center for New York City Affairs at The New School is dedicated to advancing innovative public
policies that strengthen neighborhoods, support families, and reduce urban poverty. Our tools
include: rigorous analysis; journalistic research; candid public dialogue with stakeholders; and
strategic planning with government officials, nonprofit practitioners, and community residents.

Dr. Parrott, Economic and Fiscal Policy Director of the Center for New York City Affairs at the New
School, has previously worked as chief economist for the City of New York, the State Comptroller’s
office, and the Fiscal Policy Institute. He has extensively studied and written about New York City
economic and labor market developments for over 25 years. He received his Ph.D. in economics
from the University of Massachusetts at Amherst.

Center on Wage and Employment Dynamics

CWED was established at the University of California, Berkeley in 2007 to provide a focus for re-
search and policy analysis on wage and employment dynamics in contemporary labor markets.

Dr. Reich, Professor of Economics and Chair of the Center on Wage and Employment Dynamics at
the University of California, Berkeley, has published 17 books and monographs and has authored
over 130 papers. His recent work has focused on the effects of federal, state and citywide minimum
wages. A product of New York City’s public schools, Reich obtained his Ph.D. in Economics from
Harvard University.

© Copyright 2020 The New School, Center for           Cover Photo: PsychaSec
New York City Affairs and Michael Reich               Cover Design: Ana Holschuh
Center for New York City Affairs
72 Fifth Avenue, 6th Floor
New York, NY 10011
212.229.5418
centernyc@newschool.edu
www.centernyc.org
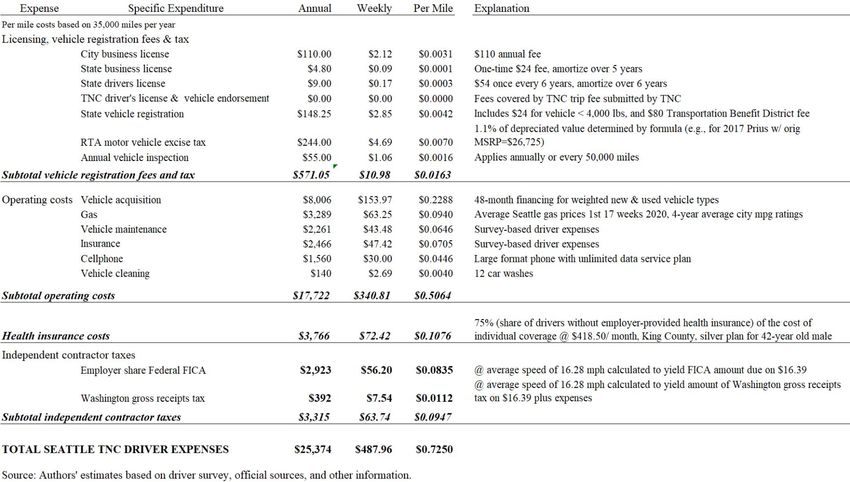
Abstract

We examine the pay and hours of drivers working for transportation network companies (TNCs)
in Seattle and propose a minimum driver compensation standard. Current gross driver hourly pay
is approximately $21.53. After expenses of $11.80, a driver nets $9.73 an hour, much less than
the minimum wage. A third of all of drivers work more than 32 hours per week and provide 55
percent of all trips. More than four-fifths of full-time drivers purchased their vehicle primarily or
partly to provide TNC services. Nearly three-fourths rely on TNC driving as their sole source of
income.
The proposed standard matches the independent contractor equivalent of Seattle’s $16.39 hourly
minimum wage for large employers. The standard also includes $1.17 per mile for drivers’
expenses of acquiring, maintaining, and operating vehicles used to transport passengers, for
health insurance for those who do not have any, and mandatory payroll taxes and license fees
required of independent contractors. Gross compensation, including expenses, would be $28.19
per hour.
The proposed compensation standard would increase hourly gross compensation by
approximately 30 percent and increase net hourly compensation by more than 60 percent. About
84 percent of Seattle drivers would receive increases. The compensation standard pays drivers
for their time and expenses during all of their working time, per the City’s enabling legislation.
The compensation standard will reduce racial inequality in Seattle, since TNC drivers make less
than most Seattle workers and black drivers constitute a much larger share of the TNC workforce
than of the Seattle workforce as a whole.
The costs of the compensation standard will be partly absorbed by reductions in the industry’s
high commissions, improvements in managing drivers and their vehicles (which now carry
passengers only about half the time they are on the street), and small fare increases.
Commissions could easily be reduced from their current 25-30 percent to 15 percent, the current
cap in Seattle for food delivery services. Policymakers may also want to consider an alternative
version of the pay standard, which adds provisions for rest breaks, paid sick leave, paid time off,
workers’ compensation, unemployment insurance, and retirement savings.
Acknowledgments

We are particularly grateful to Kerem Levitas, Policy Analyst in the City of Seattle Office of
Labor Standards, for his tireless work on this project, and to Kylie Rolf, Director of Major
Initiatives in the Office of Seattle Mayor Jenny Durkan, for her efforts throughout. We are also
appreciative of the assistance of several other current and former City of Seattle professionals,
including Kiersten Grove, Kelly Rula, Jeneé Jahn, Marty Garfinkel, Matt Eng, Ken Shapiro,
Richard Todd, Stephen Barham, Ahmed Abdi, and Kate Garman. We thank Nasha Virata and
Jason Rochford for research assistance, Bruce Cory for editorial assistance, Ana Holsuch for
designing the cover, and Seth Moncrease and Kristin Morse at the Center for New York City Affairs
for general support. We are also grateful to Meera Joshi, former New York City Taxi and Limousine
Commissioner, Dmitri Koustas, of the Harris School of Public Policy at the University of Chicago,
and Kate Gunby of PRR for their assistance. This report was prepared under a contract with the
City of Seattle Office of Labor Standards, with additional support from The New School and the
University of California, Berkeley. City of Seattle staff members have reviewed this document
for accuracy. The report itself is solely the product of the authors, who do not have any financial
interests in the TNC industry.
Table of Contents
Highlights and outline of this report ............................................................................................................ 1
The Covid-19 pandemic................................................................................................................................. 3
Section 1 Introduction and background ....................................................................................................... 4
   Purpose of this report ............................................................................................................................... 4
   Data and methods ..................................................................................................................................... 6
   Trends in TNC trip levels, drivers, and vehicles ....................................................................................... 7
   Geographic patterns within Seattle .......................................................................................................11
   The Seattle minimum wage and wage structure ...................................................................................14
   The evolution of Seattle’s regulatory environment for TNCs ...............................................................15
Section 2 The TNC industry’s business model ............................................................................................17
   The TNC industry in Seattle—a duopoly ................................................................................................17
   Drivers as independent contractors .......................................................................................................20
   The role of excess capacity .....................................................................................................................21
   Summary..................................................................................................................................................22
Section 3 Seattle TNC drivers......................................................................................................................23
   Results from the American Community Survey .....................................................................................23
   The 2020 Seattle TNC Driver Survey: sample and representativeness ................................................25
   Comparison of TNC driver demographics in the Seattle driver survey and the ACS ............................27
   TNC driver labor supply ..........................................................................................................................30
   Summary..................................................................................................................................................35
Section 4 Current TNC driver earnings .....................................................................................................36
   Uber-provided earnings data..................................................................................................................36
   Earnings data from the Seattle Driver Survey........................................................................................38
Section 5 TNC driver expenses ..................................................................................................................41
   Driver expenses by vehicle type and averaging on a per mile basis .....................................................41
   Licensing and vehicle registration fees and vehicle excise tax..............................................................42
   Vehicle operating expenses ....................................................................................................................43
   Health insurance and independent contractor taxes ............................................................................46
   Summary..................................................................................................................................................47
Section 6 Proposed TNC driver compensation standard ...........................................................................48
   Elements of the minimum compensation standard in the enabling legislation ..................................48
   Ensuring that drivers are paid for all of their working time ..................................................................51
Minimum compensation standard .........................................................................................................52
   Net and gross hourly earnings compared to the proposed standard ...................................................55
   Summary..................................................................................................................................................58
Section 7 The effect of the pay standard on TNC drivers, companies, and passengers ...........................59
   Effects on the drivers ..............................................................................................................................59
   Effects on the TNC companies ................................................................................................................61
   Effects on passengers ..............................................................................................................................65
   Summary..................................................................................................................................................65
Section 8 Summary and conclusions ..........................................................................................................66
   Afterword: Estimating the effects of Covid-19 and Covid-19-related economic shocks.....................68
References ...................................................................................................................................................69
Appendices ..................................................................................................................................................71
   Appendix 1 Seattle TNC Driver Survey Method ....................................................................................71
   Appendix 2 Seattle TNC Driver Expenses ..............................................................................................74
Highlights and outline of this report

1. This report examines the pay and conditions of drivers working for transportation network
   companies (TNCs) in Seattle and proposes a driver compensation standard.
      • This standard matches the independent contractor equivalent of Seattle’s $16.39
          hourly minimum wage for large employers.
      • The standard also includes $1.17 per mile for drivers’ expenses of acquiring,
          maintaining, and operating vehicles used to transport passengers, for health insurance
          for those who do not have any, and mandatory payroll taxes and license fees required
          of independent contractors.
      • Gross compensation, including expenses, would be $28.19 per hour.
      • Current gross driver hourly pay is approximately $21.53; after expenses of $11.80, a
          driver nets $9.73 an hour.
      • The proposed pay standard would increase hourly gross compensation by
          approximately 30 percent and increase net hourly pay by more than 60 percent.
      • Approximately 84 percent of Seattle drivers would receive pay increases.
      • Driver pay for a typical trip of 12 minutes and four miles would increase from $8.25
          to $11.40.

2. The compensation standard pays drivers for their time and expenses when they have
   passengers in their vehicles.
      • It applies a scaling factor to compensate drivers fairly for the entire time their apps
          are on, per the enabling legislation.
      • The City would reduce the scaling factor as the TNCs better manage the drivers and
          their vehicles. Driver pay would then increase further, with more rides per hour.

3. Our data come primarily from two sources.
      • An online survey completed by over 6,500 licensed TNC drivers; and summary data
         requested by the City from the TNCs. The online survey covered the week of
         December 2-8, 2019 and uses earnings and trip data accessed from drivers’ Uber and
         Lyft apps.
      • Uber partly responded to the City’s data request; Lyft declined. Uber provided useful
         summary data for 11 months through October of 2019.
      • Earnings and other results from the two data sets were similar for Uber drivers.

4. A third of all of the drivers surveyed drive more than 32 hours per week and provide 55
   percent of all trips.
       • Casual drivers working fewer than 20 hours a week provide only 19 percent of trips.
       • More than four-fifths of all drivers purchased their vehicle primarily or partly to
           provide TNC services.

                                                1
• Nearly three-fourths rely on TNC driving as their sole source of income.
• About half drive for both TNCs.
5. The costs of the compensation standard will be partly absorbed by reductions in the
industry’s very high commissions, improvements in the industry’s efficiency, and small fare
increases.
• TNCs use their market power to realize high commissions (25 to 30 percent) and to
keep driver pay low. Commissions could easily be reduced to 15 percent, the current
cap in Seattle for food delivery services.
• The industry is inefficient; the drivers’ vehicles carry passengers only 49 percent of
the time the drivers are on the street.
• The standard incentivizes TNCs to use their drivers more efficiently.
• The efficiency gains would be shared with the drivers, better aligning their interests
with those of the companies.
6. The compensation standard will reduce racial inequality in Seattle because
• TNC drivers are paid less after expenses than most Seattle workers, and
• Black drivers constitute a much larger share of the TNC workforce than of the Seattle
workforce as a whole.
7. The improved utilization of drivers’ time and their vehicles would reduce the number of
vehicles on Seattle’s streets, while still meeting passenger demand.
8. Policymakers may also want to consider an alternative version of the pay standard.
• This option adds provisions for rest breaks, paid sick leave, paid time off, workers’
compensation, unemployment insurance, and retirement savings.
9. The Covid-19 pandemic has sharply reduced demand for TNC services.
• During the upcoming slow economic recovery, more workers will seek to become
TNC drivers than will be required.
• This imbalance provides added justification for a minimum compensation standard.
Once the pandemic ebbs more fully, the need for a standard will still remain.
Section 1 describes the purpose of this report, summarizes Seattle’s citywide minimum wage
requirements, describes the growth and geographical evolution of the TNC industry in Seattle,
and reviews the evolution of the City’s regulatory environment for TNCs. Section 2 examines
the TNC industry business model, the nature of competition between the TNCs, and the tension
between the TNCs and the drivers created by the industry’s business model. Section 3 analyzes
the driver workforce, demographics, and labor supply behavior, drawing from an extensive on-
line survey of Seattle TNC drivers. Section 4 itemizes the vehicle and related operating and
licensing expenses borne by Seattle drivers and develops an estimate of average expenses per
2mile for TNC vehicles. Section 5 draws from two data sets—our online survey and data provided
by Uber—to examine the level of driver earnings.
Section 6 details two versions of a driver minimum compensation standard, explains the basis
and cost for each component, discusses the structure of the proposed minimum compensation
formula, and indicates how it could incentivize the TNCs to make more efficient use of drivers’
time and vehicles. It also analyzes how much earnings would have to increase to meet these
proposed minimum compensation standards. Section 7 analyzes the likely impacts of the
proposed compensation standard on drivers, the TNCs, and passengers. Section 8 provides a
summary and conclusions and discusses how Covid-19 has affected the industry.
The Covid-19 pandemic
The City of Seattle’s legislation authorizing this report was enacted in November 2019; the City
commissioned this report shortly thereafter, with an expected completion date of March 31,
2020. While the sudden emergence of the Covid-19 pandemic in early 2020 has disrupted the
economic context in still-evolving ways, and delayed the production of this report, it has not
altered the rationale for the driver compensation standard or our analysis.
As a result of the pandemic and its economic disruptions, consumer demand for TNC service
plummeted and is likely not to recover for some time. But after the crisis moderates, the nature
of TNC service and the dynamics between the companies and the drivers are likely to remain
similar to what they were before. The argument for a minimum compensation standard, along the
lines of the recommendation presented in this report, will remain. The standard is needed to
ensure that drivers will be fairly compensated as well as to encourage the TNCs to better manage
the supply of drivers and match the available and potential consumer demand. In the short run,
the recovering course of consumer demand may mean that fewer drivers will be required than
would seek to drive. This imbalance will provide an additional reason for a minimum
compensation standard.
3Section 1 Introduction and background
This section describes the purpose of this report, the methods, and data we use to study Seattle’s
Transportation Network Company (TNC) industry and establishes the context for a minimum
compensation standard. The context includes Seattle’s minimum wages and wage structure, the
growth and evolution of Seattle’s TNC industry, and the evolution of Seattle’s regulatory
environment for TNCs
Purpose of this report
The City of Seattle solicited this report to inform the development of a minimum compensation
standard for TNC drivers. For-hire vehicle trips dispatched through the use of a mobile phone
app first appeared in Seattle in 2011, growing gradually at first to an estimated 2,000 drivers in
March of 2014, then surging to more than 30,000 drivers within four years.1 App-dispatch for-
hire vehicle drivers, referred to as TNC drivers in this report, are treated by the two largest TNCs
(Uber and Lyft) as independent contractors, not employees. Based on this independent contractor
status, the TNCs assert that drivers are not covered by local, state, or federal minimum wage or
overtime laws, do not have the protection of most other labor standards, and are not covered by
social insurance programs, such as workers’ compensation or unemployment insurance. 2
We previously conducted a study of TNCs in New York City (Parrott and Reich 2018). Our
study showed that New York City drivers, absent a required minimum compensation standard,
earn less than the independent contractor equivalent of the applicable minimum wage and that
they are inadequately compensated for the expenses they incur to provide TNC passenger
services.3
Seattle drivers have long reported that they are paid less than the Seattle minimum wage. 4
Previously, however, systematic data has not been available to analyze the overall TNC driver
workforce and driver compensation, either gross or net of their expenses.5
Uber and Lyft, the major TNCs operating in Seattle, maintain that most of their drivers enter the
field because the flexibility provided gives them an opportunity to work for a few hours each
1John Cook, “Confession of an Uber driver: An inside look at Seattle’s new private driver service,” Geekwire,
August 12, 2011; Reid Wilson, “Seattle becomes first city to cap Uber, Lyft vehicles,” The Washington Post, March
18, 2014.
2 For the first time, the March 2020 federal Coronavirus Aid, Relief and Economic Security Act (CARES) provided
federally-funded unemployment benefits to independent contractors.
3 James A. Parrott and Michael Reich, “An Earnings Standard for New York City’s App-based Drivers: Economic
Analysis and Policy Assessment,” Report for the New York City Taxi and Limousine Commission, July 2018.
4 See, e.g., Kara Kostanich, “Seattle rideshare drivers protest low wages,” KOMO News, May 9, 2019.
5One of the major TNCs has made extensive data on TNC services available to selected academic researchers. But
both major companies have balked at providing data to government entities that would facilitate an informed
assessment of driver earnings. For this study, in response to a request by the City of Seattle, Uber provided summary
driver earnings data. Lyft declined to provide data in response to a similar request.
4week to supplement earnings from another job or while attending school or caring for family
members.6 Nonetheless, as we show in this report, driving provides the principal job and source
of income for a large proportion of Seattle TNC drivers. And more than half of Seattle TNC
drivers work for both Uber and Lyft.
As directed by the City of Seattle, this report presents an economic analysis “to determine a
minimum compensation standard for TNC drivers that is comprised of at least the equivalent of
the ‘hourly minimum wage’ [for large employers]… plus reasonable expenses.” 7 For purposes of
this ordinance, TNCs are treated as if they were large companies for whom the applicable hourly
minimum wage for 2020 is $16.39.8 “Reasonable expenses” are specified as expenses incurred
by TNC drivers to provide TNC services, including (but not limited to) such items as
depreciation, lease payments, maintenance and repairs, tires, gasoline, oil, insurance, and license
and vehicle registration fees. 9
The enabling legislation specifies that a number of factors should be considered for incorporation
into the compensation standard. These include: employer-side federal payroll taxes covering
Social Security and Medicare that independent contractors must pay; workers’ compensation and
unemployment insurance premiums that are required of all employers; compensation for paid-
sick and safe time and rest breaks that are required for employees in Seattle; health insurance;
and other mandatory and discretionary costs that TNC drivers currently bear.
With regard to the measurement of driver working time, the ordinance defines “TNC services” to
mean “services related to the transportation of passengers that are provided” by a TNC driver
while logged in to the driver platform, including services provided while waiting for a trip
request (“available platform time”), driving to a passenger location (“dispatch platform time”),
and transporting a passenger (“passenger platform time”). In the parlance of the TNC industry,
these three segments of time logged onto the platform are called, respectively, P1, P2 and P3.10
We follow this terminology here.
The enabling ordinance also calls for this report to evaluate “the impacts of any proposed
minimum compensation standard on TNCs, TNC passengers, and TNC drivers, including TNC
driver earnings and work hours.”11
6 For example, in May 2019, Lyft stated, “Lyft drivers’ hourly earnings have increased over the last two years, and
they have earned more than $10B [nationwide] on the Lyft platform. Over 75 percent drive less than 10 hours a
week to supplement their existing jobs.” Lauren Feiner, “Uber drivers will go on strike over pay and benefits ahead
of the company’s $90 billion IPO,” CNBC News, May 7, 2019.
7 Section 14.31.060, City of Seattle, Municipal Code, Chapter 14.31, “Transportation Network Company Driver
Minimum Compensation Ordinance,” Ordinance 125977 adopted November 25, 2019.
8 The Seattle minimum wage for large employers with more than 500 employees is adjusted each January 1 to reflect
the change in the rate of inflation based on the Seattle-Tacoma-Bellevue Area Consumer Price Index for Urban
Wage Earners and Clerical Workers (CPI-W.)
9 Paragraph 10, section 14.31.060.
10 Section 14.31.020.
11 Section 14.31.060, City of Seattle, Municipal Code, Chapter 14.31.
5The scope of our charge is limited. This report does not assess the condition of the taxi and flat-
rate for-hire car service industry in Seattle, the effects on public transit, or traffic congestion and
environmental issues. Compliance monitoring and enforcement measures are important parts of
the policy, but beyond the scope of this report.
Data and methods
Exhibit 1 identifies the main data sets we consulted in preparing this report. These include King
County driver, trip and vehicle data, demographic data from the American Community Survey,
our own online survey of Seattle TNC drivers, and limited data provided by Uber.
The City sought comprehensive driver earnings information from both TNC companies. Uber
did provide weekly summary earnings data, but Lyft did not provide any driver earnings, trip, or
working hours data. Moreover, neither company provided data on earnings at driver and trip
levels, nor data on all working hours. As a result, we rely primarily upon the survey we
conducted of Seattle TNC drivers. The survey provided us with earnings, hours, and trip data, as
reported by the drivers themselves and separately on the drivers’ TNC apps, for the first week of
December 2019. We also use summary data for earnings provided by Uber. The data sources will
be described further in the sections that follow.
Exhibit 1 Data consulted in this report
6In contrast, our report for the New York City Taxi and Limousine Commission (TLC) benefited
from having comprehensive company-provided driver earnings and trip information. These data
were available through the TLC’s data-sharing arrangement with Lyft, Uber, Via, and Juno. To
effectively implement a minimum driver compensation standard in Seattle, the City will require
more extensive TNC information on an ongoing basis.
Trends in TNC trip levels, drivers, and vehicles
We discuss first trends in the number of TNC trips in Seattle and trends in the number of drivers
and vehicles. We then examine changes in recent years in the geographic location of TNC trips.
Exhibit 2 shows trends in the annual number of TNC trips in Seattle and in King County from
2015 to 2019. We show trends for both areas because King County licenses TNC drivers and
vehicles that operate in the City of Seattle, and because almost all Seattle drivers also provide
trips in King County areas outside of Seattle. One important location, the Seattle-Tacoma
Airport, is located in King County, but outside of Seattle.
As Exhibit 2 indicates, trips that originated in Seattle accounted for 72 percent of the combined
city-county TNC trips in 2019. For comparison, the city comprises about one-third of the
7population of King County. The average quarterly number of TNC trips in Seattle rose more than
four-fold from 2015 to 2019, from 1.6 million trips in 2015 to 6.6 million trips in 2019. For the
Exhibit 2 TNC trips (quarterly) City of Seattle and King County
Source: King County Records and Licensing Services Division.
entire year of 2019, Seattle TNC trips numbered 26.5 million, or an average of over 500,000
each week. Non-Seattle originating King County TNC trips rose even faster than those
originating in Seattle, from a quarterly average of about 0.25 million trips in 2015 to 2.5 million
trips in 2019.
We turn next to trends in the number of TNC drivers and vehicles. As Exhibit 3 shows, the
number of TNC drivers licensed by King County, almost all of whom provide services in Seattle,
rose from a mere 13 in 2015 to 33,000 in 2019, with particularly rapid growth between 2014 and
2017. The number of vehicles licensed by King County similarly rose sharply before declining
by about 1,600 between 2018 and 2019.The number of TNC drivers and vehicles were similar in
2019.12
In 2018, King County changed the method used to count vehicles from license plate number to VIN number. This
12
methodology change contributed to a slight decline in the number of vehicles in 2019.
8Exhibit 3 TNC drivers and vehicles, King County 2014-2019
Source: King County Records and Licensing Services Division.
The number of TNC vehicles in Seattle and King County is far greater than the number of
traditional taxis.13 In 2019, the number of TNC vehicles was more than 40 times the number of
taxis. The number of taxis grew slightly between 2014 and 2018. But then the number of taxis
fell by nearly a quarter in 2019, from 1,108 to 841. The City and the County also license flat-rate
vehicles providing a service similar to taxis but with a fixed flat fare based on origin and
destination. The number of these vehicles was also constant, at about 470, from 2014 through
2017. It then fell to 211 by 2019.
The main TNC companies in the U.S., Uber and Lyft, also dominate Seattle private urban
transportation. The two companies together accounted for 99.9 percent of all TNC rides
originating in Seattle, until Via arrived on the scene in 2019. Via’s 155,300 trips that year
accounted for six-tenths of one percent of the citywide TNC trip volume.
Exhibit 4 shows that Uber’s early near-monopoly on TNC trips has given way to a duopoly with
two trip-providers, Uber and Lyft. In the early TNC years (2015-16), Uber drivers provided 80
percent of all trips, with Lyft at 20 percent. In 2018 and 2019, Uber’s share of trips was 60
percent, with Lyft at 39 percent. 14 These market shares are very close to each company’s market
shares in the entire urban U.S.
13Data on taxis in this paragraph are from King County, Records and Licensing Services Division.
14In the fourth quarter of 2019, the latest quarter of data as this report is being written, Uber’s share rose slightly to
62 percent, Lyft’s share eased to 37 percent and Via’s share first crossed the 1 percent threshold. King County,
Records and Licensing Services Division.
9Exhibit 4 Uber and Lyft trip volume, quarterly, Seattle and King County
Source: King County Records and Licensing Services Division
Comprehensive data on TNC trip volume among U.S. cities is not publicly available. However,
Seattle likely ranks among the ten largest TNC markets. (Seattle is the 18th largest city in the
U.S. by population, and the Seattle metropolitan area is the 15th largest metro area.)
Transportation expert Bruce Schaller has estimated that nine large and densely-populated
metropolitan areas accounted for 70 percent of 2.6 billion TNC trips nationally in 2017. Among
selected cities, Schaller’s 2017 data showed only four cities (New York City, San Francisco,
Washington, DC, and Boston) with more TNC trips than Seattle. 15 A 2019 study by
transportation consultants Fehr & Peers conducted for Lyft and Uber reported that TNCs in only
five metro regions (Los Angeles, San Francisco, Chicago, Washington, DC, and Boston)
registered more vehicle miles traveled than the Seattle area in September 2018. 16
15 Schaller Consulting, “The New Automobility: Lyft, Uber and the Future of American Cities,” Brooklyn, NY, July
25, 2018, pp. 7-9.
16 Melissa Balding, Teresa Whinery, Eleanor Leshner, and Eric Womeddorff, Estimated TNC Share of VMT in Six
U.S. Metropolitan Regions, Fehr & Peers, August 6, 2019, and “Clarifications,” October 2, 2019. The Fehr & Peers
study did not include New York City.
10As Exhibit 5 shows, the number of Seattle TNC trips rose by 101 percent in 2016 and continued
to grow rapidly, albeit at more moderate growth rates in 2017 (49 percent) and 2018 (28
percent). The annual number of TNC trips reached 26.5 million in 2019, only nine percent
greater than in 2018.
Exhibit 5 Annual TNC trip growth, Seattle and New York City, 2016 to 2019
Source: King County Records and Licensing Services Division; New York City Taxi and Limousine Commission.
Trip growth in other large cities also moderated from the triple-digit growth rates of earlier years.
Exhibit 5 compares trip volume growth for New York City, the nation’s largest market, with that
of Seattle. TNC trip volume grew 11 percent in 2019 in New York City, despite a number of
policy regulations implemented in 2018 and 2019. New York City imposed a “freeze” on new
TNC vehicle registrations in mid-August 2018, implemented a minimum TNC driver pay
standard in early February 2019, and at the same time introduced a $2.75 per trip congestion
surcharge for trips beginning or ending within the core central business district of Manhattan. 17
Nonetheless, trip volume growth in the two cities was quite similar in 2019.
Geographic patterns within Seattle
Similar to trip patterns observed in other large cities, TNC trips in the Seattle area grew first in
the Downtown business district, in the South Lake Union tech business hub, and in nearby areas.
Most trips initially took place within the core business areas or involved commuting trips
between high-income residential areas and downtown and South Lake Union office buildings.
While most trips are still concentrated in these core areas, in recent years trips have expanded
more in more moderate-income neighborhoods and outlying areas.
17Because there was a rush to license additional vehicles prior to the effective date of the August 2018 vehicle cap
in New York City, the number of TNC vehicles on city streets and trip volume continued to grow for several
months. The congestion charge was imposed by the State of New York to raise funds for mass transit.
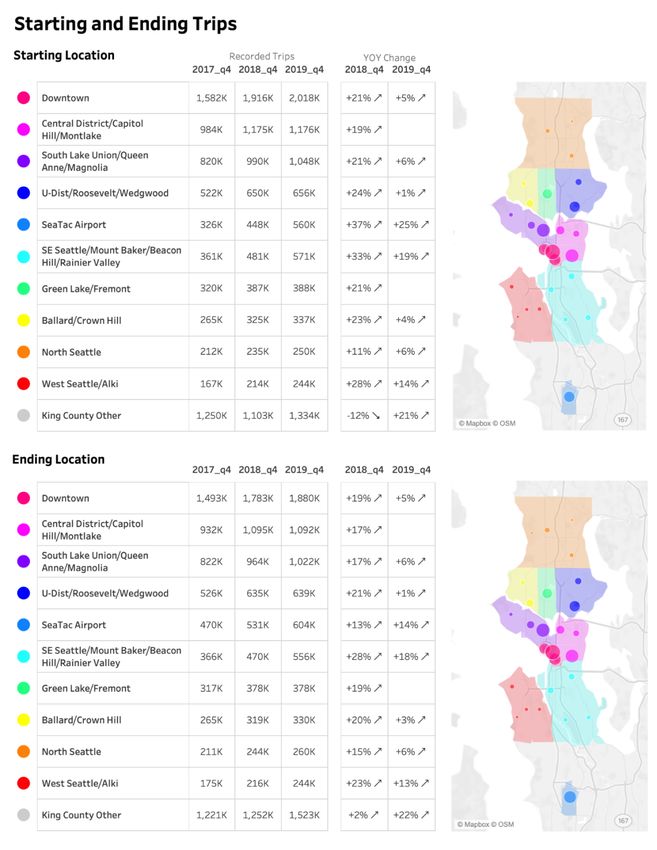
11The table and map shown in Exhibit 6 provide the starting and ending locations for TNC trips for
the fourth quarter of each of 2017, 2018, and 2019. The last two columns of the table also
display percent changes over the prior year. Besides continued growth in trips to and from
Seattle-Tacoma Airport (SeaTac), 2018 and 2019 trip volumes grew the most in neighborhoods
in Southeast Seattle and West Seattle, and elsewhere in King County outside of Seattle. Overall,
comparing the fourth quarter of 2019 with the fourth quarter of 2018, trip volume rose 4.7
percent in Seattle and16.4 percent elsewhere in King County. However, total Seattle trip volume
was still two-and-a-half times that of the rest of the county in the fourth quarter of 2019.
Exhibit 7 presents the trip data for five common route patterns (based on an analysis by the
Seattle Department of Transportation). Downtown trips shown in the first row include trips
within Downtown (about 550,000 in the fourth quarter of 2019) but exclude trips to or from the
airport—those trips are included in the airport row. Trips in the two business districts, the
University District, and the higher-income neighborhoods surrounding Lake Union accounted for
roughly three-fourths of all trips in the last quarter of 2019. Note that the passengers on these
routes generally have a relatively high ability and willingness to pay higher fares.
In the fourth quarter of 2019, approximately 300,000 trips were between Downtown Seattle (or
immediate vicinity) and SeaTac and about 780,000 trips were between anywhere in Seattle and
the airport.18 Airport trips accounted for 8.8 percent of all trips in Seattle and King County in the
last quarter of 2019, up from 7.4 percent in the last quarter of 2017.
18The 300,000 number of trips between Downtown and the Seattle-Tacoma Airport were provided by the City of
Seattle and is not separately shown in either Exhibits 6 or 7. The trip data are identified by zip code of the origin and
destination; some of the trips classified here (in the text or Exhibits 6 and 7) as “airport” trips might be for locations
within the same zip codes as the Seattle-Tacoma airport.
12Exhibit 6 TNC trips, Seattle and King County
Source: City of Seattle.
13Exhibit 7 Common TNC trip routes, Seattle and King County
Note: The first row includes trips wholly within Downtown, and those intra-Downtown trips are not included in the
third row, “Seattle within Same Area.” Trips between Downtown and the airport are included in the fifth row, and
not in the first row. “Seattle within Same Area” refers the nine Seattle areas shown in Exhibit 6. The sixth row,
“Other,” includes all other King County trips not included in any of the above rows.
Source: City of Seattle.
This pattern of a large and growing number of airport trips is important because Seattle’s
regulatory reach does not extend to trips that originate outside Seattle. Thus, a minimum pay
standard could result in drivers being paid more on trips from Seattle to SeaTac than the reverse,
assuming King County takes no similar action. The trip data that was supplied to the City by
Uber, which we discuss in Section 6 below, does not include trips that originated at SeaTac, nor
does it account for the often large TNC driver wait times at SeaTac.
The Seattle minimum wage and wage structure
Building on its leadership role among cities in establishing a higher minimum wage floor, the
City of Seattle seeks to establish a minimum compensation standard for TNC drivers that is the
independent contractors’ equivalent of the hourly minimum wage for all Seattle, after taxes and
expenses that independent contractors incur. As Exhibit 8 indicates, Seattle has the highest
hourly minimum wage of any large city in the U. S. The city’s $16.39 hourly minimum applies
to Schedule 1 entities—employers with more than 500 employees. In this report we treat Lyft
and Uber as Schedule 1 entities based on their worldwide employee count, their worldwide
driver count, or a combination thereof.
14New York City, the only U.S. city with a minimum compensation standard for TNC drivers,
currently has a $15.00 an hour minimum wage for all employees. As of February 1, 2020, the
New York City minimum driver pay standard is $17.47 an hour (up from the 1 st year level of
$17.22). The New York City pay standard also adds reimbursement for business expenses and
includes provisions for paid leave and the employer share of Social Security and Medicare taxes
that independent contractors are required to pay. The New York City driver pay standard is
indexed annually for changes in the New York City metro area’s Consumer Price Index. (The
New York State minimum wage applicable in New York City is not indexed.)
Exhibit 8 2020 Minimum wage levels, selected large cities
Source: Official City websites.
Seattle leads other cities not only in its minimum wage, but also in recent pay increases
throughout the wage distribution, as Zipperer (2018) points out. 19 Nevertheless, wage inequality
is much greater than in most large U.S. cities.
The evolution of Seattle’s regulatory environment for TNCs
Washington State law grants municipalities the authority to regulate TNCs.20 In March of 2014,
the Seattle City Council passed an ordinance creating a cap of 150 drivers per TNC. Uber
opposed these efforts and sought a referendum on the ordinance. Ultimately, Uber and Lyft
participated in a joint mediation and negotiation with the City and existing taxi and flat rate
vehicle representatives to reach an agreed-upon regulatory framework to be adopted in the City
19 https://www.epi.org/blog/six-reasons-not-to-put-too-much-weight-on-the-new-study-of-seattles-minimum-wage/
20 RCW 46.72.001.
15Code. The City Council then passed Ordinance 124524, which implemented the terms agreed
upon in the mediation.21
Following the mediation, King County passed an ordinance implementing similar terms and an
inter-local agreement between Seattle and King County governs driver and vehicle licensing
regulations and data sharing. Under this regulatory framework, the County regulates drivers
while the City regulates vehicles. The companies are required to submit, on a quarterly basis,
data on each trip, listing the origin and destination by zip code, and information on collisions,
crimes against drivers, and consumer complaints. Beginning in July 2020, the City will levy
three fees totaling 75 cents on each TNC trip originating within the Seattle city limits: one to
cover the cost of regulating the industry; one to fund wheelchair-accessible taxis; and a “Fare
Share” component to fund affordable housing construction, mass transit improvements and
driver protections.22
In December 2015, the City Council passed an ordinance that established collective bargaining
for TNC drivers on the terms and conditions of their work with TNCs. Uber and Lyft challenged
the ordinance in Federal Court. In April 2020, the parties settled the lawsuit and the collective
negotiations ordinance never became effective. 23
In April 2018, the City Council passed a resolution calling on the TNCs to voluntarily share data
by May 31, 2018 on driver working time; trip volumes; distances traveled in P1, P2, and P3; fare
information; and driver earnings.24 In January of 2020, Uber provided a limited version of such a
data request for use in connection with our study. Lyft has yet to share any driver earnings and
related data with the City of Seattle.
In contrast to the case in Seattle, since 2018 the TNCs have regularly provided extensive data on
driver earnings and trips to the New York City Taxi and Limousine Commission. While several
large cities in the U.S. and around the world require TNCs to provide trip data, relatively few
currently require companies to provide data on driver earnings. 25
21 See Seattle Rules for Transportation Network Companies, https://www.seattle.gov/business-regulations/taxis-for-
hires-and-tncs/transportation-network-companies. A cap on the number of drivers was not part of the negotiated
agreement.
22 Monica Nickelsburg, “Seattle raises fees for Uber and Lyft rides with new tax, passes minimum wage for drivers,”
Geekwire, November 25, 2019.
23 City of Seattle, “City, U. S. Chamber of Commerce, Raiser LLC Agree to Dismiss Collective Negotiations
Lawsuit,” Press Release, April 10, 2020.
24 Sarah Anne Lloyd, “Seattle City Council votes to take a closer look at ride-hailing services,” Curbed Seattle, April
9, 2018.
25 In addition to New York City, Mexico City requires TNCs to provide driver earnings data. Meera Joshi, Nicholas
Cowan, Olivia Limone, Kelly McGuinness, and Rohan Rao, “E-Hail Regulation in Global Cities,” Rudin Center for
Transportation, New York University, November 2019.
16Section 2 The TNC industry’s business model
This section examines the network-based business model of the Seattle TNCs and identifies
two problematic features that the proposed minimum compensation standard would address.
These features are an oligopolistic market structure, in which drivers are independent
contractors supplying their own vehicles; and a competitive dynamic that encourages excess
capacity and under-utilization of drivers’ time and capital investments and keeps their pay low.
The TNC industry in Seattle—a duopoly
The app-dispatch for-hire vehicle industry in Seattle consists almost entirely of two TNCs—Uber
and Lyft. Both companies use broad-based smartphone technology and matching algorithms to
connect networks of passengers with networks of drivers. The TNCs have developed a network-
based urban transportation system whose ease of use and coverage exceeds that of traditional
taxis. Convenience results from the creation of dense local networks connecting riders and
drivers directly, upfront fixed pricing, an easy payment system and quick response times.
Supported by considerable venture capital, TNCs aggressively used incentives to attract drivers
and passengers. Once a dense network capacity was established, TNC services expanded rapidly.
The TNCs have made significant upfront investments in the technology platform for the app and
in the engineers and programmers who maintain it. But once a critical network density was
achieved, the marginal cost of expanding service declined sharply. The low cost of further
expansion is greatly facilitated by relying on drivers who are treated as independent contractors.
The drivers supply their own vehicles and who finance their operation. Each TNC can increase
its profit margins by spreading their fixed costs over more revenue-generating trips. This
dynamic as well as the profit-disrupting effects of price cuts provide strong incentives to
compete on the basis of market share rather than on price.
While Uber developed an early lead in many large cities in the U.S., Lyft has followed closely
behind. Benefiting from its own ample supply of venture capital, Lyft has succeeded in securing
a significant market share in most cities. In Seattle, Lyft doubled its TNC market share from
2015 to 2017 and now has a 39 percent share, comparable to its nationwide share.
Uber and Lyft together completely dominate Seattle’s TNC market, with a combined 99 percent
market share for app-dispatched trips. The two companies also dominate the Seattle area’s taxi
and for-hire vehicle industry; in 2019, there were only 841 licensed taxicabs and 211 non-app
for-hire vehicles in Seattle and King County, compared to well over 30,000 licensed TNC
vehicles.26
26 King County Records and Licensing Services Division.
17The nature of competition in a duopoly—an industry characterized by two dominant firms—has
long been studied in economics. The standard duopoly model was first developed in the
nineteenth century by the French mathematician Antoine Cournot. Two firms produce the same
product and have similar cost structures. Each must take account of how the other will react to a
change in its own pricing and market share behavior.27
As in economics textbooks, while both firms possess significant market power, they also
compete with each other for drivers and passengers. Companies in a competitive industry—one
with many sellers— do not possess pricing power. They face an industry-wide given price for
their services. In contrast, a company in a duopoly has price-setting power, but it must also take
into account the effects of its price and output strategies on the behavior of its competitor.
As a result of this interactive process, companies in a duopoly generally match each other’s
prices, in order to avoid a price war that would be ruinous for both. American economist Paul
Sweezy noted in 1939 that duopolists prefer a strategy of “live and let live” to one of cutthroat
competition.28 They compete instead over market shares. However, their market power gives
them significant latitude to set prices at a higher level than would obtain in a more competitive
industry—although at the cost of reducing overall demand. It also gives the two TNCs the ability
to exercise significant influence over drivers and their compensation.
Their market power allows the TNCs to charge drivers high commissions and to obtain high
mark-ups over costs, compare to the case for a competitive industry.29 Duopolists also retain
considerable market power over their workers. As we explain further below, economics textbook
analyses indicate that duopolists will keep wages lower than the amount that would obtain in a
competitive labor market.
To summarize to this point, coexisting duopolists are able to reap substantial profits and to keep
pay low. Both Uber and Lyft have consistently reported large quarterly losses overall. However,
many of these losses do not stem from urban ride-sharing, but from investments in other lines of
business—from scooters, restaurant delivery, and autonomous vehicles—and from losses in
some geographical areas and expansion into others. Uber's most recent quarterly financial report
breaks out its returns on ride-sharing operations: this line of business generated positive earnings.
The core urban ride-sharing business in the U.S. has long generated positive earnings for the
companies.
TNCs set and collect passenger fares through their apps and deduct a commission before paying
27 See, e.g., https://policonomics.com/cournot-duopoly-model/
28 Paul Sweezy, “Demand Conditions under Conditions of Oligopoly,” Journal of Political Economy, 1939.
29 Robert Hall, “New Evidence on the Markup of Prices over Marginal costs and the Role of Mega-Firms in the U.S.
Economy, NBER WP 24574, 2018.
18their drivers. In the early years, commission rates were relatively fixed, often in the 20-25
percent range. In recent years, drivers have increasingly complained that commissions have
tended to rise and vary arbitrarily. Although rigorous data are not available, it seems likely that
the drivers’ share of passenger fares has declined.30
Evidence for rising commissions also comes from investment analysts. Internet-based market
intermediaries refer to their commissions relative to the total value of transactions as the “take
rate.” Investment analysts have noted the steadily rising take rates for Lyft and Uber. For
example, Deutsche Bank analysts estimated that Lyft’s net take rates were 18.0 percent in 2016,
23.1 percent in 2017, 26.8 percent in 2018, and 30.4 percent in 2019. Before the pandemic
began, they projected that take rates could rise to 32 percent or more in 2020. 31
The Deutsche Bank analysts noted that after the two companies completed their initial public
offerings (IPOs) in March and April of 2019, they raised passenger fares. The analysts
characterized this action as: “raising prices—a by-product of rational competition”; that is,
among duopolists.32
As Stanford economist Robert Hall (2018) has emphasized, large mark-ups of price over
marginal costs indicate market power. While commissions are figured relative to total revenues,
mark-ups are net profits relative to operating costs.
We do not have Seattle-specific data on TNC commissions, locally generated revenues, or local
operating costs. 33 However, in our 2018 New York City report we were able to estimate that
Uber’s local profits were six times that of its local operating costs, i.e., that it enjoyed a 600
percent mark-up.34 The TNCs are able to generate such sizable mark-ups, in part, because
drivers are bearing a significant portion of the business’ operating costs.
If the two firms in a duopoly simultaneously face the same upward cost increase, such as the
imposition of a pay floor for their workers, they are both likely to pass on much of the cost
increase in the form of a price increase. The amount of the pass-through depends, in part, on the
elasticity of demand for that good or service. Elasticity of demand refers to the sensitivity of
30 “Drivers highlighted data collected from dozens of Seattle rideshare drivers that was compiled by the Teamsters
Local Union 117. The report shows drivers are now paid an average of 69 percent of what riders pay. That’s
compared to the 80 percent that drivers when Uber and Lyft first came to Seattle.” Kara Kostanich, “Seattle
rideshare drivers protest low wages,” KOMO, May 9, 2019.
31 Deutsche Bank Research, “Looking for a Lyft—Initiate with Buy rating,” September 5, 2019, pp. 3-4, 31. Uber’s
core rideshare gross-take rate for 2018 was reported at 26.2 percent, lower than Lyft’s gross take rate of 32.8 percent
for that year mainly because Uber includes taxes, fees and tolls in its measure.
32 Ibid, p. 4.
33 For this study, the City of Seattle had requested that Uber and Lyft provide data on passenger fares and
commissions, but neither company supplied that information.
34 Parrott and Reich (2018).
19demand to price changes. When demand is relatively inelastic, it will not fall as much as a price
increases. Under these conditions, each firm maximizes its profits by absorbing some of the cost
increase in lower mark-ups. Moreover, in a duopolistic industry the firms have more room to cut
commissions rather than absorb the consequences of a price increase. We come back to this issue
in Section 7, where we discuss how TNCs might respond to a driver pay increase.
Drivers as independent contractors
The TNCs consider drivers to be independent contractors rather than employees. The companies
set the fares and the number of new drivers credentialed to drive using their apps. Until
recently, the drivers set their own schedules and total number of work hours. The companies
rely on algorithms in the app to manage the labor time of drivers who supply their own vehicles
and who also pay for all driving-related expenses.35 In March 2020, Lyft started urging its
Seattle drivers to schedule their time on the app in advance.36
As we already noted, driver payment is not always a fixed proportion of the passenger fare. The
proportion depends on a number of company policies, such as promotions for drivers and riders,
rush-hour pricing, and route-based pricing. Driver hourly pay will also vary considerably with
how much of each hour the drivers transport passengers. Trip demand varies by time of day—
with peaks during morning and evening rush hours, in the evenings, and on weekends.
In a TNC duopoly, the reliance on drivers as independent contractors is inherently exploitative,
in the sense that driver pay for the same work will be lower than if drivers were employees and
many firms were competing for drivers. Many drivers have made upfront investments in their
vehicles that lock them into the industry, so they cannot easily move to higher-wage jobs
elsewhere. And many drivers are new immigrants, who would have difficulty entering other
jobs. Moreover, independent contractors are not covered by the minimum wage and other labor
standards protections, and do not receive the benefits mandated or provided voluntarily to
employees. Thus, Morgan Stanley analysts estimated that classifying California TNC drivers as
employees rather than independent contractors would mean the companies would need to
increase labor compensation by 37 percent over current levels. 37
The TNC business model is unusual in that the drivers are responsible for a major capital
asset—the vehicles. While the TNCs enjoy economies of market scale, benefiting from low
marginal costs for expanding services, drivers experience no economies of scale as the industry
expands that otherwise might exist if there were employer-owned fleets of vehicles, fleet
35 Alex Rosenblat, “The Truth About How Uber’s App Manages Drivers,” Harvard Business Review, 2016; and
Alex Rosenblat and Luke Stark, “Algorithmic Labor and Information Asymmetries: A Case Study of Uber’s
Drivers,” International Journal of Communication, 2016, 10: 3758 - 84.
36 https://thehub.lyft.com/blog/priority-driving-times.
37 Morgan Stanley Research, “The ABCs of AB5,” September 5, 2019, p. 3.
20insurance rates, and other economies in purchasing tires, repair services or cellphone services.
From 2014 to 2018, when overall payroll job growth was strong and unemployment rates fell to
historic lows, the industry was still able to recruit thousands of new drivers. Their success
reflects the high number of part-time drivers who need to supplement pay in their other jobs and
the limited employment options facing immigrant men without a four-year college degree. The
companies in the past also provided one-time incentives to new drivers; but following their IPOs
in early 2019, they have reduced both driver and passenger incentives. 38 39
The role of excess capacity
The variability in hours among existing drivers, the relative under-utilization of drivers, and the
recruitment of new drivers has allowed the companies to play the dominant role in determining
driver pay. The companies compete with each other primarily by minimizing passengers’ wait
times and, to a lesser extent, by decreasing fares.
To achieve quick response times, the companies require many idle drivers to be available at any
given moment and at many locations. This model creates a gap between the drivers’ desires to
maximize their earnings —by maximizing trips per working hour—and the companies’ desire
to minimize response times. In other words, the current TNC business model relies on keeping
driver utilization low, which then keeps drivers’ hourly pay low as well. The Deutsche Bank
analysis of Lyft’s operations pointed out that there was considerable room for the company to
reduce the time drivers wait for a dispatch. 40
The only floor on driver pay consists of what economists call the reservation wage—the wage
the drivers could obtain in other options, after taking into account the costs of switching jobs
(losing their considerable investments in their cars and their job-specific skills) and their
probability of finding another job. These switching costs mean that their reservation wage might
be below the minimum wage that obtains elsewhere in the local labor market.
The current business model works well for the companies so long as the supply of driver
working hours exceeds the demand for rider trip hours. The companies can then compete for
passengers by keeping their wait times low, even beyond the value of the saved time for the
riders. The companies then need a supply of available drivers in order to maintain low response
38 The companies have also emphasized the total pay that drivers receive and underplayed the costs associated with
driving. Some drivers also have not been fully aware of those costs or the risks associated with upfront investments
in their vehicles.
39 Deutsche Bank reported that Lyft reduced its reliance on driver and passenger incentives from 11 percent of gross
bookings in the third quarter of 2018 to eight percent in the second quarter of 2019. Deutsche Bank, p. 5
40 Deutsche Bank, p. 7-8.
21You can also read