FY 2019 STATEWIDE NEEDS ASSESSMENT AND PLANNING REPORT - California Department of Health Care Services - DHCS
←
→
Page content transcription
If your browser does not render page correctly, please read the page content below
FY 2019

          STATEWIDE NEEDS
      ASSESSMENT AND PLANNING
              REPORT

California Department of Health Care Services
         Substance Use Disorder Services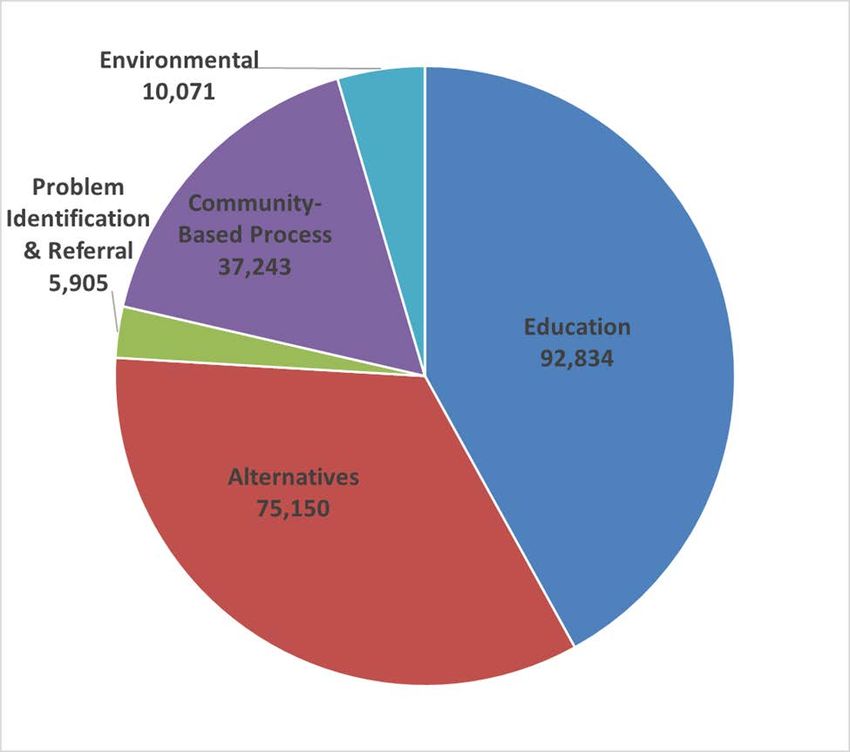
STATEWIDE NEEDS ASSESSMENT AND PLANNING REPORT
INTRODUCTION
   I
   NTRODUCTION                                                                                                                       1
                          ............................................................................................................... 1
EXECUTIVE SUMMARY                                                                                                    1
   EXECUTIVE SUMMARY .................................................................................................... 1
State Incidence and Prevalence of Substance Use 45 CFR § 96.133(a)(1)                 1
       State Incidence and Prevalence of Substance Use 45 CFR § 96.133(a)(1) ............. 1
Current Substance Use Disorder Prevention and Treatment Activities 45 CFR § 96.133(a)(2)                              3
       Current Substance Use Disorder Prevention and Treatment Activities
       45 CFR § 96.133(a)(2).............................................................................................. 3
Technical Assistance Needs to Carry Out Substance Abuse Prevention and Treatment Block Grant Activities 45 CFR § 96.133(a)(3) 3
       Technical Assistance Needs to Carry Out Substance Abuse Prevention and
       Treatment Block Grant Activities 45 CFR § 96.133(a)(3).......................................... 3
Goals and Objectives 45 CFR § 96.133(a)(4)                                                               4
       Goals and Objectives 45 CFR § 96.133(a)(4) ........................................................... 4
Extent to Which Availability of Services is Insufficient and Interim Services 45 CFR § 96.133(a)(5)                   4
       Extent to Which Availability of Services is Insufficient and Interim Services
       45 CFR § 96.133(a)(5).............................................................................................. 4
State Information Management System 45 CFR § 96.133(a)(6)                                   5
       State Information Management System 45 CFR § 96.133(a)(6) ............................... 5
STATEWIDE ASSESSMENT                                                                                               6
   STATEWIDE ASSESSMENT ............................................................................................... 6
Infrastructure Overview                                                                                                6
       Infrastructure Overview............................................................................................. 6
STATE INCIDENCE AND PREVALENCE OF SUBSTANCE USE 45 CFR § 96.133(A)(1)            6
   STATE INCIDENCE AND PREVALENCE OF SUBSTANCE USE 45 CFR § 96.133(A)(1) ............ 6
Substance Use Disorder-Related Consumption Data                                                   7
       Substance Use Disorder-Related Consumption Data ............................................... 7
National Survey on Drug Use and Health                                                                     7
          National Survey on Drug Use and Health .............................................................. 7
California Rural Indian Health Bureau, Inc.                                                                  11
          California Rural Indian Health Bureau, Inc. ......................................................... 11
California Outcomes Measurement System – Treatment                                             11
          California Outcomes Measurement System – Treatment .................................... 11
California Healthy Kids Survey                                                                                     11
          California Healthy Kids Survey ............................................................................ 11
California Behavioral Risk Factor Surveillance System                                                12
          California Behavioral Risk Factor Surveillance System ....................................... 12
California Health Interview Survey                                                                               13
          California Health Interview Survey ...................................................................... 13
Maternal Infant Health Assessment                                                                              14
          Maternal Infant Health Assessment ..................................................................... 14
Substance Use Disorder-Related Health Consequence Data                                      16
       Substance Use Disorder-Related Health Consequence Data ................................ 16
Alcohol-Related Health Consequences                                                                        16
          Alcohol-Related Health Consequences ............................................................... 16
Drug-Related Health Consequences                                                                            19
          Drug-Related Health Consequences ................................................................... 19
Substance Use among California’s Pregnant and Postpartum Women                       24
          Substance Use among California’s Pregnant and Postpartum Women .............. 24
Substance Use among California’s American Indian and Alaska Native Populations                                               26
          Substance Use among California’s American Indian and Alaska Native
          Populations.......................................................................................................... 26
Other Substance Use Disorder-Related Health and Societal Consequence Data                                                         28
       Other Substance Use Disorder-Related Health and Societal Consequence
       Data ........................................................................................................................ 28
Human Immunodeficiency Virus/Acquired Immunodeficiency Syndrome                     28
          Human Immunodeficiency Virus/Acquired Immunodeficiency Syndrome ............ 28
Hepatitis C                                                                                                                    29
          Hepatitis C ........................................................................................................... 29
Tuberculosis-Intravenous Drug Use                                                                             30
          Tuberculosis-Intravenous Drug Use .................................................................... 30

                                                                       i
Motor Vehicle Incidents 30
Motor Vehicle Incidents ....................................................................................... 30
Criminal Justice Substance Use Disorder-Related Arrests
Criminal Justice Substance Use Disorder-Related Arrests.................................. 30
30
CURRENT SUBSTANCE USE DISORDER PREVENTION AND TREATMENT ACTIVITIES 45 CFR § 96.133(A)(2) 31
CURRENT SUBSTANCE USE DISORDER PREVENTION AND TREATMENT ACTIVITIES
45 CFR § 96.133(A)(2) ............................................................................................... 31
Intended Use of Funds Relating to Prevention and Treatment
Intended Use of Funds Relating to Prevention and Treatment ............................... 31
31
Description of Statewide Primary Prevention Capacity
Description of Statewide Primary Prevention Capacity ....................................... 32
32
Primary Prevention Activities – Demographics
Primary Prevention Activities – Demographics .................................................... 39
39
Description of Statewide Substance Use Disorder Treatment Capacity
Description of Statewide Substance Use Disorder Treatment Capacity ................. 41
41
Integration to a Behavioral Health Model
Integration to a Behavioral Health Model............................................................. 41
41
Behavioral Health Stakeholder Advisory Committee
Behavioral Health Stakeholder Advisory Committee ........................................... 42
42
Drug Medi-Cal State Plan Services
Drug Medi-Cal State Plan Services ..................................................................... 42
42
Drug Medi-Cal Organized Delivery System Waiver Expansion
Drug Medi-Cal Organized Delivery System Waiver Expansion ........................... 42
42
Substance Abuse Prevention and Treatment Block Grant
Substance Abuse Prevention and Treatment Block Grant .................................. 43
43
Medication Assisted Treatment Expansion Project
Medication Assisted Treatment Expansion Project ............................................. 43
43
Youth Services Youth Services .................................................................................................... 44
44
Pregnant and Parenting Women
Pregnant and Parenting Women ......................................................................... 45
45
2016-17 Independent Peer Review Project
2016-17 Independent Peer Review Project ......................................................... 46
46
Identities of Service Providers and Their Programs
Identities of Service Providers and Their Programs ................................................ 48
48
Treatment Utilization
Treatment Utilization ............................................................................................... 49
49
Unique Beneficiaries Served
Unique Beneficiaries Served ............................................................................... 49
49
Total Served
Total Served ........................................................................................................ 49
49
One-Day Counts
One-Day Counts .................................................................................................. 50
50
Treatment Beneficiary Admission and Discharge Information
Treatment Beneficiary Admission and Discharge Information ............................. 50
50
Beneficiary Outcome Measures
Beneficiary Outcome Measures .......................................................................... 54
54
TECHNICAL ASSISTANCE NEEDS TO CARRY OUT SABG ACTIVITIES, INCLUDING COLLECTION OF INCIDENCE AND
55
TECHNICAL ASSISTANCE NEEDS TO CARRY OUT SABG ACTIVITIES, INCLUDING
PREVALENCE DATA 45 CFR § 96.133(A)(3)
COLLECTION OF INCIDENCE AND PREVALENCE DATA 45 CFR § 96.133(A)(3) ................. 55
Current Technical Assistance Capacity
Current Technical Assistance Capacity .................................................................. 56
56
Substance Use Disorder Primary Prevention Workforce
Substance Use Disorder Primary Prevention Workforce ........................................ 57
57
Substance Use Disorder Treatment Workforce
Substance Use Disorder Treatment Workforce ...................................................... 57
57
Independent Peer Review Project Reviewer Feedback
Independent Peer Review Project Reviewer Feedback .......................................... 58
58
Additional Technical Assistance Needs
Additional Technical Assistance Needs .................................................................. 59
59
GOALS AND OBJECTIVES 45 CFR § 96.133(A)(4)
GOALS AND OBJECTIVES 45 CFR § 96.133(A)(4) ......................................................... 60
60
iiEXTENT TO WHICH THE AVAILABILITY OF PREVENTION AND TREATMENT ACTIVITIES IS INSUFFICIENT TO MEET THE NEED 61
FOR SERVICES,
E
XTENT AND O
AVAILABILITY
T W HICH OF
T A HEINTERIM SERVICES 45 CFR
O P
VAILABILITY § 96.133(A)(5)
F REVENTION AND TREATMENT ACTIVITIES
IS INSUFFICIENT TO MEET THE NEED FOR SERVICES, AND AVAILABILITY OF INTERIM
SERVICES 45 CFR § 96.133(A)(5) ............................................................................... 61
Interim Services 61
Interim Services ...................................................................................................... 61
STATE INFORMATION MANAGEMENT SYSTEM 45 CFR § 96.133(A)(6) 61
STATE INFORMATION MANAGEMENT SYSTEM 45 CFR § 96.133(A)(6) ............................. 61
California Outcomes Measurement System – Treatment 61
California Outcomes Measurement System – Treatment ....................................... 61
Drug and Alcohol Treatment Access Report 62
Drug and Alcohol Treatment Access Report ........................................................... 62
California Outcomes Measurement System – Prevention 62
California Outcomes Measurement System – Prevention ...................................... 62
Primary Prevention SUD Data Service 62
Primary Prevention SUD Data Service ................................................................... 62
CONCLUSION 63
CONCLUSION ............................................................................................................... 63
APPENDIX A – LIST OF ACRONYMS 64
APPENDIX A – LIST OF ACRONYMS .......................................................................... 64
APPENDIX B – TABLE OF DATA SOURCES 66
APPENDIX B – TABLE OF DATA SOURCES .............................................................. 66
APPENDIX C – LIST OF TABLES 68
APPENDIX C – LIST OF TABLES ................................................................................ 68
APPENDIX D – LIST OF FIGURES 70
APPENDIX D – LIST OF FIGURES ............................................................................... 70
ACKNOWLEDGEMENTS 71
ACKNOWLEDGEMENTS.......................................................................................... 71
iiiINTRODUCTION
The Department of Health Care Services (DHCS) Statewide Needs Assessment and
Planning (SNAP) Report is a biennial needs assessment required of all single state
agencies receiving Substance Abuse Block Grant (SABG) funds. This SNAP Report is
intended to meet the reporting requirements in accordance with 45 Code of Federal
Regulations (CFR) section 96.133(a)(1-6).
The Executive Summary details compelling substance use and misuse data discovered
during the development of the statewide assessment. Additionally, the Executive
Summary provides a high-level overview of California’s capacity to meet the behavioral
health needs of its citizens, and a preview of California’s Strategic Initiatives designed to
minimize, if not close, the gaps exposed during the assessment phase.
Immediately following the Executive Summary, the Assessment Section of the SNAP
presents a more robust picture of the data captured to measure California’s Substance
Use Disorder (SUD) incidence and prevalence rates among its low-income
beneficiaries, and identifies related service utilization, beneficiary outcomes, and
program performance. The Assessment section also provides information on the current
capacity and effectiveness of SUD prevention and treatment services and training to its
workforce, and conveys the priorities to address unmet prevention, treatment, and
recovery service needs. The data presented in the SNAP Report are taken from the
most recent sources available at the time the report was written. A Table of Data
Sources is located in Appendix B of this report.
The Assessment Section of the SNAP Report outlines DHCS’s strategic initiatives for
state fiscal year (SFY) 2020-21, aligning state-specific goals with the five priority areas
and five core principles identified in the “Substance Abuse and Mental Health Services
Administration’s (SAMHSA) Strategic Plan FY 2019-2023,”1 and “DHCS’s Strategy for
Quality Improvement in Health Care 2018.” 2
Through the SNAP process, DHCS strives to make strategic decisions in awarding
SABG funds for overall improvements to SUD prevention, treatment, and recovery
infrastructure in California.
EXECUTIVE SUMMARY
State Incidence and Prevalence of Substance Use 45 CFR
§ 96.133(a)(1)
Marijuana:
According to the University of California Los Angeles’ (UCLA) California Health
Interview Survey (CHIS), 60 percent of adolescents (ages 12-17) who have tried
1 https://www.samhsa.gov/sites/default/files/samhsa_strategic_plan_fy19-fy23_final-508.pdf
2 https://www.dhcs.ca.gov/services/Documents/DHCS_Quality_Strategy_2018.pdf
1marijuana have used it one or more times in the last 30 days; double the rate of adults
(ages 18+).
According to the California Healthy Kids Survey (CHKS), marijuana use in the past 30
days was the second most frequently consumed substance by youth, with 9.5 percent of
ninth graders and 16.7 percent of eleventh graders reporting consuming marijuana in
the past month; decreases from 2013-2015 (13.4 percent and 20.1 percent,
respectively).
Amphetamines/Methamphetamines:
Methamphetamine is the most prevalent drug reported at treatment admission;
33 percent. Less than 1 percent of the general population uses Methamphetamine;
however, it accounts for more than 33 percent of the admissions for drug treatment in
California.
Maternal Opioid Use:
According to data from the Maternal Infant Health Assessment (MIHA), California
experienced a 350 percent increase in opioid overdose death rates occurring in women
of childrearing age from 1999-2017.
American Indians/Alaska Native Opioid Use:
According to the California Tribal Epidemiology Center (CTEC), American
Indians/Alaska Natives (AI/AN) experience a very high opioid overdose death rate
(almost double any other race/ethnicity category); a problem exacerbated by
unavailability or inaccessibility to Indian Health Services (IHS).
Nearly 80 percent of AI/AN overdose deaths resulted from prescription opioids.
Alcohol:
Alcohol use is down over all. Both national and state data confirm declines in alcohol
use across all age groups from SFY 2015-16 to FY 2016-17.
2Current Substance Use Disorder Prevention and Treatment Activities
45 CFR § 96.133(a)(2)
California Outcomes Measurement System – Prevention (CalOMS Pv) Data for
SFY 2016-17
The total number of individuals receiving primary prevention services in SFY 2016-17
totaled 221,203. 3 The total number of individuals served slightly decreased since
SFY 2014-15, in which 268,750 individuals were served. The total numbers do not
include totals from information dissemination strategy services.
• Information Dissemination Strategies are aimed to educate the general public
and do not capture the number of individuals served.
• Education strategies served 92,834 individuals.
• Alternative activities were provided to 75,150 individuals.
• Problem Identification and Referral strategies were provided to 5,905 individuals.
• Community-Based Process strategies were provided to 37,243 individuals.
• Environmental strategies reached 10,071 individuals and/or communities.
California Outcomes Measurement System – Treatment (CalOMS Tx) Data for
SFY 2016-17
• Approximately 186,000 unique beneficiaries were served; approximately 9,000
fewer beneficiaries than were served in SFY 2014-15.
• Nearly 86,000 beneficiaries were in treatment on April 1, 2017, in California
(one-day count).
• There were over 160,000 admissions to treatment for all services, including
admissions to publicly-monitored SUD detoxification, residential, and outpatient
services. Of the 160,000 admissions, 120,000 were unique beneficiaries.
• The largest percentage of admissions to treatment occurred in Outpatient
Drug-Free (ODF) treatment with 40 percent. Residential (short-term and
long-term) treatment admissions was 22 percent, 17 percent for Detoxification,
16 percent for Narcotic Treatment Program (NTP) maintenance services, and
5 percent for Intensive Outpatient Treatment (IOT).
• There were over 157,000 treatment discharges for approximately 122,000
beneficiaries.
Technical Assistance Needs to Carry Out Substance Abuse
Prevention and Treatment Block Grant Activities 45 CFR § 96.133(a)(3)
DHCS invests a portion of its SABG award toward Training and Technical Assistance
(TTA) for the SUD workforce across the continuum of care. DHCS works with a variety
of nationally recognized organizations to ensure that TTA recipients receive relevant
3 The total number of beneficiaries served for SFY 2016-17 is based on preliminary data due to cost
reports not settled at the time of this report.
3and innovative information to inform their local program implementation. In 2018, the
Center for Applied Research (CARS) surveyed SUD prevention professionals to assess
the training needs of the field. Survey results found the following topics as top priority:
• Implementing youth marijuana prevention programs
• SUD prevention programming in rural communities
• Social Determinants of Health
• Opioid use among adults and older adults
DHCS will work with multiple contractors toward making TTA available on these topics.
DHCS will also complete surveys of the youth workforce in an effort to continue its
assessment of the characteristics of the overall SUD workforce.
Goals and Objectives 45 CFR § 96.133(a)(4)
Strategic Initiative #1: Reduce opioid misuse, use disorder, overdose, and related health
consequences through continued implementation of the California Medication Assisted
Treatment (MAT) Expansion Project and Strategic Prevention Framework Partnerships
for Success (SPF PFS) grant.
Strategic Initiative #2: Reduce youth marijuana use and related consequences and
contributing factors by expanding youth SUD prevention programs.
Strategic Initiative #3: Improve access to SUD services through continued
implementation of the Drug Medi-Cal Organized Delivery System (DMC-ODS) waiver,
and advance county understanding of the use of SABG funding as it pertains to
California’s Drug Medi-Cal (DMC) program, especially in rural communities.
Strategic Initiative #4: Broaden statewide availability of evidence-based, outcome-driven
SUD services for youth and other special populations across the continuum of care.
Strategic Initiative #5: Increase the number of trained and culturally competent
professionals and paraprofessionals to address California’s prevention, treatment and
recovery workforce needs.
Strategic Initiative #6: Expand and improve the data collection, analysis, evaluation, and
dissemination of information related to SUDs and receipt of services.
Extent to Which Availability of Services is Insufficient and Interim
Services 45 CFR § 96.133(a)(5)
Based annual averages for CYs 2016 and 2017; “National Survey on Drug Use and
Health” (NSDUH) estimates the following:
• 2.8 percent of Californians ages 12+ reported needing, but not receiving,
treatment at a Specialty Facility for illicit drug use in the past year, compared to
3.1 percent in CYs 2015-16.
4• 5.4 percent of Californians ages 12+ reported needing, but not receiving,
treatment at a Specialty Facility for alcohol use in the past year, compared to
6.2 percent in CYs 2015-16.
State Information Management System 45 CFR § 96.133(a)(6)
In SFY 2016-17, California continued utilizing the CalOMS Tx data system to track
treatment capacity, including treatment admissions and discharges; the Drug and
Alcohol Treatment Access Report (DATAR) system to collect waitlist data; and, the
CalOMS Pv data system to collect and report data on implemented prevention
strategies and service deliveries, as well as to identify Institute of Medicine (IOM)
categories of risk and populations served.
Recently, all three data systems began migration to new data platforms. DHCS selected
a third party vendor to host the new prevention data system and, as of 2019, both the
CalOMS Tx and DATAR systems have migrated to a behavioral health services
information system environment.
Department of Health Care Services
Behavioral Health Community Services Division
Contracts and Grants Management Section
1500 Capitol Avenue
P.O. Box 997413, MS 2624
Sacramento, California 95899-7413
SABGPublicComment@dhcs.ca.gov
July, 2019
5STATEWIDE ASSESSMENT
Infrastructure Overview
DHCS’s ongoing mission is to provide Californians with access to affordable, integrated,
and high-quality health care, including medical, dental, mental health, SUD prevention
and treatment, and long-term care services. DHCS’s vision is to preserve and improve
the overall health and well-being of all Californians. 4 DHCS’s success is only possible
through collaboration and cooperation with federal and other state agencies, counties,
and stakeholders.
DHCS is the backbone of California’s health care safety net, funding health care
services for approximately 13 million Medi-Cal beneficiaries, plus additional low-income
individuals who do not qualify for Medi-Cal. About one-third of Californians receive
health care services financed or organized by DHCS, making DHCS the largest health
care provider in California. According to the Governor’s SFY 2019-2021 budget, DHCS
has been allocated over $106 billion in public funds for the care of low-income families,
children, pregnant women, seniors, and persons with disabilities. 5
DHCS is the single state agency responsible for administering California’s DMC
program. In addition, DHCS currently administers four SAMHSA Grants 1) the SABG,
2) the State Targeted Response to Opioid Crisis Grant, 3) the State Opioid Response
Grant, and 3) the SPF PFS Grant.
As of July 2019, 28 California counties are contracted to deliver State Plan DMC
services, while 30 counties provide expanded DMC services through the DMC-ODS
demonstration waiver with the Centers for Medicare and Medicaid Services.
While California seeks to align its strategic initiatives with the national strategic plan, it is
important to note that in November 2016, California passed Proposition 64 (Prop. 64),
legalizing the recreational use of marijuana for persons 21 and over. A portion of the tax
revenue is disbursed to DHCS for SUD prevention programs for youth.
Also in 2019, DHCS mental health and SUD state-level staff reorganized to become an
integrated behavioral health division. This organizational structure is designed to
improve efficiencies department-wide, increase program administration accountability,
improve service delivery, decrease processing times, and increase communication and
engagement for stakeholders and employees.
STATE INCIDENCE AND PREVALENCE OF SUBSTANCE USE 45 CFR
§ 96.133(a)(1)
As determined by statute, this section of the SNAP Report provides data and
information to measure the incidence and prevalence of SUD. “Incidence” refers to the
4 https://www.census.gov/quickfacts/CA
5 http://www.ebudget.ca.gov/2019-20/pdf/Enacted/GovernorsBudget/4000/4260.pdf
6number of new cases that emerge within a given time period. “Prevalence” refers to the
total number of cases at any given moment in time. This Report focuses on four main
areas that provide a snapshot of the impact of SUD on individuals:
• SUD-related consumption
• SUD-related health consequences
• SUD-related motor vehicle incidents
• SUD-related arrests
Analyzing data from these four areas facilitates a comprehensive and accurate
understanding of the incidence and prevalence of substance use and abuse in
California. These categories capture a point-in-time picture of statewide trends across
prevention, treatment, and recovery services in California’s SUD delivery system.
The needs assessment data generally includes the most current information available.
Depending upon the source, data may cover multiple time spans. For example, sections
of this report may compare data from the most recent CYs available, versus data based
on the SFY.
In preparing the 2019 SNAP Report, DHCS made every effort to be transparent
regarding the weaknesses and biases in the data from which conclusions were reached.
By critically reviewing data reliability and validity, DHCS is mindful about developing
strategies to improve the data and resulting information to inform program policies and
services in the future. DHCS outlines the strategies for improvement in the strategic
initiatives articulated in this report, along with requests for federal TTA to leverage the
quality of system data reporting. By following a quality improvement process, DHCS can
improve services and make future needs assessments more accurate, complete, and
meaningful.
Substance Use Disorder-Related Consumption Data
National Survey on Drug Use and Health
The following estimates from the SAMHSA NSDUH are based on household
face-to-face interview samples and exclude some populations (e.g., homeless,
incarcerated) who likely use substances at higher levels than individuals living in the
household population.
SAMHSA published the NSDUH state estimates of past month substance use among
individuals ages 12+ for CYs 2016-17. 6 To generate accurate state-level estimates,
6SAMHSA (2018). NSDUH: Comparison of 2015–2016 and 2016–2017 Population Percentages.
Available at: https://www.samhsa.gov/data/report/comparison-2015-2016-and-2016-2017-nsduh-
population-percentages-50-states-and-district.
7SAMHSA combines two years of NSDUH data. In its most recent report, SAMHSA
compares CYs 2015-16 data with CYs 2016-17 data to examine changes over time. 7
Please note that this section is limited to a discussion of the results in tables and reports
published by SAMHSA as of February 2019.
Alcohol Use
• In CYs 2016-17, 5.5 percent of Californians ages 12+ reported an alcohol use
disorder, down from 6.4 percent in CYs 2015-16.
• In CYs 2014-15, 3.5 percent of Californians ages 12+ reported an alcohol
dependence disorder in the past year, up slightly from 3.3 percent in
CYs 2013-14. 8
Illicit Drug Use
Illicit drugs includes the misuse of prescription psychotherapeutics (i.e., pain relievers,
tranquilizers, stimulants, and sedatives) or the use of marijuana, cocaine (including
crack), inhalants, hallucinogens, heroin, or methamphetamine.
• In California, there was no significant change in past month illicit drug use; from
12.6 percent in CYs 2015-16 to 13.1 percent in CYs 2016-17.
Marijuana Use
Data estimates on marijuana use revealed statistically significant increases.
• In CYs 2016-17, 17.4 percent of Californians ages 12+ used marijuana in the
past year, a significant increase from 16.2 percent in CYs 2015-16.
• Marijuana past month usage in California significantly increased from
10.5 percent in CYs 2015-16 to 11.3 percent in CYs 2016-17.
• Perception of risk of marijuana use in California is lower than the national
average among youth under age 18.
• Marijuana use rates among emerging adults ages 18 to 25 in California is higher
than the national average.
7 A p-value of 0.05 was used to determine significance. A “p-value,” in this context, is the certainty that the
difference between the percentages discussed is observed by pure change. A p-value of 0.05 means that
there is a 5 percent chance that the difference between the percentages in this survey sample does not
actually exist in the population and a 95 percent chance that it does. For example, a p-value of 0.05
means a 95 percent certainty exists that the results were not due to chance.
8 The two different alcohol disorder categories in these NSDUH estimates use the American Psychiatric
Association’s Diagnostic and Statistical Manual of Mental Disorders, 4th Edition (DSM-IV) criteria of
‘alcohol abuse’ and ‘dependence’. Under DSM–IV, anyone meeting one or more of the “abuse” criteria
within a 12-month period would receive the “abuse” diagnosis. Anyone with three or more of the
“dependence” criteria during the same 12-month period would receive a “dependence” diagnosis. NSDUH
uses the term “alcohol use disorder” for the ‘alcohol abuse’ level. For more understanding of the two
levels and specific criteria, see page 2 of the following document:
https://pubs.niaaa.nih.gov/publications/dsmfactsheet/dsmfact.pdf.
8Other Illicit Drugs
The review of NSDUH California data covering CYs 2015-2016 and CYs 2016-2017
revealed no significant overall changes in use of other illicit drugs, including cocaine or
misuse 9 of pain relievers.
• In CYs 2016-17, 2.7 percent of Californians reported using cocaine in the past
year, compared with 2.4 percent in CYs 2015-16.
• In CYs 2015-16 and CYs 2016-17, Californians ages 12+ reported using heroin
in the past year decreased from 0.24 percent to 0.19 percent.
• Californians ages 12+ reported past year misuse of pain relievers decreased
from 4.7 percent (CYs 2015-16), to 4.3 percent (CYs 2016-17).8
Age Group Differences
DHCS found positive news in the data related to the different age groups, as there were
significant decreases in substance use in California from CYs 2015-16 when compared
to CYs 2016-17. For example:
Ages 12+
• Past year pain reliever use disorder (0.63 percent vs. 0.51 percent)5 10
• Past year alcohol use disorder (6.4 percent vs. 5.5 percent) 11
Ages 12 to 17
• Past month cigarette use (2.7 percent vs. 2.1 percent)12
Ages 18 to 25
• Past year misuse of pain relievers (8.0 percent vs. 6.8 percent)
• Past month illicit drug use other than marijuana (8.2 percent vs. 7.0 percent)
• Past month cigarette use (19.3 percent vs. 17.0 percent)
• Past year pain reliever use disorder (0.9 percent vs. 0.6 percent)
Ages 26+
• Past year alcohol use disorder (6.2 percent vs. 5.2 percent)
• Past year substance use disorder (7.2 percent vs. 6.7 percent) 13
9 Misuse of prescription psychotherapeutics is defined as use in any way not directed by a doctor,
including use without a prescription of one’s own; use in greater amounts, more often, or longer than told;
or use in any other way not directed by a doctor. Prescription psychotherapeutics do not include over-the-
counter drugs.
10 Pain Reliever Use Disorder is defined as meeting criteria for pain reliever dependence or abuse as
defined by the DSM-IV.
11 Alcohol Use Disorder is defined as meeting criteria for alcohol dependence or abuse as defined by the
DSM-IV.
12 While cigarette smoking has declined, it may be due to use of electronic vaporizing devices for
delivering nicotine. Research on cigarette and e-cigarette use is needed to continue monitoring these
developments. NSDUH does not currently ask separate questions about e-cigarette use.
13 Substance Use Disorder is defined as meeting criteria for illicit drug or alcohol dependence or abuse as
defined by the DSM-IV.
9It is important to note that while significant statistical use decreases were found among
different age groups, significance here means the differences between years is unlikely
to be due to chance, regardless of whether or not they are substantial. While the
decreases are relatively small, they suggest SUD prevention activities may be making
an impact. A majority of the decreases reported here are clearly significant, but other
differences may also exist that are not discussed in this report.
There was a significant increase in past month marijuana use among adults ages 26+
(8.7 percent vs. 9.7 percent). There was also a significant increase in past-year
marijuana use among young adults ages 18-25 (34.0 percent vs. 36.5 percent) and
adults ages 26+ (13.5 percent vs. 14.6 percent).
Alcohol Use – By Gender and Age Group 14
Research shows that males and females begin drinking at similar rates, but that males
report higher drinking rates later in life and have greater illicit drug use throughout life.
The following national information from the NSDUH 2017 report supports the conclusion
that both sexes start out with similar drinking rates (based on past month data), but
male drinking becomes more prevalent with age.
Ages 12+
• In CY 2017, an estimated 55.5 percent of males ages 12+ were current
drinkers, while the rate for females was 48.1 percent.
Ages 12-17
• In CY 2017, among youth ages 12-17, the percentage of females who were
current drinkers (11.0 percent) was higher than for males (8.8 percent).
Ages 18-25
• Among young adults ages 18-25, an estimated 57.2 percent of males and
55.4 percent of females were current drinkers in CY 2017.
Ages 26+
• Among individuals ages 26+, an estimated 61.0 percent of males and
51.1 percent of females reported current drinking in CY 2017.
Illicit Drug Use13
NSDUH CY 2017 (not California specific) data also show that illicit drug use is higher for
males than females, as reported in prior years as well.
14 Center for Behavioral Health Statistics and Quality. (2018). “2017 National Survey on Drug Use and
Health: Detailed Tables.” Substance Abuse and Mental Health Services Administration, Rockville, MD.
https://www.samhsa.gov/data/sites/default/files/cbhsq-reports/NSDUHDetailedTabs2017/
NSDUHDetailedTabs2017.pdf
10• In CY 2017, the rate of current illicit drug use among individuals ages 12+ was
higher for males (13.7 percent) than females (8.8 percent), which are both
increases from CY 2016 rates (12.8 percent and 8.5 percent, respectively).
Males were more likely than females to be current users 15 of several different illicit
drugs in CY 2017, including, but not limited to:
• Marijuana (11.9 percent vs. 7.3 percent, respectively)
• Cocaine (1.1 percent vs. 0.5 percent, respectively)
• Hallucinogens (0.7 percent vs. 0.4 percent, respectively)
• Methamphetamine (0.4 percent vs 0.2 percent, respectively)
• Misuse of Pain Relievers (1.3 percent vs. 1.1 percent, respectively)
• Misuse of Opioids (1.5 percent vs. 1.1 percent, respectively) 16
California Rural Indian Health Bureau, Inc.
The California Rural Indian Health Bureau, Inc. (CRIHB) supports the work of the
CTEC. According to CTEC’s “California American Indian/Alaska Native Community
Health Profile,” September 2015, California’s AI/AN population is treated for opioid use
at a higher rate than that of non-Indian counterparts during the same time period. The
highest prevalence of AI/ANs receiving a diagnoses for misuse of opioids was in
Humboldt, Riverside, Sacramento and Sonoma Counties. Over 52 percent of the opioid
misuse among American Indians occurred in the 20 to 40 age range. 17
California Outcomes Measurement System – Treatment
According to CalOMS Tx data for SFY 2014-15, the peak age for first use of a
substance by youth who had been admitted to a DHCS monitored SUD treatment
facility was age 13, a statistic that remained unchanged from FY 2013-14. Most
significantly, CalOMS Tx data highlighted that 18 percent of youth began using
substances when they were 11 years old or younger.
California Healthy Kids Survey
The following review of CHKS survey data provides estimates gathered from this
statewide survey of youth patterns tracking current substance use in the past 30 days.
CHKS is a large statewide survey generally used by service providers and educators as
a powerful tool to help identify strengths, weaknesses, needs, resiliency, protective
15 Current Use or Misuse* For substances other than prescription psychotherapeutic drugs (pain relievers,
tranquilizers, stimulants, or sedatives), current use refers to any reported use of a specific substance in
the past 30 days (also referred to as “past month use”). For prescription psychotherapeutic drugs, current
misuse refers to misuse of psychotherapeutics in the past 30 days. (Respondents were not asked about
any use of psychotherapeutics in the past 30 days).
16 Opioid misuse refers to the use of heroin or the misuse of prescription pain relievers (past month or
year use). Prescription pain relievers do not include over-the county drugs. Prescription pain relievers
could include some non-opioids because respondents could specify that they misused other pain
relievers that are not opioids.
17 https://crihb.org/wp-content/uploads/2018/07/CTEC_Opioid-Surveillance-Update.pdf
11factors, and risky behaviors occurring among children in grades 7, 9, and 11. DHCS
collected the following data from the CHKS 2015-17 combined sample of 45,264
secondary school students. The survey results help guide statewide efforts to improve
school climates, increase availability of learning supports, and engage students in
healthier lifestyle behaviors. CHKS helps individuals working with children and
adolescents to identify and increase the quality of health, prevention, and youth
development programs. In reviewing the CHKS 2015-17 data, there are declines in
overall alcohol and drug use and frequent/heavy use. Although trends are in the right
direction, rates of use among eleventh graders remain disconcerting. In the CHKS
2015-17 report:
• Alcohol use in the past 30 days was reported by 5.1 percent of seventh graders,
14.6 percent of ninth graders, and 22.5 percent of eleventh graders, which were
all decreases from 2013-15 (8.2 percent, 18.6 percent, and 29.1 percent,
respectively).
• Binge drinking (five drinks or more on the same occasion) among youth was a
common practice, occurring among 6 percent of ninth graders, and 11.6 percent
of eleventh graders; decreases from 2013-15 (9.6 percent and 17.6 percent,
respectively).
• Marijuana use in the past 30 days was the second most frequently consumed
substance by youth, with 9.5 percent of ninth graders and 16.7 percent of
eleventh graders reporting consuming marijuana in the past month; decreases
from 2013-2015 (13.4 percent and 20.1 percent, respectively).
California Behavioral Risk Factor Surveillance System
The California Behavioral Risk Factor Surveillance System (BRFSS) is funded by the
U.S. Centers for Disease Control and Prevention (CDCP), and is a widespread, ongoing
telephone health survey system. BRFSS was developed to enable state health
agencies to better capture and interpret data and target resources to reduce behavioral
risks and their consequent illnesses. National data may not be applicable to the
conditions found in any given state. However, achieving national health goals through
monitoring data and targeting behavioral change interventions requires state and local
agency participation. Monitoring data helps inform and facilitate efforts to improve
lifespan, health, and longevity. The basic philosophy of the survey is to collect data with
a specific focus on actual behaviors related to disease and injury, rather than surveying
attitudes or knowledge. Understanding a population’s actions and habits is instrumental
in facilitating efforts to plan, initiate, support, and evaluate health promotion and disease
prevention programs.
BRFSS includes the Cell Phone Survey. By including cell phones in the survey, BRFSS
is able to reach segments of the population that were previously inaccessible
(individuals who have a cell phone but not a landline) and results in a more
12representative sample and higher quality data. Cell Phone Surveys were included in the
public release data set beginning in 2011. 18
BRFSS is conducted by the Division of Behavioral Surveillance in the CDCP’s Public
Health Surveillance and Informatics Program office. BRFSS prevalence estimates for
2017 show:
• The percentage of heavy drinkers 19 was the same in California (6.3 percent) as
the nation (6.3 percent).
• In California, the population groups with the highest rates of heavy drinking were
male individuals, ages 18-24, and non-Hispanic Whites.
• The percentage of binge drinkers 20 was higher in California (17.6 percent) than
the nation (17.4 percent).
• In California, the population groups with the highest rates of binge drinking were
among male individuals, ages 25-34, and multiracial non-Hispanics.
California Health Interview Survey
In 2016, DHCS sponsored a series of substance use and misuse questionnaires
through the CHIS to measure and monitor existing and emerging problems in California,
such as the ongoing opioid overdose epidemic. CHIS, conducted by UCLA’s Center for
Health Policy Research, is a comprehensive statewide, population-based, telephone
survey. The survey collects extensive information for all age groups on a wide range of
health topics across California’s 58 counties. CHIS provides timely and high quality data
accurately capturing the rich diversity of the California population and geographic areas.
CHIS data enables researchers and practitioners to identify diverse, ethnic, and
hard-to-reach special sub-groups at highest risk for poor health outcomes at the
individual, community, and policy levels.
Key highlights from CHIS 2017 substance use data:
Marijuana
• Over 47 percent of Californians ages 12+ have tried marijuana or hashish at least
once in their lives.
18 In 2011, a new weighting methodology—raking, or iterative proportional fitting-replaced the post
stratification weighting method that were used with previous BRFSS data sets. In addition to age, gender,
and race/ethnicity, raking permits more demographic variables to be included in weighting such as
education attainment, marital status, tenure (property ownership), and telephone ownership. Details on
this methodology are provided in the June 8, 2012, issue of the “Morbidity and Mortality Weekly Report,”
which highlights weighting effects on trend lines.
http://www.cdc.gov/surveillancepractice/reports/brfss/brfss.html
19 Heavy drinking is defined as adult males having more than 14 drinks per week and adult females
having more than 7 drinks per week.
20 Binge drinking is defined as males having five or more drinks on one occasion and females having four
or more drinks on one occasion in the past month.
13• Among those who have tried marijuana, nearly 30 percent of adults (ages 18+)
last used it within the past month, and almost 60 percent of adolescents (ages
12-17) have used it one or more days in the past 30 days.
• The prevalence of past-month marijuana use was higher among rural, male,
AI/AN, and gay, lesbian, and bisexual adults compared to their counterparts.
• Past-month marijuana use among adults increased as levels of income
decreased. Adults living below 100 percent Federal Poverty Level (FPL) had a
higher prevalence of use (33.5 percent) than adults with higher incomes at
300 percent FPL and above (26.8 percent).
Prescription Drugs
• Approximately 2.0 percent of adults in California reported having misused
prescription painkillers in the past year, and the misuse was generally higher
among adults ages 25-39.
• Low-income adults (Table 1: Percent of Females in California Who Report Binge Drinking Three Months
before Pregnancy, or Any Alcohol Use during the Third Trimester, by Maternal Age,
SFY 2013-15
Maternal Age Binge Drinking Three Months before Pregnancy Any Alcohol Use in Third Trimester
Maternal Binge Drinking Three Months before Any Alcohol Use in Third
Age Pregnancy Trimester
15 – 19
15 – 19 10.0% 10.0% 0.4% 0.4%
20 – 34
20 – 34 16.3% 16.3% 6.9% 6.9%
35+ 35+ 12.0% 12.0% 11.0% 11.0%
Source: MIHA Survey Data Snapshots, 2013-2015. CDPH, 2018. 21
• White females had the highest percentages of binge drinking in the three months
before pregnancy, and any alcohol use in the third trimester (Table 2).
Table 2: Percent of Females in California Who Report Binge Drinking Three Months
before Pregnancy, or Any Alcohol Use during the Third Trimester, by Race/Ethnicity,
SFY 2013-15
Race/Ethnicity
Race/Ethnicity Binge Drinking Three Months before Pregnancy
Binge Drinking Three Months Any Alcohol Use in Third Trimester
Any Alcohol Use in Third
before Pregnancy Trimester
White
White 21.0% 21.0% 15.3% 15.3%
Hispanic
Hispanic 13.9% 13.9% 3.7% 3.7%
African American
African American 13.3% 13.3% 3.1% 6.1%
Asian/Pacific Islander
Asian/Pacific 7.9% 7.9% 4.4% 4.4%
Islander
Statewide a
Statewide a 15.1% 15.1% 7.3% 7.3%
Source: MIHA Survey Data Snapshots, 2013-15. CDPH, 2018. 22; aTotal includes records with missing race/ethnicity.
• Females ages 15-19 had the highest percentage of postpartum smoking
(Table 3).
Table 3: Percent of Females in California Who Report Smoking Three Months before
Pregnancy, or Any Smoking during the Third Trimester or Postpartum, by Maternal Age,
SFY 2013-15
Maternal Age
Maternal Age Smoking Three Months before
Smoking Three Any Smoking in Third Trimester
Any Smoking in Third Any Smoking Postpartum
Any Smoking
Pregnancy
Months before Trimester Postpartum
Pregnancy
15 – 19 15 – 19 10.5% 10.5% 2.5% 2.5% 6.6% 6.6%
20 – 34 20 – 34 11.8% 11.8% 3.1% 3.1% 5.9% 5.9%
35+ 35+ 7.0% 7.0% 1.2% 1.2% 3.1% 3.1%
Source: MIHA Survey Data Snapshots, 2013-15. CDPH, 2018.24
https://www.cdph.ca.gov/Programs/CFH/DMCAH/MIHA/CDPH%20Document%20Library/2013-2015/Snapshot_ByMaternalAge_2013-2015.pdf
21 https://www.cdph.ca.gov/Programs/CFH/DMCAH/MIHA/CDPH%20Document%20Library/2013-
2015/Snapshot_ByMaternalAge_2013-2015.pdf
https://www.cdph.ca.gov/Programs/CFH/DMCAH/MIHA/CDPH%20Document%20Library/2013-2015/Snapshot_ByRaceEthnicity_2013-2015.pdf
22 https://www.cdph.ca.gov/Programs/CFH/DMCAH/MIHA/CDPH%20Document%20Library/2013-
2015/Snapshot_ByRaceEthnicity_2013-2015.pdf
15• African Americans had the highest percentages of smoking cigarettes across all
three smoking categories (Table 4).
Table 4: Percent of Females in California Who Report Smoking Three Months before
Pregnancy, or Any Smoking during the Third Trimester or Postpartum, by
Race/Ethnicity, SFY 2013-15
Race/Ethnicity Smoking Three Months before Any Smoking in Third Trimester Any Smoking Postpartum
Race/Ethnicity Smoking Three Any Smoking in Any Smoking
Pregnancy
Months before Third Trimester Postpartum
Pregnancy
African American
African American 18.1% 18.1% 6.0% 6.0% 12.1% 12.1%
WhiteWhite 16.6% 16.6% 4.9% 4.9% 9.3% 9.3%
Hispanic
Hispanic 7.8% 7.8% 1.4% 1.4% 3.1% 3.1%
Asian/Pacific Islander
Asian/Pacific 6.3% 6.3% 1.5% 1.5% 2.4% 2.4%
Islander
Statewide a
Statewide a 10.8% 10.8% 2.7% 2.7% 5.4% 5.4%
Source: MIHA Survey Data Snapshots, 2013-15. CDPH, 2018.24; aTotal includes records with missing race/ethnicity.
Substance Use Disorder-Related Health Consequence Data
Alcohol-Related Health Consequences
Excessive use of alcohol (i.e., underage, binge and heavy drinking) continues to have
major health consequences in California. CDCP has created the Alcohol Related
Disease Impact (ARDI) application 23 that estimates the harmful effects of excessive use
of alcohol. It calculates the chronic and acute effects of excessive alcohol use for both
100 percent alcohol-attributable causes (e.g., Alcoholic liver disease, alcohol poisoning)
and other direct and indirect alcohol-attributable fractions for related causes (e.g.,
Unspecified liver cirrhosis, motor vehicle crashes, firearms, self-harm).
Deaths
Table 5 displays the CDCP estimates that an average of over 10,600 annual deaths in
California during CYs 2006-2010 were attributable to chronic and acute alcohol-related
conditions, with males accounting for the vast majority of the alcohol-attributable deaths.
The top five alcohol-attributable, acute causes of deaths were motor vehicle traffic
crashes, homicides, poisonings, suicides, and falls. Over 4,000 California resident
deaths per year were solely due to alcohol-attributable causes, with the predominant
effect related to chronic diseases.
23 CDCP. ARDI application, 2013. Available at www.cdc.gov/ARDI.
16Table 5: Average Annual Alcohol-Attributable Deaths in California Due to Excessive
Alcohol Use, by Gender – All Ages, 2006-2010
Causes Males Females Overall
Causes Males Females Overall
Chronic
ChronicCauses Causes 3,880 3,880 1,653 1,653 5,533 5,533
Acute CausesCauses
Acute 3,795 3,795 1,318 1,318 5,113 5,113
Total for
Total All Causes
for All Causes 7,675 7,675 2,971 2,971 10,645 2410,645 24
SOURCE: CDCP. ARDI application, 2013.22
Table 6 shows that overall California residents lost over 300,000 years of potential life
(i.e., premature deaths) each year from chronic and acute alcohol attributable conditions
due to excessive alcohol use. The 20-34 year age group accounted for the largest
portion of acute causes, whereas the older age groups (35-49; 50-64) accounted for the
majority of the alcohol-attributable chronic causes.
Table 6: Average Annual Years of Potential Life Lost in California Due to Excessive
Alcohol Use, by Age Group, 2006-2010
Causes Ages 0-19 Ages 20-34 Ages 35-49 Ages 50-64 Ages 65+ Overall
Causes Ages Ages Ages Ages Ages Overall
0-19 20-34 35-49 50-64 65+
Chronic Causes
Chronic 1,1521,152 6,4306,430 41,866
41,866 56,811
56,811 20,389
20,389 126,648
126,648
Causes
Acute Causes 22,628 72,912 48,979 27,095 8,406 180,017
Acute 22,628 72,912 48,979 27,095 8,406 180,017
Causes
TotalTotal
for All Causes
for All 23,780
23,780 78,342
78,342 90,845
90,845 83,906
83,906 28,792
28,792 306,665
306,665
Causes
Based on the 100 percent alcohol-attributable conditions presented above, CDPH Safe
and Active Communities Branch (SACB) has updated the estimated number of
alcohol-attributed deaths and injuries requiring medical services in California, as shown
in Tables 7 through 9 below. In Table 7, there were over 5,000 alcohol-attributed deaths
with an age adjusted rate of 11.5 deaths per 100,000 residents in 2017. The vast
majority of these deaths were related to chronic conditions. [Note: the CDCP numbers
include all alcohol-attributed infractions for causes, whereas the data below include only
the 100 percent alcohol-attributed causes.]
24 Due to rounding, amounts in the Total column may not equal the sum of the numbers.
17Table 7: Number and Rate* of 100 Percent Alcohol-Attributed Deaths in California,
2010-2017**
Year
Year All Alcohol-Attributable Number/Rate
All Alcohol-Attributable Chronic Causes Number/Rate
Chronic Causes Acute Causes Number/Rate
Acute Causes
Number/Rate Number/Rate Number/Rate
2010
2010 4,220/10.9 4,220/10.9 2,884/10.0 2,884/10.0 336/0.9 336/0.9
2011
2011 4,405/11.1 4,405/11.1 4,107/10.3 4,107/10.3 298/0.8 298/0.8
2012
2012 4,359/10.7 4,359/10.7 4,189/10.1 4,088/10.1 271/0.7 271/0.7
2013
2013 4,505/10.9 4,505/10.9 4,189/10.1 4,189/10.1 316/0.8 316/0.8
2014
2014 4,692/11.1 4,692/11.1 4,385/10.3 4,385/10.3 307/0.8 307/0.8
2015
2015 5,116/11.9 5,116/11.9 4,812/11.2 4,812/11.2 304/0.8 304/0.8
2016
2016 5,023/11.6 5,023/11.6 4,754/10.9 4,754/10.9 269/0.7 269/0.7
2017
2017 5,058/11.5 5,058/11.5 4,763/10.8 4,763/10.8 195/0.7 295/0.7
* Age-adjusted rate per 100,000 residents
** Numbers differ slightly from published data (2010-2013) on the SACB EpiCenter because of the use of revised
codes for 100 percent alcohol attributed causes.
Source: Death Statistical Master and California Comprehensive Death Files; CDPH Center for Health Statistics and
Informatics; prepared by: SACB staff, May 2019
Hospitalizations
Table 8 displays the increasing number (and age adjusted rate) of hospitalizations for
100 percent alcohol-attributed conditions from 2010 with nearly 40,000 hospital
admissions in 2017.
Table 8: Number and Rate* of 100 Percent Alcohol-Attributed Hospitalizations in
California, 2010-2017
Year All Alcohol-Attributable Chronic Causes Acute Causes
Number/Rate Number/Rate Number/Rate
2010 30,245/79.6 29,422/77.4 850/2.3
2011 30,704/79.7 29,861/77.5 888/2.3
2012 31,507/80.3 30,705/78.3 841/2.2
2013 31,455/79.4 30,633/77.3 867/2.2
2014 33,522/83.5 32,705/81.4 862/2.1
2015 35,597/87.1 34,823/85.2 797/2.0
2016 39,390/95.8 38,844/94.4 546/1.4
2017 39,649/95.6 39,050/94.2 599/1.5
* Age-adjusted rate per 100,000 residents
** Numbers differ slightly from published data (2010-2013) on the SACB EpiCenter because of the use of revised
codes for 100 percent alcohol attributed causes.
Source: ED Discharge Files, California Office of Statewide Health Planning and Development (OSHPD); prepared by:
SACB staff, May 2019.
Emergency Department Visits
Table 9 highlights the increasing magnitude of alcohol-related health consequences in
California. In 2017, there were nearly 130,000 ED visits for 100 percent
alcohol-attributed conditions. The age adjusted rate for these ED visits in 2017 was
319 ED visits per 100,000 residents.
18Table 9: Number and Rate* of 100 Percent Alcohol-Attributed ED Visits in California,
2010-2017
Year
Year All Alcohol-Attributable Number/Rate
All Alcohol-Attributable Chronic Causes Number/Rate
Chronic Causes Acute Causes Number/Rate
Acute Causes
Number/Rate Number/Rate Number/Rate
20102010 95,205/249.9
95,205/249.9 94,376/247.7
94,376/247.7 829/2.2 829/2.2
20112011 99,111/257.6
99,111/257.6 98,007/254.7
98,007/254.7 1,104/2.8 1,104/2.8
20122012 106,804/274.1
106,804/274.1 105,689/271.3
105,689/271.3 1,115/2.9 1,115/2.9
20132013 110,133/280.0
110,133/280.0 109,000/277.1
109,000/277.1 1,133/2.9 1,133/2.9
20142014 119,144/300.0
119,144/300.0 117,781/296.6
117,781/296.6 1,363/2.5 1,363/2.5
20152015 125,094/311.2
125,094/311.2 123,093/306.3
123,093/306.3 2,001/5.0 2,001/5.0
20162016 133,006/329.9
133,006/329.9 129,913/322.2
129,913/322.2 3,093/7.6 3,093/7.6
20172017 129,594/319.0
129,594/319.0 126,767/312.0
126,767/312.0 2,827/7.0 2,827/7.0
* Age-adjusted rate per 100,000 residents
** Numbers differ slightly from published data (2010-2013) on the SACB EpiCenter because of the use of revised
codes for 100 percent alcohol attributed causes.
Source: ED Discharge Files, OSHPD; prepared by: SACB staff, May 2019
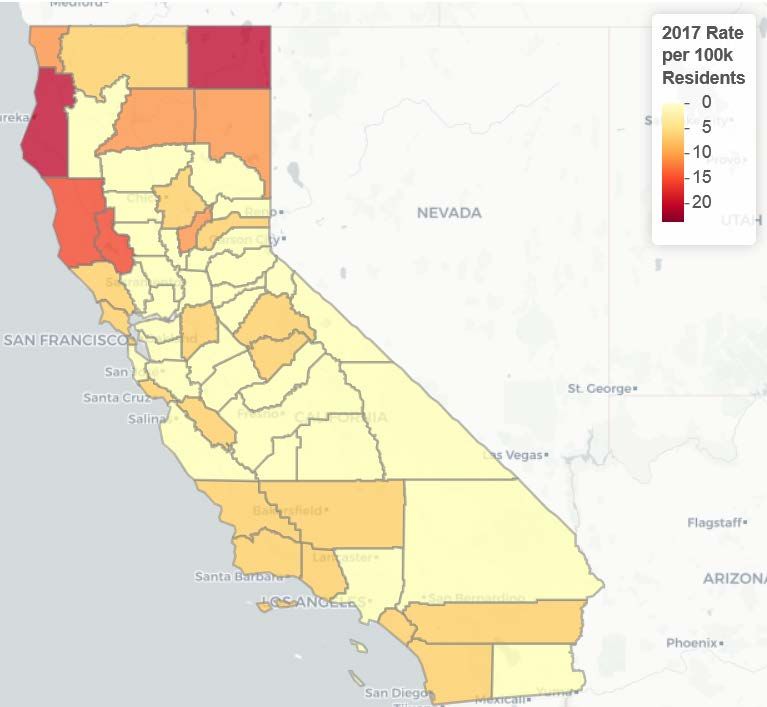
Drug-Related Health Consequences
Deaths
With approximately 2,200 opioid related overdose deaths in 2017 (over 50 percent
involving prescription opioids), another nearly 8,000 hospital and ED admissions, and
nearly 22 million opioid prescriptions written, California continues to face a serious
opioid, public health crisis having substantial health and economic impacts. Even
though California’s overall rates of opioid-related deaths and non-fatal overdoses are
lower than the national average, the absolute magnitude of the problem among
California’s nearly 40 million people is substantial. As shown in Figure 1, there is also
wide variation across counties with some county overdose rates higher than the national
average.
19You can also read