Waterloo South Planning Proposal - Economic development, local retail and services study
←
→
Page content transcription
If your browser does not render page correctly, please read the page content below
Waterloo South
Planning Proposal
Economic development, local retail and services
study
PREPARED FOR: Land and Housing Corporation (LAHC)

March 2020
Important Notice
© MacroPlan Holdings Pty Ltd All Rights Reserved. No part of this document may be reproduced, transmitted,
stored in a retrieval system, or translated into any language in any form by any means without the written
permission of MacroPlan Holdings Pty Ltd. All Rights Reserved. All methods, processes, commercial proposals
and other contents described in this document are the confidential intellectual property of MacroPlan Holdings
Pty Ltd and may not be used or disclosed to any party without the written permission of MacroPlan Holdings
Pty Ltd.

MacroPlan staff responsible for this report:
Ellis Davies, Principal - Retail
Nora Farren, Senior Consultant – Retail
Jack Collins, Analyst - Retail

Contact
Level 10
580 George Street
Sydney NSW 2000
(02) 9221 5211
info@macroplan.com.au
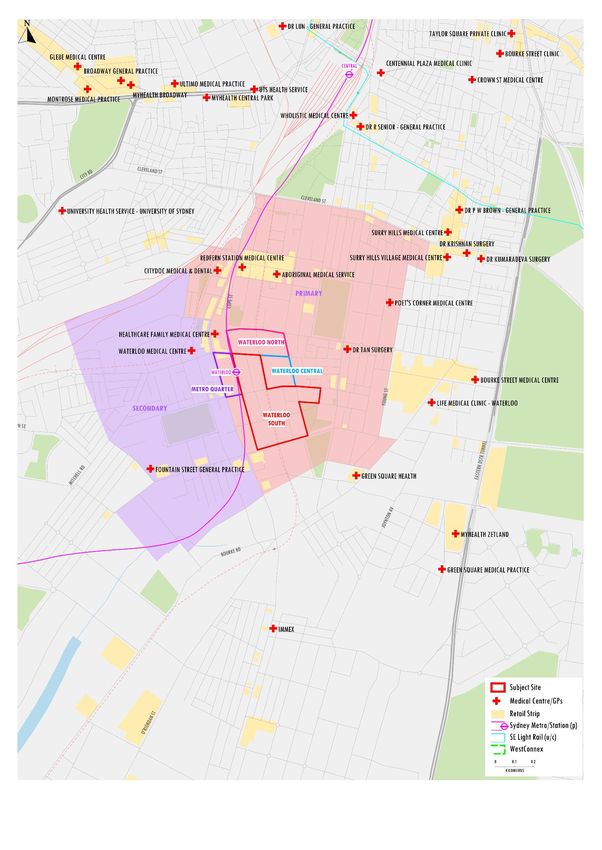
Table of contents

Executive summary ............................................................................................................................................ 5

Introduction ........................................................................................................................................................ 7

Section 1: Trade area analysis ..........................................................................................................................18

                1.1 Residential trade area ..............................................................................................................18

                1.1.1        Trade area definition ...........................................................................................................18

                1.1.2        Trade area population ........................................................................................................19

                1.2 Socio-demographic profile ........................................................................................................23

                1.3 Retail expenditure capacity ......................................................................................................25

                1.4 Retail floorspace demand .........................................................................................................29

                1.5 Workers and other customer segments ....................................................................................32

                1.5.1        Worker customer segment..................................................................................................32

                1.5.2        Other customer segments ..................................................................................................39

                1.6 Competition analysis ................................................................................................................39

                1.6.1        Retail centres/precincts ......................................................................................................39

                1.6.2        Other employment nodes/precincts ....................................................................................45

                1.6.3        Waterloo Metro Quarter ......................................................................................................46

                1.7 SWOT assessment ..................................................................................................................48

                1.7.1        Strengths ............................................................................................................................48

                1.7.2        Weaknesses .......................................................................................................................48

                1.7.3        Opportunities ......................................................................................................................48

                1.7.4        Threats ...............................................................................................................................49

                1.8 Retail allocations ......................................................................................................................50

                1.9 Other consideration/issues .......................................................................................................50

                1.9.1        Key issues/factors/risks ......................................................................................................51

                1.9.2        Market feasibility ..............................................................................................................53

                1.10 Recommended floorspace mix .................................................................................................53

Section 2: Implementation and approach ..........................................................................................................55

Section 3: Economic benefit assessment ..........................................................................................................57

Waterloo South                                                                                                                                                            c
Economic development, local retail and services study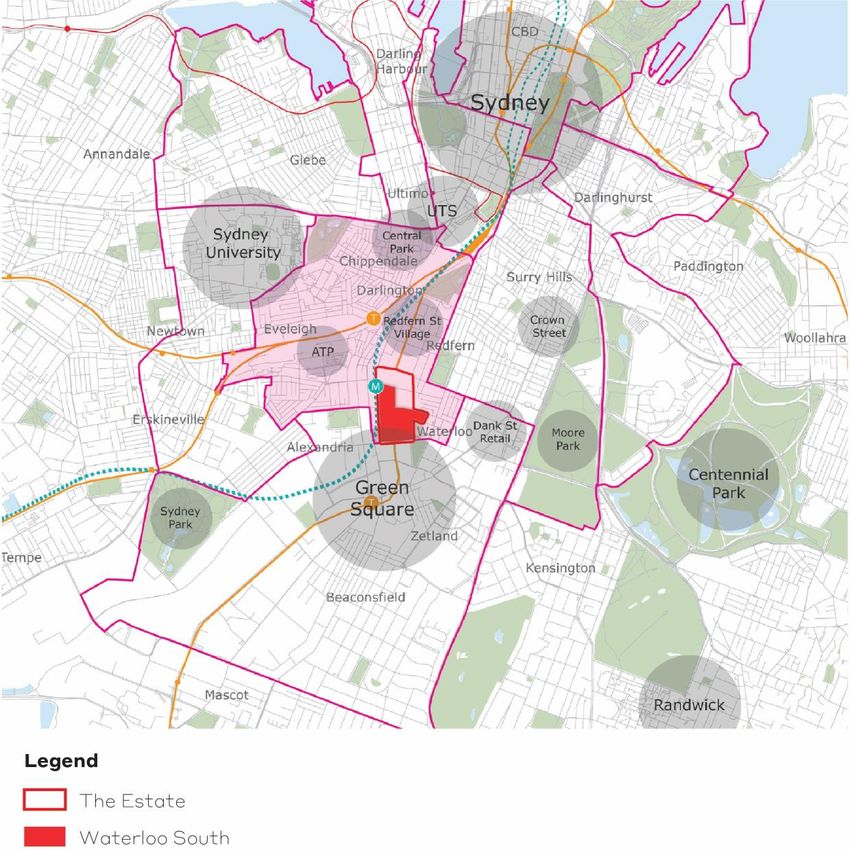
3.1 Wider economic benefits ..........................................................................................................57

               3.2 Other benefits ...........................................................................................................................57

Section 4: Assessment calibration ....................................................................................................................59

               4.1 Relevant considerations ...........................................................................................................59

               4.2 Case studies.............................................................................................................................60

Section 5: Conclusion .......................................................................................................................................62

Appendix A: Land use and economic context ...................................................................................................63

               A1.1 Sub-regional context ................................................................................................................63

               A1.2 Local context ............................................................................................................................63

               A1.3 Waterloo South proposed concept development ......................................................................64

               A1.4 Reference resources and documents .......................................................................................64

Appendix B: Economic profiling and employment analysis ...............................................................................67

               B1.1 Economic profiling and employment analysis ...........................................................................67

               B1.2 Industry composition: City of Sydney Employment Floorspace Survey ....................................67

               B1.3 Business growth and composition by industry and number of employees ...............................70

               B1.4 Employment composition and growth by industry ....................................................................73

               B1.5 Journey to work analysis ..........................................................................................................78

               B1.6 Business, community and social infrastructure.........................................................................81

               B1.7 Potential non-retail opportunities ..............................................................................................91

Appendix C: Wider economic benefits detailed methodology ...........................................................................92

Waterloo South                                                                                                                                                     d
Economic development, local retail and services study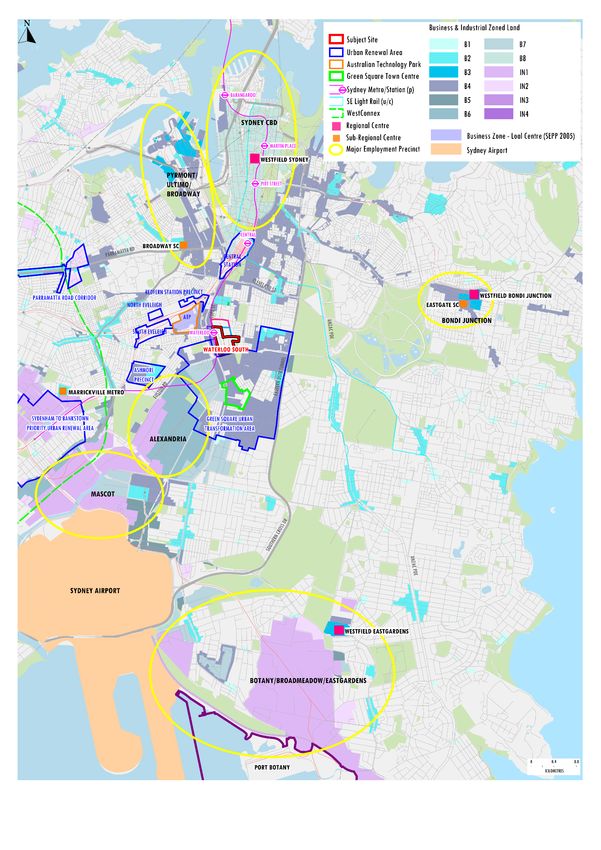
Executive summary
Macroplan has updated its report Waterloo Housing Estate (the Estate) State Significant Precinct (SSP) –
Economic, Retail and Services Study August 2019 to reflect the change in the planning approach for the Waterloo
Estate, from a state-led rezoning process (through a State Significant Precinct Study) to a council-led Planning
Proposal process. The updated report reflects the new metrics, narrative and preamble supplied by Turners, Ethos
Urban and LAHC.
Conditions determining the retail and non-retail facilities’ viability and development
The surrounding competition includes the existing and planned precincts around Redfern Street/Surry Hills to the
north/north-east; Green Square and East Village to the south/south-east; ATP/Alexandria to the west; and higher
order centres like the Broadway Shopping Centre, Central Park Mall, Sydney CBD, Westfield Bondi Junction,
Westfield Eastgardens and Marrickville Metro.
The trade area for Waterloo South has been defined, considering statistical boundaries, and the surrounding road
and rail network. The resident trade area population is expected to grow from an estimated 21,490 persons at mid-
2019 to 37,140 persons by 2036.
The customer profile and socio-demographics include a mix of working professionals and families, students and
social housing tenants. The worker trade area population is expected to grow from an estimated 17,940 persons
at June 2019 to over 33,000 persons by 2036. The worker population has higher average incomes than other
metropolitan areas, but lower average incomes than the Sydney CBD.
Per the information provided by LAHC, preliminary car parking volumes at Waterloo South for retail/community
uses have been allocated at 190 parking spaces (based on a GFA of 17,900 sq.m). It is recommended these car
spaces be located adjacent to the proposed supermarket space.
Opportunities and needs to support the precinct
The retail and ancillary non-retail offer at Waterloo South should meet the needs of local residents and workers;
both existing and future; but potentially also draw people in from across the broader region through uses that
activate the precinct in the evenings and on weekends – noting the new Metro Station will help to facilitate
movements for 18+ hours a day. The local community is diverse and consists of young working professionals,
Aboriginal peoples, persons in social housing, students and other workers, thus the mix of retail and services
should consist of a range of uses that cater to this diverse community.
Our analysis and recommendations for retail floorspace provision at other high density residential locations
across metropolitan Sydney has been considered as part of a benchmarking analysis. Potts Point/Macleay
Street accommodates around 10,000–15,000 sq.m of retail/commercial GLA (excluding Kings Cross);
Wentworth Point which has 7,000 dwellings at present accommodates around 17,000–18,000 sq.m of
retail/commercial GLA; and Wolli Creek which contains around 20,000 sq.m of retail/commercial GLA.
Waterloo South 5
Economic development, local retail and services study
The potential scale and composition of retail and ancillary non-retail uses is detailed in Table 1.12 below. A total
of 17,900 sq.m of retail, community/cultural GFA is proposed under the Waterloo South masterplan. This
is based on there being 190 car-parking spaces dedicated to or adjoining the proposed supermarket in Waterloo
South (total recommended major floorspace GFA is 3,800 sq.m).

                                                               Table 1.12
               Waterloo South - potential scale and composition, retail & ancillary non-retail GFA, by category

     Category                                     (sq.m)      Tenant examples

     RETAIL

     Major tenants
     Supermarket and liquor                        3,800      Woolworths, Coles, BWS, Liquorland
     Total majors                                  3,800
     Mini-majors
     Fresh food                                         400   Flannerys, Taste Growers
     Other                                              400   Chemist Warehouse, Officeworks
     Total mini-majors                                  800

     Other - retail specialties
     Fresh food                                         800   Sonoma Bakery, Pryde Meats, Costis, local Chicken/Deli
     Food catering/F&B                             2,000      Betty's Burgers, Belle's Chicken, Pattisons, Pasta Pantry, Schnitz
     Household                                          350   Local gifts, homewares
     Leisure                                            450   Bookface, WH Smith, local news
     General                                            750   Priceline, Fone King, Zap Variety, Kidstuff, Pearsons
     Retail services                                    250   Local operators, Dresden Optics, Maurice DCs.
     Total retail specialties                      4,600
     Other - non-retail
     Banks, insurance, travel etc.                      800   Big 4 bank/s, Bendigo, local travel, Yellow Brick Rd.
     Allied/Community Health                       1,200      My Health, Osana Medical, local ancillary
     Total non-retail                              2,000

     Total - retail                              11,200

     COMMUNITY FACILITIES
     Child care                                    1,200      Big Fat Smile, Little Zacs, Only About Children
     Library                                            500   Council
     Community centre                                   800   Community centre, health, arts, child care
     Activity centre                                    500
     Creative arts centre                               750
     Creative spaces                                    150
     Satellite health                                   100
     Multi-purpose Indoor Rec (Youth)              1,200
     Total - Community                            5,200
     CULTURAL
     Learning/Cultural/Wellbeing                   1,500
     Total - Cultural                             1,500
     TOTAL                                      17,900

     Source: macroplan

Waterloo South                                                                                                                     6
Economic development, local retail and services study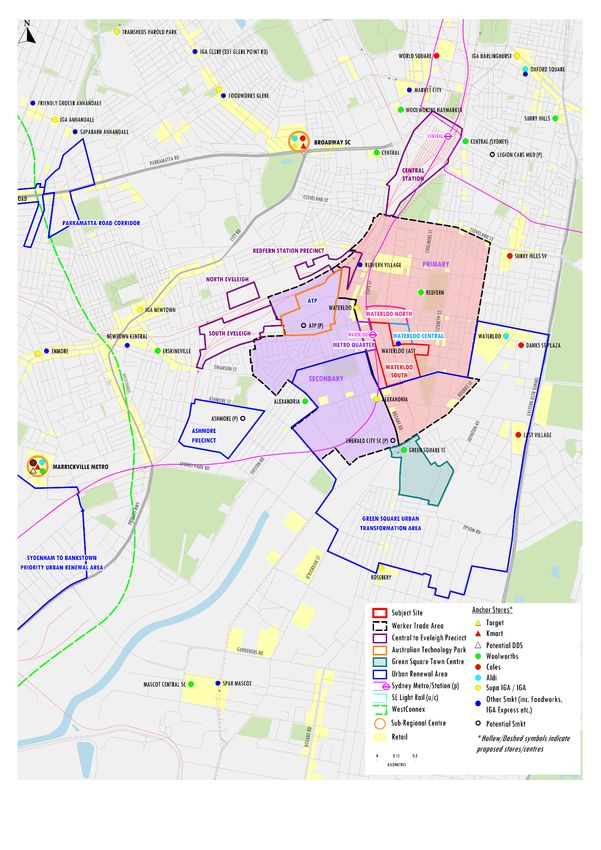
Introduction
The Greater Sydney Region Plan and Eastern City District Plan seek to realign growth with infrastructure, including
transport, social and green infrastructure. With the catalyst of Waterloo Metro Station, there is an opportunity to
deliver urban renewal to Waterloo Estate that will create great spaces and places for people to live, work and visit.
The proposed rezoning of Waterloo Estate is to be staged over the next 20 years to enable a coordinated renewal
approach that minimises disruption for existing tenants and allows for the up-front delivery of key public domain
elements such as public open space. Aligned to this staged approach, Waterloo Estate comprises three separate,
but adjoining and inter-related stages:
Waterloo South;
Waterloo Central; and
Waterloo North.
Waterloo South has been identified as the first stage for renewal. The lower number and density of social housing
dwellings spread over a relatively large area, makes Waterloo South ideal as a first sub-precinct, as new housing
can be provided with the least disruption for existing tenants and early delivery of key public domain elements,
such as public open space.
A Planning Proposal for Waterloo South is being led by NSW Land and Housing Corporation (LAHC). This will set
out the strategic justification for the proposal and provide an assessment of the relevant strategic plans, state
environmental planning policies, ministerial directions and the environmental, social and economic impacts of the
proposed amendment. The outcome of this Planning Proposal will be a revised planning framework that will enable
future development applications for the redevelopment of Waterloo South. The proposed planning framework that
is subject to this Planning Proposal includes:
Amendments to the Sydney Local Environmental Plan 2012 – this will include amendments to the zoning
and development standards (i.e. maximum building heights and floorspace ratio) applied to Waterloo South.
Precinct-specific local provisions may also be included.
A Development Control Plan (DCP) – this will be a new part inserted into ‘Section 5: Specific Areas’ of the
Sydney DCP 2012 and include detailed controls to inform future development of Waterloo South.
An infrastructure framework – in depth needs analysis of the infrastructure required to service the needs of
the future community including open space, community facilities and servicing infrastructure.
Waterloo Estate
Waterloo Estate is located approximately 3.3 kilometres south-south-west of the Sydney CBD in the suburb of
Waterloo (refer to Figure 1). It is located entirely within the City of Sydney local government area (LGA). Waterloo
Waterloo South 7
Economic development, local retail and services study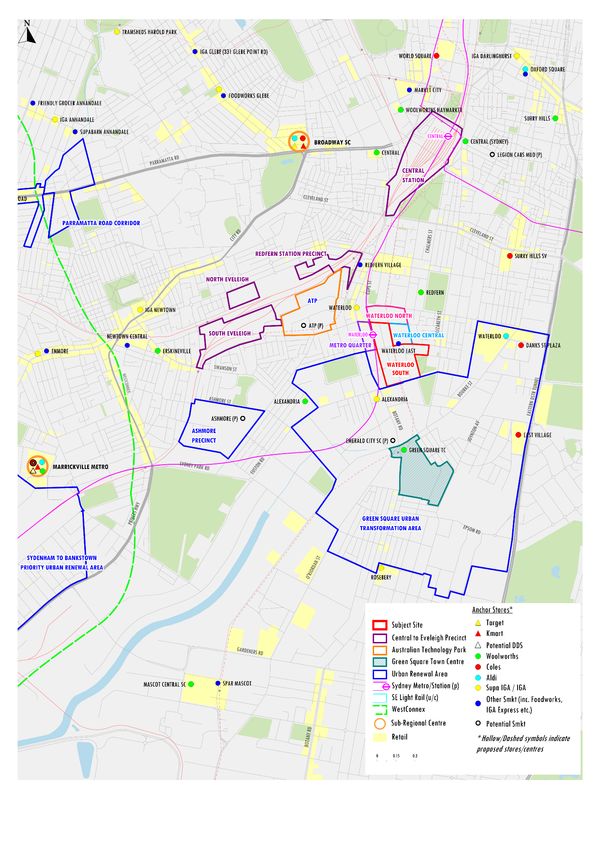
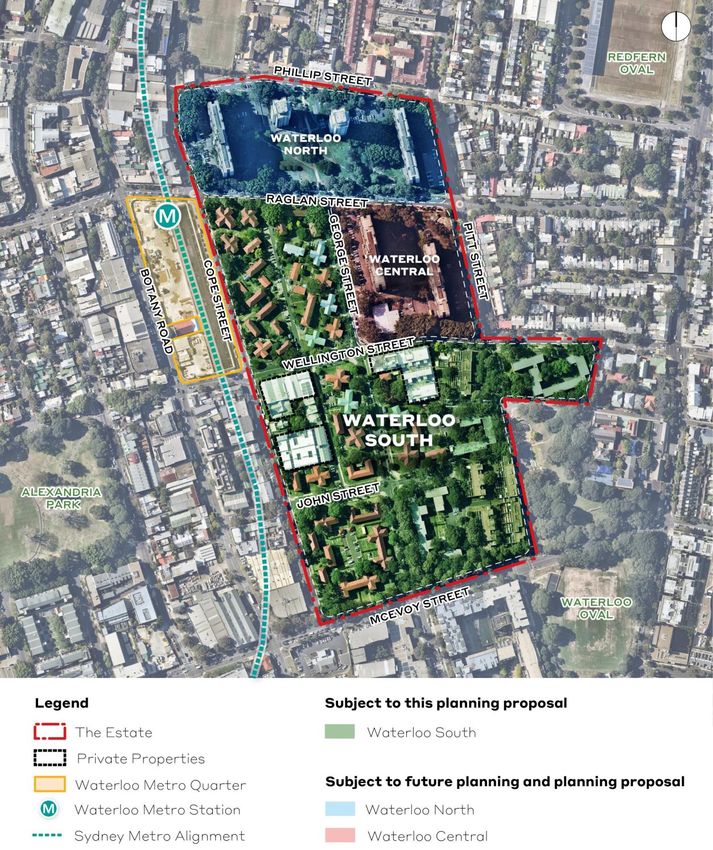
Estate is situated approximately 0.6 kilometres from Redfern train station and 0.5 kilometres from the Australian
Technology Park. The precinct adjoins the new Waterloo Metro Station, scheduled to open in 2024. The Waterloo
Metro Quarter adjoins the Waterloo Estate and includes the station and over station development and was rezoned
in 2019. Waterloo Estate comprises land bounded by Cope, Phillip, Pitt and McEvoy Street, including an additional
area bounded by Wellington, Gibson, Kellick and Pitt Streets. It has an approximate gross site area of 18.98
hectares (14.4 hectares excluding roads). Waterloo Estate currently comprises 2,012 social housing dwellings
owned by LAHC, 125 private dwellings, a small group of shops and community uses on the corner of Wellington
and George Streets, and commercial properties on the south-east corner of Cope and Wellington Streets. A map
of Waterloo Estate and relevant boundaries is illustrated in Figure 2.

Waterloo South

Waterloo South includes land bounded by Cope, Raglan, George, Wellington, Gibson, Kellick, Pitt and McEvoy
Streets and has an approximate gross site area of 12.32 hectares (approximately 65% of the total Estate). Waterloo
South currently comprises 749 social housing dwellings owned by LAHC, 125 private dwellings and commercial
properties on the south-east corner of Cope and Wellington Streets. Existing social housing within Waterloo South
is predominantly walk-up flat buildings constructed in the 1950s and 60s and mid-rise residential flat buildings
(Drysdale, Dobell and 76 Wellington Street) constructed in the 1980s. Listed Heritage items within Waterloo South
include the Duke of Wellington Hotel, Electricity Substation 174 on the corner of George and McEvoy Streets, the
terrace houses at 229-231 Cope Street and the former Waterloo Pre-School at 225-227 Cope Street. The State
Heritage listed “Potts Hill to Waterloo Pressure Tunnel and Shafts’ passes underneath the precinct. A map of
Waterloo South and relevant boundaries is illustrated in Figure 2.

Waterloo South                                                                                                   8
Economic development, local retail and services study
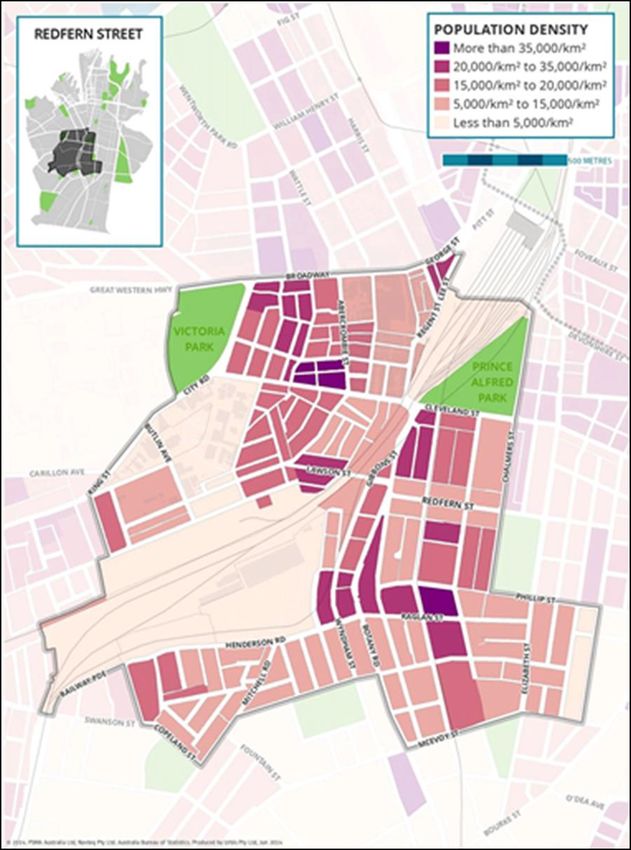
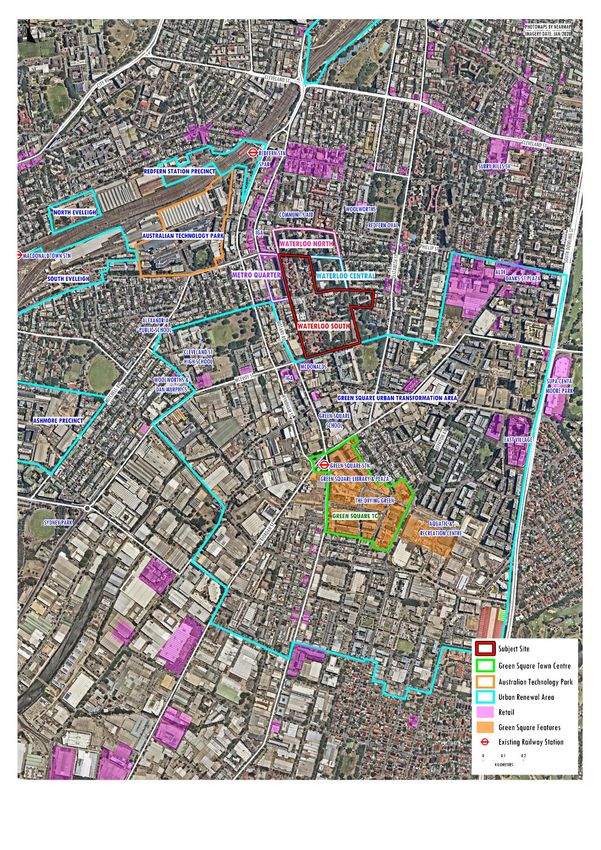
Figure 1 - Location plan of Waterloo Estate and Waterloo South
Source: Turner Studio

Waterloo South                                                   9
Economic development, local retail and services study
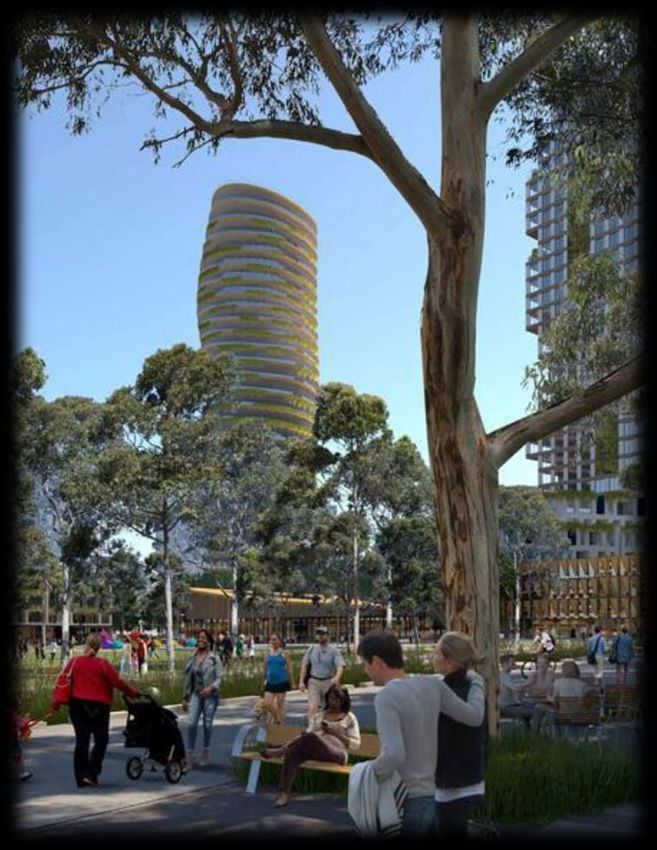
Figure 2 – Waterloo Precinct
Source: Ethos Urban

Waterloo South                                          10
Economic development, local retail and services study
Renewal vision

The transition of Waterloo Estate will occur over a 20-year timeframe, replacing and providing fit for
purpose social (affordable rental) housing, as well as private housing to create a new integrated and
inclusive mixed-tenure community. This aligns with Future Directions for Social Housing in NSW – the NSW
Government’s vision for social housing. It also aligns with LAHC’s Communities Plus program, which is tasked
with achieving three key objectives:
     1.    Provide more social housing
     2.    Provide a better social housing experience
     3.    Provide more opportunities and support for social housing tenants

The following is LAHC’s Redevelopment Vision for Waterloo Estate, which was derived from extensive consultation
and technical studies:
Source: Let’s Talk Waterloo: Waterloo Redevelopment (Elton Consulting, 2019)
                  Culture and Heritage
                  •   Recognise and celebrate the significance of Waterloo’s Aboriginal history and heritage across the built and natural
                      environments.
                  •   Make Waterloo an affordable place for more Aboriginal people to live and work.
                  •   Foster connection to culture by supporting authentic storytelling and recognition of artistic, cultural and sporting
                      achievements.

                  Communal and Open Space
                  •  Create high quality, accessible and safe open spaces that connect people to nature and cater to different needs,
                     purposes and age groups.
                  •  Create open spaces that bring people together and contribute to community cohesion and wellbeing.

                  Movement and Connectivity
                  •  Make public transport, walking and cycling the preferred choice with accessible, reliable and safe connections and
                     amenities.
                  •  Make Waterloo a desired destination with the new Waterloo Station at the heart of the Precinct’s transport network –
                     serving as the gateway to a welcoming, safe and active community.

                  Character of Waterloo
                  •   Strengthen the diversity, inclusiveness and community spirit of Waterloo.
                  •   Reflect the current character of Waterloo in the new built environment by mixing old and new.

                  Local Employment Opportunities
                  •   Encourage a broad mix of businesses and social enterprise in the area that provides choice for residents and creates
                      local job opportunities.

                  Community Services, Including Support for Those Who Are Vulnerable
                  •  Ensure that social and human services support an increased population and meet the diverse needs of the
                     community, including the most vulnerable residents.
                  •  Provide flexible communal spaces to support cultural events, festivals and activities that strengthen community spirit.

                  Accessible Services
                  •   Deliver improved and affordable services that support the everyday needs of the community, such as health and
                      wellbeing, grocery and retail options.

                  Design Excellence
                  •   Ensure architectural design excellence so that buildings and surrounds reflect community diversity, are
                      environmentally sustainable & people friendly – contributing to lively, attractive and safe neighbourhoods.
                  •   Recognise and celebrate Waterloo’s history and culture in the built environment through artistic and
                      creative expression.
                  •   Create an integrated, inclusive community where existing residents and newcomers feel welcome, through
                      a thoughtfully designed mix of private, and social (affordable rental) housing.

Waterloo South                                                                                                             11
Economic development, local retail and services study
Purpose of this report
This report relates to the Waterloo South Planning Proposal. While it provides comprehensive baseline
investigations for Waterloo Estate, it only assesses the proposed planning framework amendments and indicative
Concept Proposal for Waterloo South.
The key matters addressed as part of this study include:
The scope of works to be undertaken by macroplan, having regard to the research brief provided to us, is to update
our report dated August 2019 to reflect new metrics, narrative and preamble to be supplied by Turners, Ethos
Urban and LAHC. The output of the study will be a detailed report, addressing all the items outlined above,
incorporating key tables, charts, maps and commentary.
The original report addressed the following study requirements:
Study requirements/planning proposal Addressed at
Prepare and analyse the local economic and employment
Section 1.1, 1.2, 1.5 and Section B1
profile for the precinct and local area
Analyse the economic development, local employment and
local retail and services needs to support the development and
economic sustainability of the precinct, ensuring a highly Section 1.1, 1.8, 1.9
walkable precinct with a high degree of containment, its future
community and relevant local and regional centres.
Identify the quantum of floorspace required to support economic
Section 1.4
development, local retail and services provision.
Develop a strategy to deliver strategically important uses
through market delivery combined with targeted interventions Section 1.9 and Section 2
where market delivery will not satisfy identified needs.
Identify appropriate locations for active retail frontages to
provide community services to facilitate current and future Section 1.8, 1.9 and Section B1
needs.
Consider the role of the precinct in terms of employment, retail,
local services and other economic generating land uses within
the local and regional context. This will include nearby local Section 1.6
centres, Green Square Town Centre, Central Sydney and
Australian Technology Park.
Consider local employment and business needs and
opportunities to support the existing and future community,
Section 1 and Section 2
including a specific focus on Aboriginal and Torres Strait
Islander communities.
Identify measures to ensure the development of the precinct
meets the economic development, local employment and local
retail and service needs of the community and supports the
Section 1.1-1.5, Section 2 and Appendix B
economic development of neighbouring centres. This is to
consider the different service, business and employment needs
of groups within the community.
Provide recommendations to inform planning controls on the
quantum of retail, service and employment floorspace needed Section 3
to meet the needs of the vision objectives of the project.
Waterloo South 12
Economic development, local retail and services studyWaterloo South Planning Proposal
The Planning Proposal will establish new land use planning controls for Waterloo South, including zoning and
development standards to be included in Sydney LEP 2012, a new section in Part 5 of DCP 2012 and an
infrastructure framework. Turner Studio and Turf has prepared an Urban Design and Public Domain Study which
establishes an Indicative Concept Proposal presenting an indicative renewal outcome for Waterloo South. The
Urban Design and Public Domain Study provides a comprehensive urban design vision and strategy to guide future
development of Waterloo South and has informed the proposed planning framework. The Indicative Concept
Proposal has also been used as the basis for testing, understanding and communicating the potential development
outcomes of the proposed planning framework.
The indicative Concept Proposal comprises:
• Approximately 2.57 hectares of public open space representing 17.8% of the total Estate (Gross Estate area –
existing roads) proposed to be dedicated to the City of Sydney Council) comprising:
- Village Green – a 2.25 hectare park located next to the Waterloo Metro Station; and
- Waterloo Common and adjacent – 0.32 hectares located in the heart of the Waterloo South
precinct.
- The 2.57 hectares all fall within the Waterloo South Planning Proposal representing 32.3% of
public open space (Gross Waterloo South area – proposed roads)
• Retention of 52% of existing high and moderate value trees (including existing fig trees) and the planting of
three trees to replace each high and moderate value tree removed.
• Coverage of 30% of Waterloo South by tree canopy.
• Approximately 257,000 sq.m of GFA on the LAHC land comprising:
- Approximately 239,100 sq.m GFA of residential accommodation, providing for approximately
3,048 dwellings comprising a mix of market and social (affordable rental) housing dwellings;
- Approximately 11,200 sq.m GFA for commercial premises, including but not limited to,
supermarkets, shops, food & drink premises and health facilities; and
- Approximately 6,700 sq.m of community facilities and early education and child care facilities.
The key features of the Indicative Concept Proposal are:
It is a design and open space led approach.
Creation of two large parks of high amenity by ensuring good sunlight access.
Creation of a pedestrian priority precinct with new open spaces and a network of roads, lanes and pedestrian
links.
Waterloo South 13
Economic development, local retail and services study Conversion of George Street into a landscaped pedestrian and cycle friendly boulevard and creation of a
walkable loop designed to cater to the needs of all ages.
A new local retail hub located centrally within Waterloo South to serve the needs of the local community.
A target of 80% of dwellings to have local retail services and open space within 200 metres of their building
entry.
Achievement of a 6-Star Green Star Communities rating, with minimum 5-star Green Star Design & As-Built
(Design Review certified).
A range of Water Sensitive Urban Design (WSUD) features.
The proposed land allocation for the Waterloo South precinct is described in Table 1, the Indicative Concept
Proposal for Waterloo South is illustrated in Figure 3 and the indicative location of retail, community/cultural uses
are illustrated in Figure 4 and Figure 5.
Table 1 – Breakdown of allocation of land within Waterloo South
Land allocation Existing Proposed
Roads 3.12ha / 25.3% 4.38ha / 35.5%
Developed area (Private sites) 0.86ha / 6.98% 0.86ha / 7%
Developed area (LAHC property) 8.28ha / 67.2% 4.26ha / 34.6%
Public open space Nil / 0% 2.57ha / 20.9% (32.3%
(proposed to be dedicated to the City of Sydney) excluding roads)
Other publicly accessible open space 0.06ha / 0.5% 0.25ha / 2%
(Including former roads and private/LAHC land)
TOTAL 12.32ha 12.32ha
Waterloo South 14
Economic development, local retail and services studyFigure 3 – Indicative Concept Proposal Source: Turner studio Waterloo South 15 Economic development, local retail and services study
Figure 4 – Indicative retail uses diagram

Waterloo South                                          16
Economic development, local retail and services study
Figure 5 – Indicative community/cultural uses diagram

Waterloo South                                          17
Economic development, local retail and services study
Section 1: Trade area analysis
1.1 Residential trade area
This section of the report examines the potential residential trade area that could be served by retail and ancillary
non-retail facilities at Waterloo South, then examines the size and growth of the residential population of this trade
area; its socio-demographic profile; and the size and growth of retail expenditure and floorspace demand generated
by this residential population.
1.1.1 Trade area definition
The extent of the trade area or catchment that is served by any shopping centre or retail offer, is shaped by the
interplay of several critical factors including:
i. The relative attraction of the retail offer or centre, in comparison with alternative competitive retail facilities.
The factors that determine the strength and attraction of any particular centre are primarily its scale and
composition (in particular the major trader or traders that anchor the centre); its layout and ambience; and
car-parking, including access and ease of use.
ii. The proximity and attractiveness of competitive retail precincts or centres. The locations, compositions, quality
and scale of competitive retail facilities all serve to define the extent of the trade area which a shopping centre
or retail facility is effectively able to serve.
iii. The available road network and public transport infrastructure, which determine the ease (or difficulty) with
which customers can access a shopping centre, or retail facility.
iv. Significant physical barriers which are difficult to negotiate and can act as delineating boundaries to the trade
area served by an individual shopping centre, or retail facility.
Map 1.1 illustrates the extent of the residential trade area that could potentially be served by retail and ancillary
non-retail facilities at Waterloo South. In forming our view on this trade area, we have had regard to the following:
The high-density nature of the proposed redevelopment of the precinct;
The surrounding competitive supermarket facilities (including future proposed facilities) in Surry Hills, Danks
Street, East Village, Green Square, and Alexandria;
The surrounding network of higher order retail facilities, such as Broadway Shopping Centre, the Sydney CBD,
Westfield Bondi Junction, Westfield East Gardens, and Marrickville Metro etc;
The expected household composition of residents (e.g. lower than average car-ownership);
The surrounding road and rail network; and
Waterloo South 18
Economic development, local retail and services study Statistical boundaries, from which detailed data can be aggregated. This is part of the reason why the trade
area is split along Botany Road/Regent Street.
The trade area has been defined to include one primary sector and one secondary sector described as follows and
is referred to as the residential main trade area in the remainder of this report:
The primary sector includes the Waterloo Metro Quarter site and extends north to Cleveland Street, west to
Botany Road/Regent Street, south to Allen Street/Powell Street, and east to Young Street, including parts of
Redfern, Waterloo and Alexandria.
The secondary sector extends west of the subject site to around Bowden Street/Fountain Street/Brandling
Street, north to the T2/T3/T4 Sydney suburban rail line, and south to Mandible Street including parts of
Alexandria and the ATP.
1.1.2 Trade area population
Table 1.1 details the current and projected population levels within the residential main trade area. This information
has been collected from a range of sources, including the following:
ABS Census of Population and Housing (2016);
ABS Dwelling Approvals Data (2016 - 2019);
ABS Estimated Residential Population Data (ERP) (2017 - 18);
NSW Transport Performance and Analytics (TPA) population projections – small area;
.id population projections for Waterloo South (prepared for LAHC);
LAHC (information provided in relation to forecast residential population and likely timing/take-up within the
site); and
Other investigations of future residential development undertaken by this office
Waterloo South 19
Economic development, local retail and services studyMap 1.1: Waterloo South
Resident trade area and competition
Waterloo South 20
Economic development, local retail and services studyThe residential main trade area population is estimated at around 21,490 persons as at mid-2019, including 16,540
people in key primary sector. Over the past three years, the trade area population has grown by around 3.1% per
annum, or around 620 persons per annum.
There are currently around 2,012 social housing dwellings within the Waterloo precinct, including 749 existing
within Waterloo South. Population growth within the defined main trade area will essentially be driven by the future
growth within the precinct itself. Waterloo South will provide 3,048 dwellings, comprising 748 social dwellings
(25%) and 2,300 private dwellings (75%).
Other significant housing development projects located within the residential main trade area include:
Waterloo Metro Quarter – expected to accommodate around 700 new private, social and affordable dwellings;
Lawson Square – located within the primary trade area on the block of Regent Street, Redfern Street, Gibbons
Street and Lawson Square. The development will comprise two mixed-use towers including 156 residential
units (stage 1 is complete);
Iglu Student Accommodation Redfern – a new tower at 80-88 Regent Street (adjoining the recently completed
facility at 66 Regent Street) will accommodate 265 students in a range of studio and shared apartments located
over 16 floors;
11 Gibbons Street – The Future Living Consortium (former council depot) is part of a scheme to develop social
and affordable housing under an agreement with City of Sydney Council. Approximately 160 units will be
developed;
Wee Hur Student Housing Redfern – construction of an 18-storey building at 90-102 Regent Street,
accommodating approximately 407 bed student housing.
Having regard for the above, the residential main trade area population is estimated to grow at an average annual
rate of 3.3% to reach 37,140 by 2036, an increase of 73% over the current population.
The primary sector population (which forms most of the residential main trade area) is estimated to increase by
87% by 2036 to reach 30,990 people, equivalent to average annual growth of 3.8%.
Waterloo South 21
Economic development, local retail and services studyTable 1.1
Waterloo South trade area population, 2011-2036*
Estimated population Forecast population
Trade area sector 2011 2016 2019 2021 2026 2031 2036
Primary 13,210 15,040 16,540 17,740 22,490 26,740 30,990
Secondary 3,770 4,590 4,950 5,150 5,650 5,900 6,150
Main trade area 16,980 19,630 21,490 22,890 28,140 32,640 37,140
Average annual growth (no.)
Trade area sector 2011-16 2016-19 2019-21 2021-26 2026-31 2031-36
Primary 366 500 600 950 850 850
Secondary 164 120 100 100 50 50
Main trade area 530 620 700 1,050 900 900
Average annual growth (%)
Trade area sector 2011-16 2016-19 2019-21 2021-26 2026-31 2031-36
Primary 2.6% 3.2% 3.6% 4.9% 3.5% 3.0%
Secondary 4.0% 2.5% 2.0% 1.9% 0.9% 0.8%
Main trade area 2.9% 3.1% 3.2% 4.2% 3.0% 2.6%
*As at June
Source: ABS Census 2016; NSW Department of Planning and Environment 2016; Forecast.id; macroplan
Waterloo South 22
Economic development, local retail and services study1.2 Socio-demographic profile
Table 1.2 details the socio-demographic profile of the residential main trade area population, compared with the
benchmarks for metropolitan Sydney, sourced from the 2016 ABS Census of Population and Housing. The key
points to note regarding the characteristics of the residential main trade area population includes the following:
The average per capita income of the main trade area population is around 17% above the metropolitan Sydney
average however, because the average household size is much smaller than average (1.8 versus 2.7 persons
per household) the average per household income of the main trade area population is around 21% below
average. The secondary sector population is quite affluent, with average per capita (63%) and per household
(24%) significantly above average.
Around 45% of main trade area residents, and 55% of secondary sector residents are aged 20-39 years (versus
the Sydney average of around 30%). There is a relatively low proportion of children and teenagers (10%)
compared to a Sydney average of 25%, and a high proportion of persons aged above 60 years, particularly in
the primary sector (23%) compared to a Sydney average of 19%.
There is an exceptionally high proportion of rental households across the main trade area, with more than 70%
of households renting as at June 2016. This is driven by a 77% share in the primary sector. Home ownership
levels in the secondary sector are much higher (45%) than the primary sector, but still well below the
metropolitan Sydney average (64%). This share has fallen since the 2011 ABS Census.
The proportion of Australian born residents (54%) across the main trade area is below the metropolitan Sydney
average of 61%. There is a high proportion of European born residents across the main trade area generally,
with around 17% of the primary sector population European born.
Given the social housing and high-density nature of the trade area, with many single and double bedroom
apartments, the proportion of lone person households across the main trade (30%) is significantly above the
metropolitan Sydney average at 9%. In the primary sector this proportion is higher again at 34%.
The proportion of ‘typical family’ households (i.e. couples with dependent children) is very low (18%) compared
with the Sydney average of 49%. On the other hand, the proportion of couples with no children (i.e.
predominantly working professionals) is much higher, at 34% compared with the Sydney average of 20%.
The share of households with zero car ownership in the main trade is around 11% which is identical to the
Sydney average. The share within the primary sector is around 20%.
Waterloo South 23
Economic development, local retail and services studyTable 1.2
Waterloo South main trade area - socio-demographic profile, 2016
Primary Secondary Main Syd Metro Aust.
Census item sector sector TA avg. avg.
Per capita income $46,628 $73,628 $52,939 $45,173 $39,800
Var. from Syd Metro bmark 3.2% 63.0% 17.2%
Avg. household income $83,428 $153,069 $97,917 $123,654 $101,610
Var. from Syd Metro bmark -32.5% 23.8% -20.8%
Avg. household size 1.8 2.1 1.8 2.7 2.6
Age distribution (% of population)
Aged 0-14 6.7% 9.4% 7.4% 18.7% 18.7%
Aged 15-19 2.7% 2.1% 2.6% 6.0% 6.1%
Aged 20-29 21.5% 26.2% 22.6% 15.0% 13.8%
Aged 30-39 20.0% 28.5% 22.0% 15.5% 14.0%
Aged 40-49 13.0% 15.0% 13.5% 13.7% 13.5%
Aged 50-59 12.7% 9.3% 11.9% 12.2% 12.7%
Aged 60+ 23.3% 9.6% 20.1% 18.9% 21.1%
Average age 42.5 35.7 40.9 37.5 38.6
Housing status (% of households)
Owner (total) 22.4% 45.2% 27.2% 64.2% 67.4%
• Owner (outright) 7.5% 11.4% 8.3% 30.0% 31.9%
• Owner (with mortgage) 14.9% 33.9% 18.8% 34.2% 35.5%
Renter 76.6% 54.6% 72.0% 35.1% 31.8%
Birthplace (% of population)
Australian born 50.9% 62.2% 53.6% 60.9% 71.9%
Overseas born 49.1% 37.8% 46.4% 39.1% 28.1%
• Asia 19.4% 12.3% 17.8% 19.1% 11.2%
• Europe 16.8% 14.1% 16.2% 9.6% 9.6%
• Other 12.9% 11.3% 12.5% 10.4% 7.4%
Family type (% of population)
Couple with dep't child. 15.2% 26.6% 17.6% 48.5% 44.8%
Couple with non-dep't child. 2.4% 2.4% 2.4% 9.1% 7.7%
Couple without child. 31.8% 43.2% 34.2% 20.1% 22.8%
One parent with dep't child. 8.5% 5.5% 7.9% 7.9% 8.8%
One parent w non-dep't child. 5.8% 2.7% 5.1% 4.1% 3.7%
Lone person 33.6% 18.0% 30.4% 9.2% 11.0%
Car ownership
% 0 Cars 9.3% 20.3% 11.6% 11.4% 7.7%
% 1 Car 33.7% 42.2% 35.4% 38.5% 36.1%
% 2 Cars 37.5% 28.5% 35.6% 34.0% 37.5%
% 3 Cars 13.1% 6.9% 11.8% 10.5% 12.2%
% 4 plus Cars 6.4% 2.0% 5.5% 5.7% 6.5%
Source: ABS Census of Population & Housing, 2016; macroplan
Waterloo South 24
Economic development, local retail and services study1.3 Retail expenditure capacity
The estimated retail expenditure capacity of the study area population is sourced from MarketInfo, which is
developed by Market Data Systems (MDS) and utilises a detailed micro simulation model of household expenditure
behaviour for all residents of Australia. The model takes into account information from a wide variety of sources
including the regular ABS Household Expenditure Surveys, national accounts data, Census data and other
information. The MarketInfo estimates for spending behaviour prepared independently by MDS are used by a
majority of retail/property consultants.
Total retail expenditure is allocated in a number of categories, as follows:
Take-home food and groceries – goods typically sold in supermarkets and specialty fresh food stores.
Packaged liquor – liquor purchased at bottle-shops to take home.
Food catering – cafes, take-away outlets and restaurants.
Apparel – clothing, footwear, fashion and accessories.
Household goods – giftware, electrical, computers, furniture and homewares.
Leisure – newsagents, sporting goods, music, games and books.
General retail – pharmaceutical goods, cosmetics, toys, florists and mobile phones.
Retail services – key cutting, shoe repairs, hair and beauty.
Chart 1.1 illustrates the per capita retail expenditure of the residential main trade area population in 2018/19
compared with the benchmarks for metropolitan Sydney and Australia. The level of retail expenditure per person
for the Waterloo South main trade area population is estimated at $16,613. All expenditure figures presented in
this report are expressed inclusive of GST. We note the following:
Estimated per capita retail expenditure across the main trade area is 11% above the average for metropolitan
Sydney;
Estimated per capita expenditure on food is around 16% above average across the main trade area, and around
5% above average for non-food;
Estimated per capita expenditure on F&B/food catering is 32% above average, which is reflective of the high
proportion of 20–39 year olds, and relatively affluent nature of the population broadly across the main trade
area. We note that the social housing tenants represent only a fraction (10–15%) of the total population across
the main trade area; and
Per capita spending by trade area residents is above the metropolitan Sydney average for all retail categories
with the exception of fresh food (-0.5%) and general retail (-4.2%). Spending is highest above average for food
catering (32.5%) packaged liquor and retail services (both 26.2%) and leisure (25.6%).
Waterloo South 25
Economic development, local retail and services studyChart 1.1
Waterloo South main trade area - retail expenditure per person, 2018/19*
Total retail
$18,000 16,586
$16,000 14,925
14,317
Waterloo South MTA Syd Metro Aust. Avg.
$14,000
$12,000
9,960
$10,000 8,607 8,198
$8,000 6,626 6,318 6,119
$6,000
$4,000
$2,000
$0
Total Food Total Non-food Total Retail
Food
$4,000 3,683 Waterloo South MTA Syd Metro Aust. Avg.
$3,500 3,248 3,331
2,996
$3,000
2,304 2,317 2,282 2,267
$2,500
$2,000 1,801
$1,500
976
$1,000 775 784
$500
$0
Fresh Food Other Food & Groceries Packaged Liquor Food Catering
Non-food
$3,000
2,579
2,541 2,552
$2,500 Waterloo South MTA Syd Metro Aust. Avg.
$2,000 1,661 1,621
1,417
$1,500
1,028 1,075 1,098
$1,000 784
626 626 574
456 427
$500
$0
Apparel Household Goods Leisure General Retail Retail Services
*Including GST
Source: MarketInfo; macroplan
Waterloo South 26
Economic development, local retail and services studyTable 1.3 details the estimated retail expenditure capacity of the residential main trade area population by sector,
over the period 2019 to 2036. These estimates are presented inclusive of GST and in constant $2018/19 (i.e.
excluding inflation).
The retail expenditure across the main trade area is estimated at $352 million as at June 2019 and is estimated to
increase to $679 million ($2018/19) by 2036, at an average annual rate of 3.9 %, in real terms. This market growth
is made up of the following components:
Population growth of 3.3% per annum; and
Real per capita spending growth of 0.6% per annum.
The retail expenditure capacity of the primary sector is estimated to grow from $256 million at 2019 to $544 million
($2018/19) by 2036 at an average annual rate of 4.5%.
Table 1.3
Waterloo South main trade area - retail expenditure ($M), 2019-2036*
Year ending Primary Secondary Main
June sector Sector TA
2019 256 95 352
2020 267 98 365
2021 279 101 379
2022 293 104 397
2023 310 106 417
2024 328 109 437
2025 346 112 458
2026 364 115 479
2027 382 117 499
2028 399 119 518
2029 416 121 537
2030 434 123 557
2031 452 125 576
2032 470 127 596
2033 488 129 617
2034 506 131 637
2035 525 133 658
2036 544 135 679
Average annual growth ($M)
2019-2036 16.9 2.3 19.2
Average annual growth (%)
2019-2036 4.5% 2.1% 3.9%
*Constant 2018/19 dollars & including GST
Source: MarketInfo; macroplan
Waterloo South 27
Economic development, local retail and services studyTable 1.4 presents the estimate retail expenditure by retail category, across the main trade area for the period 2019
to 2036. Take-home food, groceries and packaged liquor (FLG) expenditure accounts for 42% of total retail
expenditure in 2019, followed by food catering (18%) and household goods (16%).
Food, liquor and groceries (FLG) expenditure (take-home food and groceries including packaged liquor) which is
of most relevance for supermarkets, is estimated to increase from $148 million in 2019 to reach $292 million in
2036 for the main trade area. Average annual growth is expected to be strongest for the food catering category at
4.3% with expenditure forecast to reach $130 million by 2036.
Table 1.4
Waterloo South main trade area - retail expenditure by category ($M), 2019-2036*
Year ending FLG Food Apparel Household Leisure General Retail Total
June catering goods retail services retail
2019 148 64 35 55 17 22 12 352
2020 153 66 36 57 17 23 13 365
2021 160 69 38 59 18 23 13 379
2022 167 72 39 61 19 24 14 397
2023 176 76 41 64 19 26 14 417
2024 185 80 43 67 20 27 15 437
2025 194 84 45 70 21 28 16 458
2026 203 89 46 73 22 29 17 479
2027 212 93 48 76 23 30 17 499
2028 220 96 50 79 24 31 18 518
2029 229 100 51 81 25 33 18 537
2030 238 104 53 84 25 34 19 557
2031 246 108 54 87 26 35 20 576
2032 255 112 56 89 27 36 20 596
2033 264 117 58 92 28 37 21 617
2034 273 121 59 95 29 38 22 637
2035 283 125 61 98 30 39 22 658
2036 292 130 63 101 30 40 23 679
Average annual growth ($M)
2019-2036 8.5 3.9 1.6 2.7 0.8 1.1 0.6 19.2
Average annual growth (%)
2019-2036 4.1% 4.3% 3.4% 3.6% 3.6% 3.7% 3.8% 3.9%
*Constant 2018/19 dollars & including GST
Source: MarketInfo; macroplan
Waterloo South 28
Economic development, local retail and services study1.4 Retail floorspace demand This section of the report provides an analysis of the expected demand for retail floorspace generated by the catchment population. Modelling retail demand for a given area is imprecise and depends on a range of factors therefore, the floorspace demand analysis presented in this section should be viewed as indicative. Table 1.5 details the estimated amount of retail floorspace demand generated by residents in the defined main trade area over the period 2019 to 2036. This retail floorspace demand would be served by existing and future retail facilities located throughout the surrounding region. We note that not all of this demand would be, or should be, retained within Waterloo South. Much of this demand will be directed to higher order regional and sub-regional retail facilities across the surrounding region, including but not limited to the Sydney CBD, Broadway Shopping Centre, major larger format precincts/centres such as the Supa Centa Moore Park, and near people’s place of work. The retail floorspace demand figures are calculated by applying an average retail turnover density (RTD) to the estimated available retail sales volumes by category. The RTD is simply the level of sales per sq.m which retailers in each category typically achieve. Adopted RTD levels are the highest for food, liquor & groceries (FLG) retailers including supermarkets at $9,000 per sq.m and average around $6,500 per sq.m. Table 1.5 shows the main trade area population is estimated to generate some 55,020 sq.m of retail floorspace demand as at 2019, and this demand is expected to increase to 93,289 sq.m by 2036, which reflects the growth in the trade area population over the period. The retail floorspace demand of trade area residents will increase by around 38,000 sq.m (or approximately 2,200 sq.m per annum) over the forecast period to 2036 and is predominantly underpinned by development within the Waterloo Precinct. This increase could be served by existing or new retail facilities. Table 1.6 outlines the indicative amount of retail floorspace estimated to be supportable by residents at Waterloo South over the forecast period. The role of the retail facilities at Waterloo South is to serve the food, grocery and convenience-oriented needs of the future residents of Waterloo South and other local residents in the study area. Retail facilities at Waterloo South therefore have the potential to retain a moderate proportion of the fresh food, take-home liquor and grocery (FLG) spending of local residents. Waterloo South could potentially retain some spend in the leisure, general retail and retail services categories. These retail categories typically contain convenience-oriented uses such as (but not limited to) discount variety stores, pharmacies, hairdressers, beauty salons, optometrists and dry cleaners, which solidify the offer of a supermarket. For the apparel and household goods retail categories, retail facilities at Waterloo South are unlikely to retain a material percentage of this expenditure. Typically, these uses are provided at higher order centres, with local residents likely utilising the Sydney CBD, Broadway Shopping Centre or major large format precincts/centres such as Moore Park and Alexandria. Across the retail spectrum, the proportion of available expenditure retained from the main trade area is estimated to be in the order of 11% Waterloo South 29 Economic development, local retail and services study
Table 1.5
                     Waterloo South main trade area - estimated retail floorspace demand (sq.m), 2019-2036

  Year ending       FLG           Food       Total       Apparel        H'hold       Leisure     General    Retail     Total     Total
  June                        catering       food                       goods                     retail   services   non-food   retail

  2019            16,392          9,789     26,180         7,840         12,891          2,774    3,115     2,217      28,840    55,020
  2020            16,919       10,127       27,050         8,046         13,257          2,850    3,204     2,284      29,640    56,690
  2021            17,477       10,483       27,960         8,262         13,640          2,931    3,298     2,354      30,480    58,440
  2022            18,171       10,916       29,090         8,534         14,118          3,032    3,415     2,442      31,540    60,630
  2023            19,002       11,427       30,430         8,861         14,690          3,155    3,556     2,546      32,810    63,240
  2024            19,834       11,942       31,780         9,186         15,259          3,276    3,696     2,650      34,070    65,850
  2025            20,668       12,461       33,130         9,508         15,826          3,397    3,835     2,753      35,320    68,450
  2026            21,503       12,984       34,490         9,828         16,391          3,517    3,974     2,857      36,570    71,060
  2027            22,282       13,473       35,760        10,116         16,907          3,626    4,101     2,953      37,700    73,460
  2028            23,003       13,930       36,930        10,374         17,374          3,725    4,217     3,041      38,730    75,660
  2029            23,725       14,389       38,110        10,631         17,839          3,823    4,332     3,128      39,750    77,860
  2030            24,449       14,852       39,300        10,884         18,303          3,921    4,447     3,216      40,770    80,070
  2031            25,175       15,318       40,490        11,136         18,764          4,018    4,561     3,303      41,780    82,270
  2032            25,901       15,788       41,690        11,386         19,223          4,114    4,674     3,391      42,790    84,480
  2033            26,630       16,262       42,890        11,633         19,681          4,210    4,788     3,478      43,790    86,680
  2034            27,359       16,738       44,098        11,878         20,137          4,305    4,900     3,566      44,786    88,883
  2035            28,090       17,219       45,309        12,121         20,590          4,399    5,012     3,653      45,777    91,086
  2036            28,823       17,703       46,526        12,362         21,042          4,493    5,124     3,741      46,763    93,289

  RTD*              9,000         6,500       8,100        4,500          4,250          6,000    7,000     5,500       4,900     6,400

  *Retail Turnover Density - Turnover ($) per sq.m in 2019, growth assumed at 0.7% p.a
  Source: MarketInfo; macroplan

Waterloo South                                                                                                                            30
Economic development, local retail and services study
Table 1.6
Waterloo South main trade area - indicative supportable floorspace by category (sq.m), 2019-2036
Year ending FLG Food Total Apparel H'hold Leisure General Retail Total Total
June catering food goods retail services non-food retail
% retail expenditure retained
Main TA 21.6% 12.4% 18.1% 0.0% 1.4% 8.4% 12.6% 20.6% 4.4% 11.0%
2019 4,045 1,387 5,430 0 207 266 447 522 1,440 6,870
2020 4,180 1,437 5,620 0 214 274 460 538 1,490 7,110
2021 4,326 1,491 5,820 0 221 282 475 556 1,530 7,350
2022 4,511 1,558 6,070 0 230 293 494 579 1,600 7,670
2023 4,736 1,639 6,370 0 242 306 516 607 1,670 8,040
2024 4,961 1,720 6,680 0 253 319 539 634 1,750 8,430
2025 5,186 1,802 6,990 0 265 332 561 662 1,820 8,810
2026 5,412 1,884 7,300 0 276 345 583 689 1,890 9,190
2027 5,624 1,963 7,590 0 287 357 604 715 1,960 9,550
2028 5,824 2,037 7,860 0 297 368 623 739 2,030 9,890
2029 6,024 2,111 8,140 0 307 379 643 763 2,090 10,230
2030 6,224 2,186 8,410 0 317 390 662 787 2,160 10,570
2031 6,425 2,262 8,690 0 327 401 681 811 2,220 10,910
2032 6,626 2,338 8,960 0 337 412 700 835 2,280 11,240
2033 6,828 2,415 9,240 0 347 422 718 859 2,350 11,590
2034 7,030 2,493 9,523 0 356 433 737 883 2,409 11,932
2035 7,232 2,571 9,803 0 366 443 756 907 2,472 12,275
2036 7,435 2,649 10,085 0 376 454 774 931 2,535 12,619
Source: MarketInfo; macroplan
Waterloo South 31
Economic development, local retail and services study1.5 Workers and other customer segments
This section of the report examines the potential worker trade area that could be served by retail and ancillary non-
retail facilities at Waterloo South, then examines the size and growth of the population of this trade area; its socio-
demographic profile; and the size and growth of retail expenditure and floorspace demand generated by this worker
population. This section also considers other customer segments of relevance (e.g. students, commuters, and
beyond trade area visitors).
1.5.1 Worker customer segment
Worker population
The worker trade area has been generally defined taking into account the area that would represent a comfortable
walking distance to Waterloo South. This area is similar to the residential trade area and includes the ATP. The
worker trade area that could potentially be served by retail facilities at the subject site consists of a primary sector
and one secondary sector and is illustrated on Map 1.2
Table 1.7 details the estimated current and future population within the worker trade area over the period 2019 to
2036. The worker trade area population is estimated at 17,970 workers at mid-2019, including around 9,510
workers in the primary sector and some 8,430 workers in the secondary sector. The ATP contains around 50-55%
of the secondary sector workforce at present.
The worker population is expected to nearly double by 2036 driven by major new office development in the ATP,
while growth in the primary sector is expected to be more moderate, which includes new commercial/employment
floorspace within the Waterloo precinct itself.
We also note the following:
Mirvac has secured the development rights to a major land parcel within the Australian Technology Park (ATP)
and proposes to develop three new commercial and mixed-use buildings and repurpose the heritage listed
locomotive workshop. Commonwealth Bank Australia (CBA) has committed to two major office towers, which
will comprise around 93,000 sq.m of floorspace. Upon completion in 2020, the new precinct will accommodate
approximately 18,000 workers, with the three CBA buildings bringing 10,000 new workers to the site. The
activated retail and public spaces will include a mix of al fresco cafes, dining, a gym, pop-up events and a
supermarket, creating a village hub. The precinct will provide more than 700 car spaces and 600+ secure
bicycle spots across the three buildings.
Some additional retail and employment uses could be accommodated within the Redfern Station precinct as
part of the ‘Central to Eveleigh Urban Transformation and Transport Program’ (CEUTTP or C2E) over the
medium to long term, although we do not expect anything of significant scale.
The Waterloo precinct could potentially support new workers in the retail and ancillary non-retail facilities that
could potentially establish within the precinct over time. Including home based workers, the Waterloo precinct
could potentially support between 750 and 1,000 workers.
Waterloo South 32
Economic development, local retail and services studyYou can also read