Construction skills gap analysis for the Stoke-on-Trent & Staffordshire area - CITB ANALYSIS
←
→
Page content transcription
If your browser does not render page correctly, please read the page content below

CITB ANALYSIS Construction skills gap analysis for the Stoke-on-Trent & Staffordshire area An analysis of the opportunities presented by the construction landscape in the Stoke-on-Trent & Staffordshire LEP area September 2018
EXECUTIVE SUMMARY The Stoke-on-Trent and Staffordshire Local Enterprise Partnership (LEP) area can expect sustained spending on new construction projects of more than £1.2 billion per year for at least five years. To meet this anticipated demand a total construction workforce of around 27,770 people is required in 2018 increasing to more than 28,550 in 2022. On paper the total construction workforce available appears to exceed this. However with significant demand from neighbouring areas in the West Midlands and North West and with an aging workforce resulting in retirement, there are risks that the Stoke-on-Trent and Staffordshire LEP area may not always be able to meet demand for some occupations. Across the area, new housing accounts for 42% of anticipated spend on new projects in 2019; with infrastructure and private commercial developments each accounting for 20%. The Stoke-on-Trent and Staffordshire LEP area’s opportunity The LEP and local authorities’ opportunities are to: support growing businesses; develop a more appropriately skilled and flexible workforce; drive higher level skills, match skills and the local economy and encourage job creation. This will, in turn, support the delivery of infrastructure that will enable further development and ensure that the area is prepared to exploit opportunities as they emerge and deliver the new housing that is needed. Construction on its own makes up a huge part of the UK economy representing more than 7% of GDP. But crucially it is also an enabler. It will create the new housing that is so desperately needed; will enhance the environment; will create better public spaces and facilities that we depend on; build the facilities for new technologies and manufacturing; and create new infrastructure that enables growth and prosperity. Construction opens up opportunities for major social and economic gains. “The Stoke-on-Trent and Staffordshire LEP area will have a huge range of opportunities in construction trades and professions over the coming years. With well-paid and highly skilled job opportunities in a wide range of trades and professions, we should be encouraging young people to look at construction as a career of choice with excellent prospects. A skilled workforce will help the area’s growth aspirations and leave a legacy for future generations. CITB is working with employers to inspire, attract and train this new talent for these valuable and rewarding careers.” Andrew Bridge, CITB Partnership Manager High demand occupations The top ten occupations for which there is greatest demand in the LEP area are: Non-construction professional, Plumbing and HVAC Trades technical, IT & office-based Other construction professionals and Wood trades and interior fit-out technical staff Electrical trades and installation Labourers Other construction process managers Painters and decorators Senior, executive, and business Building envelope specialists process managers At risk occupations The occupations at greatest risk of a shortfall in numbers available locally are: Architects Construction project managers Plasterers & dry liners Bricklayers Painters and decorators Specialist building operatives Floorers Stoke-on-Trent & Staffordshire LEP construction labour & skills research September 2018 ii
Priority occupations The report identifies occupations for which there is high demand AND a high risk of a shortfall. Woods trades and interior fit out Building envelope specialists Plumbing and HVAC trades Bricklayers Labourers Specialist building operatives Painters and decorators Plasterers and dry liners Occupations in context – the challenge This report sets out a challenge to the Stoke-on-Trent and Staffordshire LEP, local authorities, colleges universities, training providers, construction employers and other stakeholders – namely to attract, train, recruit and maintain a high skilled construction workforce that meets anticipated demand. Construction offers a range of well-paid high skilled jobs for which there is demonstrable demand. The opportunity is to exploit the opportunities to achieve social and economic gains by encouraging people from the area into these roles, providing the associated support and career pathways. This challenge is set against the backdrop of: concerns about the future availability of skilled workers and demand from other UK regions and major infrastructure projects. The professions There is high demand for several professional roles, jobs which require a significant length of training before candidates become qualified. Architects, surveyors and civil engineers require higher level qualifications plus professional accreditation, so the effect of action now will only be felt in five to ten years’ time. These are jobs in demand the world over. However, these roles do not need to be permanently on-site so it is likely that some demand may be met by those working outside the region. There are also opportunities to modernise construction and for Stoke-on-Trent and Staffordshire LEP to start to encourage and adopt new technologies and new practices like off-site and modular construction to help meet demand. Training and education Around 80 training providers have delivered construction related training (including apprenticeships) over the last five years. A core network of ten providers have delivered around 87% of that. The Stoke-on-Trent and Staffordshire LEP area accounts for 22% of construction related training across the West Midlands region. Provision of training provision reduced between 2012/13 and 2016/17, with new starters decreasing by 3%. However, in comparison, across the region construction training has declined by 19%. Over the same period, apprenticeship starts have increased by 6% in the LEP area, whereas across the West Midlands region that increase has been 24%. Recommendations The report proposes recommendations that include: 1. Develop and strengthen relevant collaborative partnerships. With a view to building collaborative holistic action plans and encouraging local stakeholders to work together and input to, and take ownership of, the construction skills actions. 2. Establish a Stoke-on-Trent & Staffordshire LEP area construction skills strategy and action plan that recognises collective actions and solutions that may be required in and across the area. 3. Develop skills and training pathways for both current and future skills needs. Ensure training is appropriate for local needs and businesses. Develop LEP area construction training so that it is appropriate for the needs of the construction industry and local circumstances, addressing risks of supply shortfalls. 4. Outreach. Build a more positive image of construction locally with young people. Increase recruitment through new entrance points, career changes and reskilling. Emphasise that construction offers high value rewarding careers for all. 5. Use procurement as a lever to enable positive action. Develop smarter approaches to procurement to encourage wider contract award inclusivity of small and medium sized employers. With those tendering for construction and infrastructure contracts or those funding developments to be mandated to include provision for recruitment, training, apprenticeships and outreach. Stoke-on-Trent & Staffordshire LEP construction labour & skills research September 2018 ii
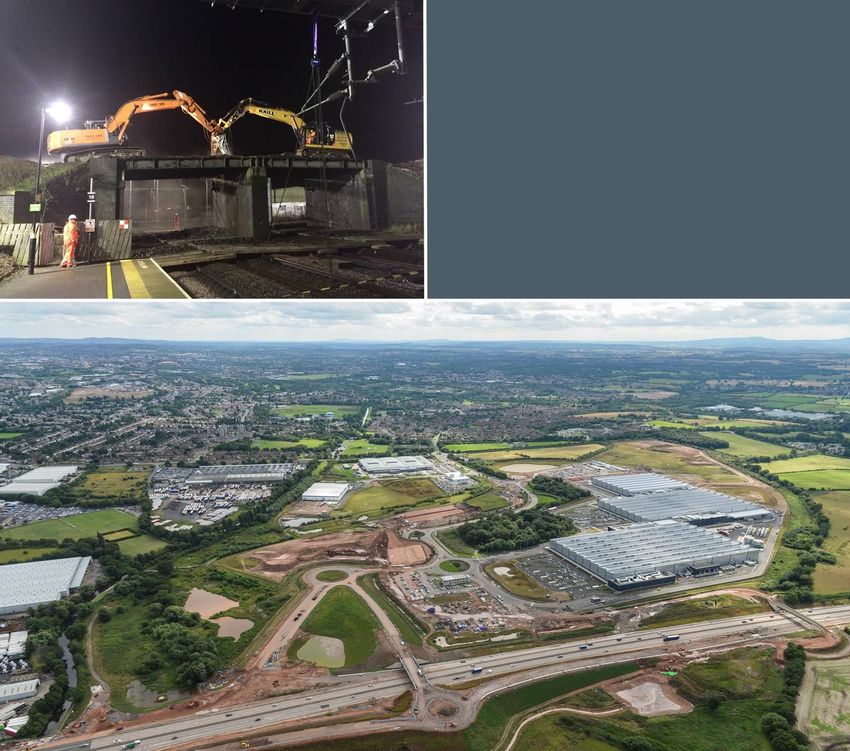
STOKE-ON-TRENT & STAFFORDSHIRE LEP SKILLS CAPITAL PROJECTS The Stoke-on-Trent and Staffordshire Local Enterprise Partnership has in place a number of capital projects and provision in relation to skills. The aims are to: Provide growth in sector specific traineeship and apprenticeships Upskill the workforce in the sector to improve productivity Upskill and retrain those looking for work Provide specialist facilities and training to meet employer needs Promote careers in the sector and use the facilities and training as a progression route The initiatives are being delivered by a network of colleges and, private training establishments, sector specialists and other organisations and has been divided between two phases of introduction. Construction specific initiatives have included: carpentry, brickwork, construction multi skills, construction design, building information modelling (BIM), construction technologies, civil engineering, and electrical installation. Development of hybrid construction training is also being established in Stafford. Other activities have embraced motor vehicle and engineering provision; automotive and hybrid technologies; renewable pneumatics; advanced manufacturing & engineering for agricultural technology. Delivery bodies include: The Advanced Manufacturing & Engineering Hub (AME Hub). This is a network of providers operating under the umbrella of the Stoke-on-Trent and Staffordshire Local Enterprise Partnership, providing world-class vocational environments with state of the art facilities in local communities linked to key employers, providers, schools and colleges. The Skills Equipment Fund allows local employers and training institutions to submit bids to secure funding to purchase state-of-the-art equipment to enable the delivery of high quality and high level training programmes to support local growth in priority sectors. The fund has matched grants with private investment and has supported many of the AME Hub activities. Further data and reports relating to the Stoke on Trent and Staffordshire area are available at: www.staffordshireobservatory.org.uk/homepage.aspx Locality profiles can be found at: www.staffordshireobservatory.org.uk/publications/thestaffordshirestory /LocalityProfiles.aspx#.W7IWVntKipq A number of other useful strategic documents are also available from the SSLEP web page at: www.stokestaffslep.org.uk/resources/publication-library/ Stoke-on-Trent & Staffordshire LEP area construction labour & skills research September 2018 ii
CONTENTS
1. Introduction ...................................................................................................... 7
 1.1. The commission ................................................................................................................ 7

2. Labour demand in the Stoke-on-Trent & Staffordshire area ............................. 9
 2.1. Summary of demand ........................................................................................................ 9
 2.2. Pipeline of known projects ................................................................................................ 9
 2.3. Estimate of future total labour demand........................................................................... 11
 2.4. Labour Insight – Construction Postings .......................................................................... 15
 2.5. High speed two (hs2) ...................................................................................................... 17

3. Construction labour supply in the LEP area ................................................... 18
 3.1. Main Points ..................................................................................................................... 18
 3.2. Existing workforce........................................................................................................... 18

4. Training provision ........................................................................................... 24
 4.1. Main points -training provision ........................................................................................ 24
 4.2. Apprenticeships .............................................................................................................. 27
 4.3. Higher Education ............................................................................................................ 30
 4.4. Career progression ......................................................................................................... 31

5. Mobility of the workforce ................................................................................. 32
 5.1. Main points – mobility ..................................................................................................... 32
 5.2. Work history .................................................................................................................... 32
 5.3. Worker origins ................................................................................................................. 33
 5.4. Travel to site ................................................................................................................... 33
 5.5. Site duration and change ................................................................................................ 34
 5.6. Sub-sector and sector mobility ....................................................................................... 34
 5.7. Leaving the sector .......................................................................................................... 34
 5.8. The impact of Brexit ........................................................................................................ 34
 5.9. Modern methods of construction and digital skills .......................................................... 35
 5.10. Barriers and opportunities for people entering the construction industry ....................... 36

6. The difference between demand and supply .................................................. 37
 6.1. Main points ..................................................................................................................... 37
 6.2. Gap Analysis ................................................................................................................... 39
 6.3. Gap Analysis – Training needs ....................................................................................... 42

7. Conclusions and recommendations ............................................................... 43
 7.1. Collaborative partnerships .............................................................................................. 44
 7.2. Skills strategy: action planning and exploitation ............................................................. 45
 7.3. Develop future skills and training pathways ................................................................... 47
 7.4. Outreach: build a more positive image of construction and increase
 recruitment through new entrace points, career changers and reskilling ....................... 48
 7.5. Use procurement and planning regulation to enable skills development ....................... 49
 7.6. Maintain and enhance the evidence base ...................................................................... 49

Stoke-on-Trent & Staffordshire LEP area construction labour & skills research September 2018
 iii
APPENDIX CONTENTS
Appendix A. Demand analysis methodology ........................................................... A-3

Appendix B. Occupational definitions ...................................................................... A-7

Appendix C. Glenigan projects removed from Stoke-on-Trent &
 Staffordshire ..................................................................................... A-10

Appendix D. Significant Glenigan projects in Stoke-on-Trent &
 Staffordshire ..................................................................................... A-13

Appendix E. NICP and LEP projects in Stoke-on-Trent & Staffordshire ................ A-20

Stoke-on-Trent & Staffordshire LEP area construction labour & skills research September 2018
 iv
LIST OF FIGURES
Figure 1: Stoke-on-Trent & Staffordshire and surrounding areas ........................................................... 8
Figure 2: Location of significant Glenigan projects included in the analysis ......................................... 10
Figure 3: Total construction labour demand including estimates for both R&M and
 estimates of other work ................................................................................................... 11
Figure 4: Total construction labour demand for 2019 by broad occupational group ............................. 12
Figure 5: Construction labour demand for skilled trades & operative occupations in the
 peak year ......................................................................................................................... 13
Figure 6: Construction labour demand managerial, professional & office based
 occupations in the peak year .......................................................................................... 14
Figure 7: Proportion of Postings by Salary Banding (2017-18) ............................................................ 15
Figure 8: Year on year change in Construction Employment (Experian/CITB & NOMIS
 2017) ............................................................................................................................... 19
Figure 9: Year on year change in Construction Businesses (UK Business Count, NOMIS
 2017) ............................................................................................................................... 20
Figure 10: Distribution of construction businesses within the Stoke-on-Trent and
 Staffordshire LEP (UK Business Count, NOMIS 2017) .................................................. 20
Figure 11: Construction employment by area within the Stoke-on-Trent and Staffordshire
 LEP area (2017, NOMIS) ................................................................................................ 21
Figure 12: Construction Businesses by Size (UK Business Count, NOMIS 2017) ............................... 22
Figure 13: Average number of weeks from planning to work on site, UK 2010-2013
 (Source: UKCG/Glenigan) ............................................................................................... 37

Stoke-on-Trent & Staffordshire LEP area construction labour & skills research September 2018
 v
LIST OF TABLES
Table 1: New-build construction spend by project type in 2019 (total known projects)......................... 10
Table 2: Construction spend per infrastructure sub-type in 2019 (total known projects) ...................... 11
Table 3: Labour demand by project type in 2019 .................................................................................. 14
Table 4: Vacancy postings in the Stoke-on-Trent & Staffordshire area – top ten, April
 2017 to March 2018 ........................................................................................................ 16
Table 5: HS2 Construction labour demand by region – Phase One and Phase 2a .............................. 17
Table 6: Construction workforce – occupational breakdown, 2017 (Source Experian &
 CITB) ............................................................................................................................... 23
Table 7: Competence qualification achievements in Stoke-on-Trent and Staffordshire
 LEP as a % of total competence qualification achievements in West
 Midlands region as a whole (Source: CITB/ESFA) ......................................................... 25
Table 8: Top ten training providers delivering training to the Stoke-on-Trent and
 Staffordshire LEP by number of starts – excluding apprenticeships
 (Source: CITB/ESFA) ...................................................................................................... 26
Table 9: Unique Learner starts by area, construction subjects, all levels (Source:
 CITB/ESFA)..................................................................................................................... 27
Table 10: Unique apprenticeship starts by area (Stoke-on-Trent and Staffordshire LEP),
 construction subjects (Source: CITB/ESFA) ................................................................... 27
Table 11: Unique apprenticeship starts by occupation (Stoke-on-Trent and Staffordshire
 LEP), construction subjects (Source: CITB/ESFA) ......................................................... 28
Table 12: Unique apprenticeship starts by provider in Stoke-on-Trent and Staffordshire
 LEP (subjects (Source: CITB/ESFA)............................................................................... 29
Table 13: Region / nation employer operates in, compared with region / nation working in ................. 33
Table 14: Occupational breakdown of demand for Stoke-on-Trent and Staffordshire area
 against current employment ............................................................................................ 39

Stoke-on-Trent & Staffordshire LEP area construction labour & skills research September 2018
 vi
1. INTRODUCTION This report represents the first step in developing and maintaining an evidence base, to be utilised by the Stoke-on- Trent and Staffordshire local authorities and Local Enterprise Partnership, as well as those interested in the growth, prosperity and built environment in the area to inform decision making that will help determine the employment and skills opportunities emerging in the construction industry. Construction is a significant part of the economy and is a major employer. But it is also an enabler of economic growth and job creation and has a significant impact on enhancing the built environment, in creating the facilities required of a modern economy and addresses significant social issues, such as a shortage of housing. It is also an enabler of other sectors’ success by building the facilities required for commercial and industrial advances as well as the infrastructure that is, in turn, an enabler of growth. It is, therefore, essential for the Stoke-on- Trent and Staffordshire LEP area to invest in supporting the actions proposed in this report as well as referring to the wider evidence base available and involving stakeholders in the development of the associated plans. The analysis starts to determine priorities for interventions to ensure local opportunities are maximised and that the area has the right future skills and training pathways in place to deliver demand led solutions. The area is also bordered by a number of significant metropolitan areas that may have a net effect of drawing skilled workers to them from the Stoke-on-Trent and Staffordshire LEP area. 1.1. THE COMMISSION Figure 1 shows the Stoke-on-Trent & Staffordshire area that has been assessed, that includes the local authority areas of: Cannock Chase East Staffordshire Lichfield Newcastle-under-Lyme South Staffordshire Stafford Staffordshire Moorlands Stoke-on-Trent Tamworth Stoke-on-Trent & Staffordshire LEP area construction labour & skills research September 2018 7
Figure 1: Stoke-on-Trent & Staffordshire and surrounding areas

Locality profiles can be found at:
www.staffordshireobservatory.org.uk/publications/thestaffordshirestory/LocalityProfiles.aspx#.W7IWVntKipq
A number of other useful strategic documents are also available from the SSLEP web page at:
www.stokestaffslep.org.uk/resources/publication-library/

Stoke-on-Trent & Staffordshire LEP area construction labour & skills research September 2018
 8
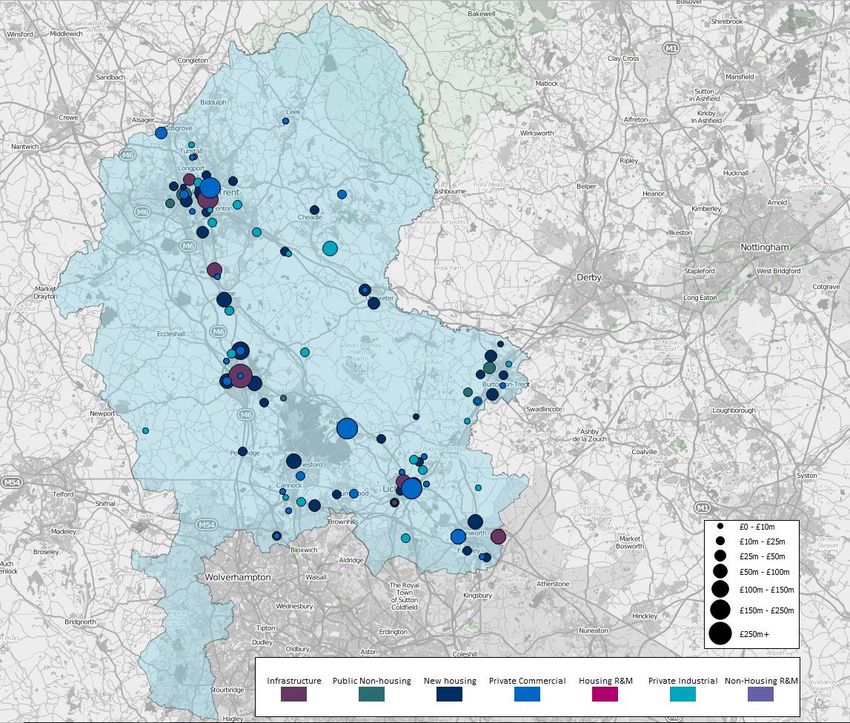
2. LABOUR DEMAND IN THE STOKE-ON-TRENT & STAFFORDSHIRE AREA The following sections provide an estimate of the labour demand predicted by our Labour Forecasting Tool that construction investment will create across the area over the period 2018-2022. The tool and method of analysis are described in Appendix A. 2.1. SUMMARY OF DEMAND Our estimate of the labour demand in the Stoke-on-Trent & Staffordshire is around 27,770 people in 2018. The projected growth between 2018 and 2022 suggest that the labour demand in 2022 will be around 28,550 people. Around 60% of the workforce is employed in skilled trades & operatives, the other 40% are in Managerial, professional & office based staff. During 2019 the most labour-intensive occupation group is “Non-construction professional, technical, IT, and other office–based staff (excl. managers)” with an annual demand of 3,730 people. The skilled trade & operative occupations in greatest demand are: Wood trades and interior fit-out with a requirement for 2,840 people; Electrical trades and installation follow with 2,080 people. Plumbing and heating, ventilation, and air conditioning trades rank third, with a demand of 1,830 people 2.2. PIPELINE OF KNOWN PROJECTS 2.2.1. Glenigan pipeline analysis 1 We have considered projects in the Glenigan database and the National Infrastructure and Construction Pipeline 2 (NICP) . These comprise what are referred to as the known projects. An initial review of the Glenigan database identified 748 projects in the Stoke-on-Trent & Staffordshire area. Of the Glenigan projects, one project was removed due to missing values and 85 were removed due to missing dates. Also excluded was one project which was clearly identified as a consultancy project. Two projects were removed because they were duplicates. One project was removed due to it not being located in the analysed area and one was removed due to it being included in the NICP. Three projects were removed following consultation with the local authorities within the LEP. A full set of the projects which were omitted from the analysis is provided in Appendix C. The spend in projects which were removed because of missing dates is around 4.6% of the total pipeline value. It is possible that this work will take place at some point in the future but as dates are unknown it is most likely that this will be later in the forecast period. Since dates are not known it is not possible to pinpoint when the labour will be required. However, an assessment of the labour demand from potential additional projects is included in the estimates of other work as outlined in Appendix A. The Mean Value Theorem was applied to the remainder of the pipeline to identify the significant projects. The process identified 136 significant projects accounting for 84% of the total construction spend in the area. This allowed a detailed analysis of a large proportion of all the projects and a comprehensive consideration of the project types to which they were assigned. Appendix D provides a full breakdown of the Glenigan significant projects and their construction values. The peak year for the Glenigan spend profile is 2019. The location of the significant projects within the Stoke-on-Trent & Staffordshire can be seen in Figure 2. The values of the projects are proportional to the sizes of the coloured dots. 1 The Glenigan database allows contractors to identify leads and to carry out construction market analysis. It is updated every quarter to provide details of planning applications from local authorities supplemented with additional project-specific data. For the purposes of this analysis with have used the 2018Q1 cut of data. 2 The Infrastructure and Projects Authority (formerly Infrastructure UK and Major Projects Authority) compile annually a pipeline of UK infrastructure and construction projects and the associated annual public and private investment. For this report we have used the 2017 which includes details of around 700 projects valued at some £463bn. Stoke-on-Trent & Staffordshire LEP area construction labour & skills research September 2018 9
Figure 2: Location of significant Glenigan projects included in the analysis

2.2.2. Glenigan & NICP spend analysis
Implementing the methodology outlined in Appendix A leads to the following findings for the peak year for known
projects of 2019. The peak year is used because the tail off in the known projects is more likely to be due to a lack of
future planning rather than an actual tail off in workload.
Table 1 shows the distribution by project type of new build spend for the total pipeline of known projects.

Table 1: New-build construction spend by project type in 2019 (total known projects)
 Construction spend in 2019 (2018
 Project type % of total
 values - £m)

New housing 507 42%
Private commercial 243 20%
Infrastructure 243 20%
Public non-housing 125 10%
Private industrial 93 8%
Total 1,211 100%

Stoke-on-Trent & Staffordshire LEP area construction labour & skills research September 2018
 10
Table 2 shows the infrastructure construction spend from the known projects in 2019 by infrastructure sub-type.
Appendix E provides a full breakdown of the NICP and LEP projects and their construction values.

Table 2: Construction spend per infrastructure sub-type in 2019 (total known projects)
 Construction spend in 2019 (2018
 Project type % of total
 values - £m)

Transport 155 64%
Water 53 22%
Energy 24 10%
General infrastructure 6 2%
Flooding 4 2%
Total 242 100%

2.3. ESTIMATE OF FUTURE TOTAL LABOUR DEMAND
The known project pipeline may not include smaller projects or repair and maintenance work. Figure 3 shows the
outcomes of the analysis of future labour demand with the forecast regional employment growth rate applied. The
solid purple area shows the labour demand arising from the new build Glenigan and NICP projects. This is projected
forward from the peak as shown in green. The R&M (including any in Glenigan or the NICP) is also shown along with
the likely total labour demand arising from estimates of other work (please note that in Stoke and Staffordshire the
estimates of other work is negligible). The method for calculating these is provided in Appendix A. The total
construction labour demand is around 27,770 people in 2018. The projected growth between 2018 and 2022
suggest that the labour demand in 2022 will be around 28,550.

Figure 3: Total construction labour demand including estimates for both R&M and estimates of other work

Stoke-on-Trent & Staffordshire LEP area construction labour & skills research September 2018
 11
2.3.1. Breakdown of labour demand by occupation
Figure 4 presents the breakdown of labour for skilled trades & operatives and managerial, professional & office
based staff. Around 60% of the workforce are in skilled trades & operative occupations.

Figure 4: Total construction labour demand for 2019 by broad occupational group

For the peak year in Glenigan of 2019, Figure 5 shows the detailed breakdown for the 20 skilled trade & operative
occupational groups for the pipeline of known projects, the estimates of other new-build work and the R&M work.
These occupations will be predominately based at or near the location of the work.

Stoke-on-Trent & Staffordshire LEP area construction labour & skills research September 2018
 12
Figure 5: Construction labour demand for skilled trades & operative occupations in the peak year

Stoke-on-Trent & Staffordshire LEP area construction labour & skills research September 2018
 13
Figure 6 shows a breakdown of the managerial, professional & office based occupations. Since it is possible for
many of these people to work remotely from the site, they will not necessarily generate a local demand.

Figure 6: Construction labour demand managerial, professional & office based occupations in the peak year

2.3.2. Breakdown of labour demand by project type
Table 3 shows the labour demand generated by the known projects and the estimates of other work in 2019 broken
down by project type.

Table 3: Labour demand by project type in 2019
 Known pipeline Estimates of other
 Total labour demand
 Project type labour demand in work labour demand % of total in 2019
 in 2019 (people)
 2019 (people) in 2019 (people)

Non-housing R & M - 7,640 7,640 27%
New housing 6,170 - 6,170 22%
Housing R&M 340 3,930 4,270 15%
Private commercial 4,180 - 4,180 15%
Public non-housing 2,200 - 2,200 8%
Infrastructure 2,070 - 2,070 7%
Private industrial 1,620 - 1,620 6%
Total 16,580 11,570 28,150 100%

Stoke-on-Trent & Staffordshire LEP area construction labour & skills research September 2018
 14
2.4. LABOUR INSIGHT – CONSTRUCTION POSTINGS
The Stoke-on-Trent and Staffordshire LEP has provided additional demand data that helps inform the local
circumstances and should be included in the review of available information and in guiding prioritisation of decision
making.

2.4.1. Advertised Salaries - April 2017 to March 2018
The median salary advertised for construction jobs in the Stoke-on-Trent and Staffordshire LEP area is around
£30,000 per annum, slightly lower than the median for the West Midlands (£30,800) and the median for England of
£32,200.
Compared to England, a greater proportion of Construction vacancies fall into some of the lower salary bandings,
particularly £15,000 to £19,999. In the LEP area, around 22% of Construction vacancies were in this banding,
compared to 12% of vacancies across England. As a result, the proportion of vacancies in the LEP which have a
salary of £60,000 or greater is substantially lower than England; 1.4% of LEP vacancies, compared to 7.4% across
England.

Figure 7: Proportion of Postings by Salary Banding (2017-18)

Source: Labour Insight Database, Burning Glass

Stoke-on-Trent & Staffordshire LEP area construction labour & skills research September 2018
 15
2.4.2. Labour Insight – Construction Postings
The most in demand construction occupations in the Staffordshire and Stoke-on-Trent LEP area are plumbers and
HVAC trades (SOC 5314) and Carpenters and joiners (SOC 5315) – both of which individually account for around
10% of construction vacancies. In terms of advertised vacancies, these appear to be the construction occupations
with greatest demand across the LEP, West Midlands and England overall.

Table 4: Vacancy postings in the Stoke-on-Trent & Staffordshire area – top ten, April 2017 to March 2018
 LEP
 Occupation LEP Pct LEP Rank SOC code
 Postings
Plumbers and heating and ventilating engineers 138 10.7% 1 5314
Carpenters and joiners 103 8.0% 2 5315
Sales related occupations nec 75 5.8% 3 7129
Managers and proprietors in other services nec 52 4.0% 4 1259
Bricklayers and masons 46 3.6% 5 5312
Other administrative occupations nec 42 3.2% 6 4159
Quantity surveyors 37 2.9% 7 2433
Construction operatives nec 36 2.8% 8 8149
Customer service occupations nec 34 2.6% 9 7219
Electricians and electrical fitters 33 2.6% -10 5241
Elementary construction occupations 33 2.6% -10 9120

Source: Labour Insight Database, Burning Glass

Stoke-on-Trent & Staffordshire LEP area construction labour & skills research September 2018
 16
2.5. HIGH SPEED TWO (HS2)
High Speed Two Ltd has been granted the powers by Parliament to begin the construction of Phase One of HS2
which will be the new high speed line between London, Birmingham, Crewe, Manchester and Leeds. The HS2 route
passes through the Stoke & Staffordshire LEP area between Stafford and Stoke on Trent, passing close to Stone.

2.5.1. INDICATIVE SCHEDULE AND IMPACT
The Government’s information states that: The construction of the whole Phase One route will take approximately
eight years, from the moment that site clearance work starts to the completion of railway installation. This will be
followed by a period of testing and commissioning before the first services commence in 2026.
Phase 2a of the project is from the West Midlands to Crewe, with the first services scheduled for 2027. The line will
connect to the West Coast Main Line at Handsacre near Rudgely, allowing trains to stop at Stafford and Stoke-on-
Trent. Phase 2a now also includes a 400m extension of Crewe Station’s platform 5 to allow for the splitting and
joining of HS2 services, which may allow trains to re-join the HS2 line after stopping at Stoke-on-Trent.

2.5.2. HS2 LABOUR AND SKILLS FORECASTING
High Speed 2 commissioned its own analysis of the demand for construction and the potential impact on the
construction industry along the route. And in September 2018, High Speed 2 published its Skills, Employment and
Education Strategy available from the HS2 website.
This strategy is linked to the HS2 labour and skills demand and supply forecasting and analysis also available from
the HS2 website.
At its peak in 2021/22, the demand for labour generated by construction and rail engineering activities is expected to
support around 30,500 jobs, in construction and rail engineering activities, primarily from the Phase One
construction. Of these jobs, a peak construction workforce of around 25,600 is anticipated.
In total, more than 15,000 of these jobs are expected to be supported each year between 2019/20 and 2023/24.
A second peak of around 25,000 jobs is forecast resulting from Phase 2b early in the 2030s. The forecast
requirement is for over 10,000 jobs to deliver the work every year with the exceptions of 2026/27. A third of the
construction jobs are forecast to require skills, at least at NVQ4+ or degree-level so the work represents a significant
opportunity to upskill the construction and infrastructure workforce.
To some extent, HS2 is attempting to address some of these potential gaps with the creation of the new National
College for High Speed Rail (NCHSR). The proposal is also to establish at least 2,000 apprentices accounting for
4% of the contractors’ workforce on the main contracts.
The distribution of labour between regions for Phases 1 and 2a is summarised in Table 5.

Table 5: HS2 Construction labour demand by region – Phase One and Phase 2a
 Region Person-years Peak workforce Timing of peak
 London 50,100 8,800 2021/22
 South East 19,300 5,300 2021/22
 East Midlands 4,000 1,000 2020/21
 North West 4,200 1,200 2021/22
 West Midlands 44,300 9,000 2021/22
 Total 121,900 25,200 2021/22
Source: High Speed Two labour and skills demand and supply forecasting and analysis, August 2018

The need for roles will not be evenly spread across the spectrum of construction occupations. Occupations
including: construction supervisors, scaffolders, plant operatives, civil engineers, are forecast to experience
particular labour demand pressures. More detailed information is included in the HS2 labour and skills demand and
supply forecasting and analysis.

Stoke-on-Trent & Staffordshire LEP area construction labour & skills research September 2018
 17
3. CONSTRUCTION LABOUR SUPPLY IN THE STOKE-ON-TRENT AND STAFFORDSHIRE LEP AREA When looking at the supply of workers there are two main elements to consider: the size of the current workforce and the existing training provision. The first element is to take a view on construction employment in the Stoke-on-Trent and Staffordshire LEP and how this relates to employment across the West Midlands region and the UK. The Stoke-on-Trent LEP falls entirely in the West Midlands region. So comparisons are made against the West Midlands region and, where applicable, the UK. Data from CITB’s Construction Skills Network (CSN) is used along with official Government sources. Employment and employers are considered together as they are intrinsically linked, particularly as a large proportion of construction workers are employed within micro businesses or are self-employed, where the business location is also the home location. For the second element, whilst training occurs at Further Education (FE) and Higher Education (HE) levels, the main focus of this report is on the FE that takes place. FE tends to be sourced and delivered in a closer proximity to the home and workplace, whereas the length of study time and specialisms for Universities for HE typically give much greater degrees of mobility. Nevertheless, Higher Education in the region is also analysed, but should be considered in the context of the greater mobility levels of the learners at this level. Finally, the demand forecasts are compared against employment, training and workforce mobility to give an indication of possible gaps and/or occupational pinch points. 3.1. MAIN POINTS Current construction workforce within the LEP area is estimated at just over 46,000 workers. Over half of the workforce in the Stoke-on-Trent and Staffordshire LEP is located in Stoke-on-Trent (29%), Cannock Chase (15%) and Stafford (15%). The Stoke-on-Trent and Staffordshire LEP accounts for around 21% of the West Midlands total current construction workforce and 22% of its construction firms. Employment levels in the Stoke-on-Trent and Staffordshire LEP in 2016/17 are the highest they have been in over the last six years. Over the last five years around 80 training providers have delivered construction related training within the LEP; ten main providers deliver 87% of provision. 3.2. EXISTING WORKFORCE The Stoke-on-Trent and Staffordshire LEP construction workforce has received positive growth of 26.5% in the year to December 2017. 94% of Stoke on-Trent and Staffordshire LEP businesses are Micro sized (0-9 employees), identical to West Midlands region as whole. An analysis of the Annual Population Survey shows that the Stoke-on-Trent and Staffordshire LEP area accounts for around 21% of construction employment in West Midlands region as a whole. This is the number of workers employed by employers within the Stoke-on-Trent and Staffordshire LEP. Table 6 applies this percentage share across the CSN occupational breakdown for the West Midlands region as a whole to give an estimate of total employment at occupational and industry level in the Stoke-on-Trent and Staffordshire LEP area. For comparison, the wider West Midlands region has been included. Decline in workforce growth was witnessed in the LEP in 2014/15 of 14.3%, however over the last two years there has been increases. Strong workforce growth for the LEP has been achieved in 2016/17 with 26.5%, outperforming the West Midlands as a whole (6.1%) in the same time period. Stoke-on-Trent & Staffordshire LEP area construction labour & skills research September 2018 18
30.0% 250,000 25.0% 20.0% 200,000 15.0% 10.0% 150,000 5.0% 0.0% 100,000 2011/12 2012/13 2013/14 2014/15 2015/16 2016/17 -5.0% -10.0% 50,000 -15.0% -20.0% 0 Growth in Construction Workforce ( West Midlands) Growth in Construction Workforce (Stoke on trent and staffordshire) Size of Construction Workforce (Stoke and Stafforshire LEP) Size of Construction Workforce (West Midlands) Figure 8: Year on year change in Construction Employment (Experian/CITB & NOMIS 2017) The number of construction businesses within LEP has decreased slightly from a 24% share of all construction businesses across the West Midlands in 2013 to a 22% share in 2017. However, in actual numbers there has been a rise in construction businesses within the LEP, from 4,750 in 2013 to 5,350 in 2017, a 13% increase. Looking at the West Midlands, there was an increase of around 9,650 businesses within the area, over the same timeframe, a rise of 20% on 2013 levels. Figure 7 shows the distribution of construction businesses within the Stoke-on-Trent and Staffordshire LEP and Figure 8 shows the distribution of the construction workforce. There are clear differences between the two; Comparing business to workforce distribution indicates that East Staffordshire, Lichfield, South Staffordshire and Staffordshire Moorland’s have a higher share of businesses compare to the construction workforce. Over 90% of firms within the LEP are micro sized (less than 10 employees), similar to that of the West Midlands as a whole. Stoke-on-Trent & Staffordshire LEP area construction labour & skills research September 2018 19
8.0% 30,000

 6.0%
 25,000
 4.0%
 20,000
 2.0%

 0.0% 15,000

 -2.0%
 10,000
 -4.0%
 5,000
 -6.0%

 -8.0% 0
 Growth in Businesses (Stoke and Staffordshire LEP)
 Growth in Businesses (West Midlands)
 Growth in Businesses (UK)
 Number of Businesses (West Midlands)
 Number of Businesses (Stoke and Staffordshire LEP)
Figure 9: Year on year change in Construction Businesses (UK Business Count, NOMIS 2017)

The local authority areas in the LEP with the largest share of the workforce are Stoke-on-Trent, Cannock Chase and
Stafford accounting for nearly 60% of the total.

Figure 10: Distribution of construction businesses within the Stoke-on-Trent and Staffordshire LEP (UK
Business Count, NOMIS 2017)

Stoke-on-Trent & Staffordshire LEP area construction labour & skills research September 2018
 20
Figure 11: Construction employment by area within the Stoke-on-Trent and Staffordshire LEP area (2017, NOMIS) When assessing the patterns between workforce and number of businesses it is important to note two main factors when looking at the construction sector: Direct employment vs self-employment Size of business. The construction sector has high levels of self-employment with around 40% of the UK construction workforce being self-employed; which is replicated in the West Midlands. Interestingly, the figure for self-employment in the Stoke-on- Trent and Staffordshire LEP is higher at 45%. When looking at business size, the distribution of companies across the LEP area is on the whole similar to the West Midlands as a whole, and the United Kingdom with the majority of companies being micro sized, (94% respectively). The proportion of small businesses are slightly higher in the Stoke-on-Trent and Staffordshire LEP at 6%, compared to the West Midlands and the UK at 5%. Stoke-on-Trent & Staffordshire LEP area construction labour & skills research September 2018 21
Large (250+)
 0.5% 0.1% 5.6%
 Medium (50-249)
 0.1% 0.5% 5.4%
 Small (10-49)
 0.1%
 0.6% 5.2% Micro (0-9)

 Stoke-on-Trent
 and Stafforshire
 LEP

 West Midlands
 94%

 94% United Kingdom
 94%

Figure 12: Construction Businesses by Size (UK Business Count, NOMIS 2017)

Stoke-on-Trent & Staffordshire LEP area construction labour & skills research September 2018
 22
Table 6: Construction workforce – occupational breakdown, 2017 (Source Experian & CITB)
 Stoke-on-Trent & West Midlands
 Staffordshire region
MANAGERIAL, PROFESSIONAL AND OFFICE BASED ROLES
Other construction professionals and technical staff 2,930 13,910
Other construction process managers 4,280 20,280
Senior, executive, and business process managers 4,000 18,970
Surveyors 1,380 6,550
Construction Project Managers 490 2,310
Civil engineers 620 2,950
Construction Trades Supervisors 780 3,720
Architects 290 1,400
Non-construction professional, technical, IT, and other office-based staff 6,840 32,400
Non–construction operatives 640 3,010
SKILLED TRADES
Wood trades and interior fit-out 3,720 17,630
Electrical trades and installation 3,850 18,260
Plumbing and HVAC Trades 2,820 13,350
Labourers nec* 2,200 10,450
Building envelope specialists 1,660 7,860
Painters and decorators 1,350 6,380
Specialist building operatives nec* 820 3,890
Bricklayers 990 4,700
Roofers 780 3,690
Plasterers 540 2,560
Plant mechanics/fitters 1,500 7,120
Plant operatives 480 2,270
Glaziers 630 2,970
Floorers 330 1,560
Logistics 650 3,060
Steel erectors/structural fabrication 620 2,940
Scaffolders 420 1,970
Civil engineering operatives nec* 450 2,120
Total 46,060 218,310
Note: numbers rounded to the nearest 10
Note: nec*: not elsewhere classified; HVAC: Heating, ventilation and air-conditioning.

Stoke-on-Trent & Staffordshire LEP area construction labour & skills research September 2018
 23
4. TRAINING PROVISION 4.1. MAIN POINTS -TRAINING PROVISION Over the last five years around 80 training providers have delivered construction related training within the LEP; ten main providers deliver 87% of provision. Overall, training volumes in the LEP have fallen slightly, while apprenticeships starts have increased slightly over the last four years. Good levels of competence qualifications achievements are found within the following occupations; plant mechanic/fitter, painters & decorators, roofers, scaffolders, construction trade supervisors Overall, the volume of training in Stoke-on-Trent and Staffordshire LEP has slightly reduced between 2012/13 and 2016/17, with the number of new starters decreasing by 3% over this period. This fall is considerably smaller than, the decline witnessed in the West Midlands region as a whole of 19% over the same period. CITB analysis of Education and Skills Funding Agency (ESFA) Individualised Leaner Records from 2012/13 through to 2016/17 academic years for construction learners shows that: The Stoke-on-Trent and Staffordshire LEP area accounts for 22% of identified construction related training across the West Midlands area. There has been a reduction in the total number of construction learners starting in the Stoke-on-Trent and Staffordshire LEP (-3%).A greater reduction is found in the West Midlands region of-19%. Apprenticeship starts within the Stoke-on-Trent and Staffordshire LEP have increased over the period from 2012/13 to 2016/17 to 6%. However, this increase in apprenticeship starts is lower than the West Midlands as a whole at 24% over the same period. When looking at other Education and Training construction learner starts (i.e. non-Apprenticeship construction qualifications) there has been reductions both in the Stoke-on-Trent and Staffordshire LEP and in the West Midlands (-6% and -26% respectively). A number of areas within the LEP have witnessed positive growth in starters between 2012/13 to 2016/17. The two areas that have witnessed the largest positive growth in starters is Lichfield (116%) and Staffordshire Moorlands (58%). “Knowledge” based qualifications describe those qualifications that typically have a theoretical basis so are more likely to be ‘classroom based’. “Competence” based qualifications, in the main, achieve a recognised NVQ and so a link can be made between the qualification title and the likely occupation that an individual will have. For example someone starting or achieving a Bricklaying qualification is highly likely to be working as a Bricklayer as competence based qualifications are based on an assessment of work based skills. Table 7 shows qualification achievements over the last five years for the identified competence based qualifications, comparing achievement volumes against the overall pattern for the West Midlands as a whole. From this analysis 3 there appear to be patterns for particular occupations. The majority of the achievements referred to in Table 7 are at: Level 2 (75%), Level 3 (26%) Level 4 and above (0%). The percentage comparison with the West Midlands region as a whole is used to demonstrate how the provision of training in the Stoke-on-Trent and Staffordshire LEP by occupation is relatively high or low against the regional context. 3 The information shown in Table 7 has been produced by mapping qualification reference numbers and titles to the most appropriate Construction Skills Network occupations. This has been built up over a number of years by CITB with over 1,800 qualifications reviewed and linked where possible. Note: there are some qualifications that have broad or generic titles that cannot be linked to distinct occupations Stoke-on-Trent & Staffordshire LEP area construction labour & skills research September 2018 24
The first group of occupations to be identified for the main training volumes, which are broadly similar with the overall training pattern seen in the West Midlands. These are: Plant Operatives Wood trades and interior fit-out Electrical trades and installation Plumbing and HVAC Trades Bricklayers Here the qualification achievements are consistent with or slightly higher than the overall share of training being achieved in the LEP area or there is a larger volume of training being delivered against them. For occupations such as wood trades and plumbing, the volume of training will be related to their share of employment, while for others such as plant operators, training will be more related to the need to demonstrate competence for these roles through card scheme monitoring (for example the CPCS Card scheme for Plant Operatives). Table 7: Competence qualification achievements in Stoke-on-Trent and Staffordshire LEP as a % of total competence qualification achievements in West Midlands region as a whole (Source: CITB/ESFA) Total Construction occupations 12-13 13-14 14-15 15-16 16-17 Total Achievements Main Occupations Plant operatives 15% 16% 26% 34% 46% 998 21% Plumbing and HVAC Trades 22% 15% 22% 25% 25% 530 21% Wood trades and interior fit-out 16% 21% 22% 23% 24% 470 21% Bricklayers 31% 25% 28% 32% 37% 409 31% Electrical trades and installation 17% 14% 16% 22% 13% 409 17% Occupations with good provision Plant mechanics/fitters 67% 66% 84% 74% 80% 338 76% Painters and decorators 29% 37% 21% 30% 38% 236 31% Roofers 5% 27% 22% 54% 33% 87 29% Scaffolders 26% 27% 31% 26% 20% 87 27% Construction Trades Supervisors 6% 35% 80% 58% 64% 84 27% Occupations to Monitor Glaziers 7% 16% 33% 47% 35% 157 22% Plasterers 15% 23% 23% 18% 22% 88 19% Specialist building operatives nec* 19% 23% 21% 19% 13% 189 19% Building envelope specialists 2% 28% 26% 6% 3% 99 15% Civil engineering operatives nec* 6% 6% 9% 12% 23% 186 11% Low Overall Learner Volumes Floorers 19% 22% 19% 33% 25% 66 22% Other construction professionals & 0% 0% 0% 7% 2% 5 2% technical staff There is a second group of occupations with good provision: where there appears to be a higher level of provision for occupations such as plant mechanic/fitter, painters & decorators, roofers, scaffolders, construction trade supervisors. It could be that there are providers with particular specialisms in these areas operating with the LEP, or a particular need for this type of training. The third group – occupations to monitor: identifies a small number of occupations where we would expect higher levels of training, again linked to either the occupational size and/or demonstrating competence. This cluster includes construction glaziers, plasterers, specialist building operatives nec*, building envelop specialists, civil engineering operatives nec* happening within the LEP is lower than would be expected. It is possible that individuals within the Stoke-on-Trent and Staffordshire LEP area may be travelling outside the area for this type of training. Stoke-on-Trent & Staffordshire LEP area construction labour & skills research September 2018 25
Lastly there is a group of occupations where the low level of learner volumes makes it difficult to judge patterns
across the years. Whilst the training provider network can adjust to cover changes in demand, there will be a
requirement for a certain volume of training to make it viable for a provider to deliver it. These occupations could
suffer from this intermittent demand or learners could be travelling further afield to more specialist training providers.
In the Stoke-on-Trent and Staffordshire LEP area between 2012/13 and 2016/17, 82 different providers have been
delivering training. The majority of training (86%) is being delivered by ten main providers, as shown in Table 8.

Table 8: Top ten training providers delivering training to the Stoke-on-Trent and Staffordshire LEP by
number of starts – excluding apprenticeships (Source: CITB/ESFA)
 Total % share % Quals
 Provider 12-13 13-14 14-15 15-16 16-17 (Learner of Total Ofqual
 Aims) Quals Regulated
Milton Keynes College 1,393 664 1468 1133 1128 5786 28% 79%
Stoke On Trent College 787 892 654 643 489 3465 17% 92%
South Staffordshire College 344 357 344 423 406 1874 9% 93%
Newcastle-under-Lyme
 273 300 328 329 383 1613 8% 100%
College
South & City College
 311 500 296 1107 5% 100%
Birmingham
Stafford College 228 202 205 305 160 1100 5% 100%
BCTG Limited 110 142 309 224 251 1036 5% 96%
Project Management
 360 103 71 2 1 537 3% 100%
(Staffordshire) Limited
LTE Group 0 95 428 2 0 525 3% 0%
Swindon College 24 43 7 5 300 379 2% 21%

Not all of the providers are in the Stoke-on-Trent and Staffordshire LEP area. Providers that are outside the area
include: Milton Keynes College, South and City College Birmingham, BCTG Limited, LTE Group and Swindon
College. The majority of colleges based in the LEP area provide a high percentage of Ofqual registered
qualifications (all above 92%). The average for provision for the area as whole is 87%.
This profile is typical of many LEP areas, where a relatively small group of FE colleges deliver the majority of
construction training. A smaller proportion of additional training is then delivered by a larger number of other
providers. Sometimes these smaller specialist providers can operate far from the normal base of those for whom
they provide training. In total this training covers the majority of the main occupations involved in the construction
workforce.

Stoke-on-Trent & Staffordshire LEP area construction labour & skills research September 2018
 26
You can also read