RESIDENTIAL LAND USE REGULATIONS IN NEW HAMPSHIRE: CAUSES AND CONSEQUENCES - By Jason Sorens
←
→
Page content transcription
If your browser does not render page correctly, please read the page content below

RESIDENTIAL LAND USE
   REGULATIONS IN NEW
HAMPSHIRE: CAUSES AND
        CONSEQUENCES
                                  By Jason Sorens

       Published by the Josiah Bartlett Center for Public Policy

       1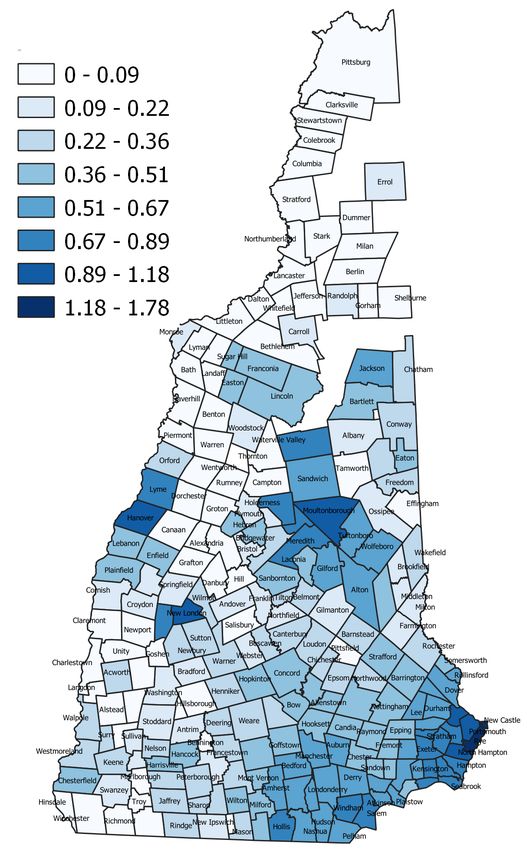
Josiah Bartlett Center for Public Policy & Center for Ethics in Society at Saint Anselm College

Residential Land-Use Regulations in
   New Hampshire: Causes and
          Consequences1
                                       Jason Sorens2

Executive Summary
     Why have house prices and rents increased so much in New Hampshire? This study finds
that residential land-use regulations, mostly at the local level, are a major cause. Examples of
local regulations that prevent people from building homes include: minimum lot sizes, frontages
and setbacks, single-family-only requirements, bureaucratic requirements for accessory dwelling
units, maximum heights and densities, minimum parking requirements, historic and village
district requirements, municipal land ownership, subdivision regulations, impact fees, and
simply the unwillingness of zoning boards to issue variances. Widely available measures show
that New Hampshire is one of the most restrictive states in the country for residential
development. By suppressing building, land-use regulations drive up the price of housing as
demand rises. Removing or relaxing these regulations would allow prices to rise more gradually.
     The consequences of housing scarcity for our state are significant. This study finds that
residential building regulations are associated with growing socioeconomic segregation and
slowing population growth. As housing becomes more expensive, fewer people are moving to
New Hampshire, especially to those towns that are most expensive. Those who stay are
disproportionately wealthy and college-educated, while middle- and lower-income families
leave because they cannot find affordable housing. Costly housing in towns with better schools
also limits families’ access to educational opportunity. Finally, the sprawl caused by anti-density
policies such as minimum lot sizes increases drive times and road maintenance costs and
worsens air and water quality.
     New Hampshire municipalities have enacted these restrictions on growth for several
reasons. First, there is a widespread perception that allowing home-building would increase the
number of children in local schools. However, the other side of the home-building equation is
that new home construction leads to substantial growth in the tax base, relieving the tax burden
on the rest of the town. Moreover, school populations are falling across most of the state, and
so adding more children would not necessarily require more spending. So the “fiscal” motivation
for restricting home-building does not make much sense today.

    1
      I wish to acknowledge helpful suggestions and comments from Andrew Cline and Max Latona and
research assistance from Brian Chen, Kerri Roy, and Sophia Pajakowski. All errors are my own.
    2
      Director, Center for Ethics in Society, Saint Anselm College, jsorens@anselm.edu.

                                                      2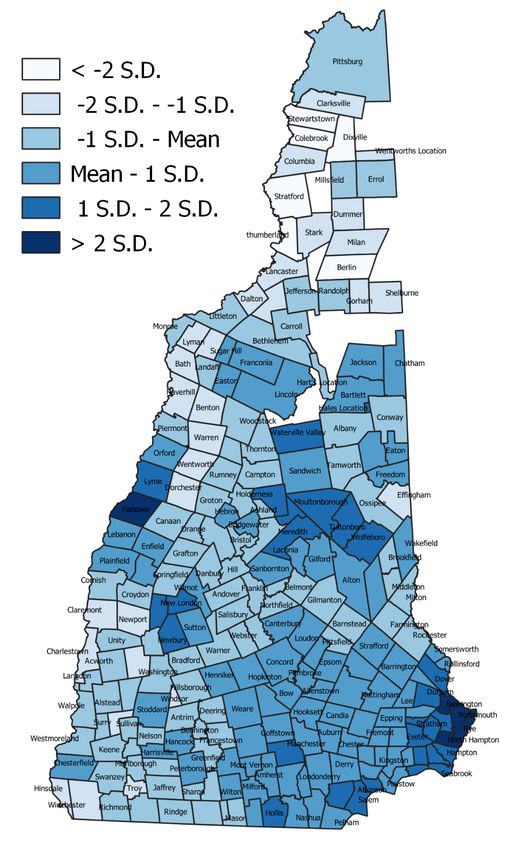
The main reason for growing development restrictions seems to be “rent-seeking.” In other
words, some homeowners in the towns with the biggest housing demand see zoning as a way of
boosting their wealth by artificially limiting the supply of housing. This process may have gotten
out of hand now, though, as pandemic-driven housing demand has well outstripped supply.
Many Granite Staters have seen their homes rise in value, but this rise may be merely notional,
because it is now so difficult to find a new house after selling the old one. The rapid aging of the
New Hampshire population makes reform to relax local planning and zoning regulations all the
more crucial.
    As the rent-seeking explanation would predict, the places with the most stringent rules on
building new homes tend to be the ones that historically saw big growth in housing demand.
Portsmouth, Hanover, and some of their surrounding towns are among the most regulated
towns in the state, along with a few Lakes Region and White Mountains locations. Some of the
wealthier suburbs of Manchester and Nashua – Hollis, Windham, and Bedford – are also near
the top of the list. By contrast, the inland Appalachian belt of New Hampshire, running from
western Cheshire County to the North Country, is the least regulated part of the state. There’s a
definite trend in the historical data, whereby towns that saw large growth in the 1960s and
1970s enacted restrictions that then choked off growth in the later 1980s and 1990s. By
contrast, population density does not seem to correlate with increases in regulatory stringency,
even though it may have been a motivation for towns to adopt zoning to begin with. Some of
the towns with the strictest rules have low densities and very little industrial activity, like
Hanover and Lyme.
    Another correlation observed in the data finds that towns that lie nearby other towns that
increased their restrictions on housing were themselves more likely to enact new restrictions on
housing. In other words, municipal land-use regulation in New Hampshire looks like a kind of
“arms race.” When one town tightens, others are also provoked to tighten so that they don’t get
a disproportionate share of new housing construction. As a result, all towns end up with less
construction and stricter regulations than they really want.
    To get out of the arms race and make decent homes affordable to Granite Staters of all ages
and walks of life, policymakers and citizens have to understand how local land use regulations
affect the supply and price of housing. Better policies will come from a better understanding of
the downstream effects of these regulations. In addition to showing how land use regulations
affect housing supply and prices, this study suggests several state- and local-level policy changes
that could provide relief. At the local level, zoning ordinances could be revised to allow homes
to be built on smaller lot sizes, with smaller frontages, and with smaller setbacks. Building
permit caps could be removed. Multi-family housing options, such as duplexes and triplexes,
could be allowed in additional locations. In urban areas, minimum parking and maximum height
restrictions could be eased. At the state level, the state could enact a regulatory takings
compensation law, so that municipal governments would have to compensate landowners for
new regulations that substantially take away the value of their property. The state could directly
preempt the most egregious forms of exclusionary zoning, such as minimum lot sizes above a
certain level and building permit caps. The state could also authorize towns to decentralize
planning authority to neighborhood or even block levels. At such a small level, residents are
unlikely to adopt rent-seeking forms of zoning, because builders and home-buyers could easily
go elsewhere. State government could authorize municipal land-use compacts that would allow
neighboring municipalities to offer multi-community planning, where the impacts of regulation
on the whole commuting area could be considered. Finally, an open-enrollment law for public
school choice would at least ameliorate one of the negative consequences of exclusionary
zoning for middle- and low-income families: being locked out of good schools.

                                                   3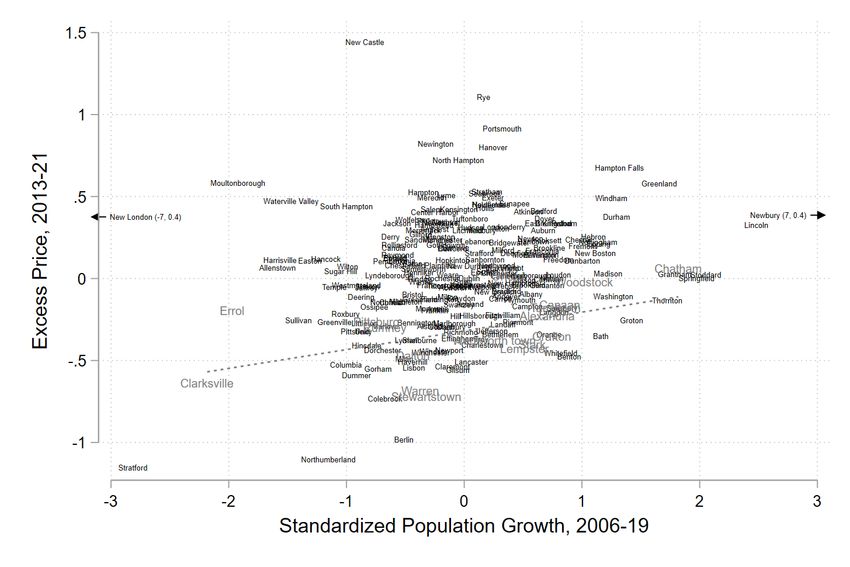
1 Introduction
     The housing boom and bust during the 2000s and the runup in housing prices in many
markets since then have gotten many economists and policy analysts thinking about why
housing has become so unaffordable in so many places. While strong demand for housing is
certainly part of the story, the crucial piece of the puzzle is the maze of costly regulations
property owners confront when trying to build new housing. By crushing new supply, many local
governments have put decent housing out of reach for the working poor and even middle-
income households.
     Over the last two decades, residential building regulations have become one of the hottest
topics in economic research. Economists have found that these regulations are the most
important factor determining differences in cost of living from place to place in the U.S. (Glaeser
& Gyourko 2002; Glaeser, Gyourko, & Saks 2005a; Glaeser, Gyourko, & Saks 2005b; Quigley &
Raphael 2005; Ihlanfeldt 2007; Molloy 2018). Accelerating house prices in tightly regulated
places drive away workers to places where regulations are milder and prices cheaper (Glaeser,
Gyourko, & Saks 2006; Glaeser & Tobio 2007; Saks 2008; Ganong & Shoag 2017). Because
workers cannot always afford to live where they are most needed, U.S. GDP may be 10 percent
lower than it would otherwise be (Hsieh & Moretti 2017).
     What are residential building regulations, and why do economists think they are so
important?
     Residential building regulations consist
of planning and zoning rules and decisions
affecting the building of new homes. The                   Residential building regulations
modern practice of zoning – dividing a
                                                       may reduce U.S. GDP by 10% (Hsieh &
jurisdiction’s territory into zones with
                                                       Moretti 2017).
predetermined rules for which types of land
use would be allowed in each zone – was
developed in Germany in the 1870s and
spread to the United States in the 1910s (Whitnall 1931; Gardner 2017). The familiar type of
zoning in which whole neighborhoods were set aside exclusively for detached, single-family
houses was pioneered by Los Angeles in 1920 (Whitnall 1931: 12). The United States and Canada
stand out as the only developed countries that use single-family, residential zoning districts; in
Europe, mixed-use development has always been accepted (Hirt 2014). Today, Houston is the
only large city in the U.S. without formal zoning, although its city council does promulgate land-
use regulations.
     This study investigates the economics of residential building regulations that reduce the
supply of new housing and applies research findings to New Hampshire. It turns out that New
Hampshire has some of the worst-offending municipal governments in the United States, and
the growth of red tape in housing development in this state helps to explain our slow growth
since the 1990s, our aging population, growing income segregation between our towns, and
escalating home prices in many of our communities.
     The sidebar on the right gives just a small sampling of the myriad regulatory requirements
on landowners that discourage home-building. While any one of these regulations taken
individually might seem reasonable or at least harmless, in total the detailed local planning and
zoning regulations around the state add significantly to the cost of building homes. Because so
few land uses are allowed “by right,” landowners must seek conditional use permits and special
exceptions, and planning and zoning boards can slow-walk these applications and require costly

                                                  4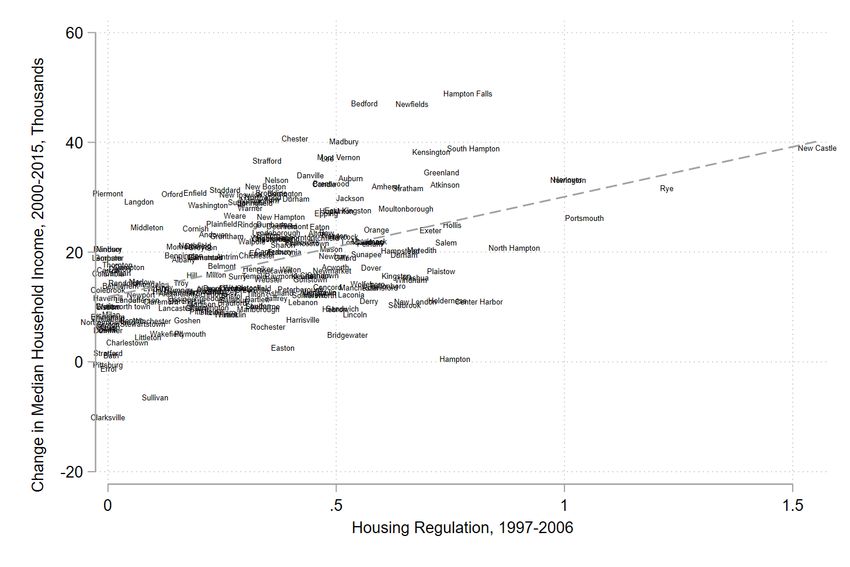
tests and reports. All these barriers add to the cost of
building homes, decrease the supply of housing, and raise            Examples of New
the cost.                                                         Hampshire
    The next section explains the three major motivations
for housing supply regulation, the theory and evidence on         Regulations That Limit
the effects of antigrowth zoning, and the political               Home-Building
motivations for antigrowth zoning. Section three turns to
New Hampshire and provides evidence on both the causes            •   Hanover’s zoning map
and consequences of antigrowth residential building                   prohibits housing, even
regulations. Section four sums up the key findings.                   by special exception, on
                                                                      nearly half of its land
                                                                      area and requires 10-
2 The Economics and Politics of Housing Supply                        acre minimum lot sizes
Regulation                                                            on much of the rest.
                                                                  •   Manchester prohibits
2.1 Rationales for Housing Supply Regulation                          housing of more than
     Fischel (2015) argues that zoning in the U.S. began as a         three stories or 45 feet
response both to the automobile, which made residential               in height.
neighborhoods physically separated from places of work            •   Rye requires providing
feasible for the first time in human history, and to the              two off-street parking
motorized truck, which made it easier for industrial                  spaces for homeowners
facilities to intrude into residential areas. Fischel refers to       that build an accessory
simple zoning that divides a jurisdiction into residential,           dwelling unit (ADU) and
commercial, industrial, and mixed-use areas as “good                  bans detached ADUs.
housekeeping zoning.” While the common law of nuisance
                                                                  •   Portsmouth has
and private deed restrictions are substitutes for this kind of
zoning (Siegan ), for the most part good-housekeeping                 historic, downtown,
zoning has been uncontroversial for decades.                          and character districts,
     A second motivation for regulation is so-called “fiscal          each of which overlays
zoning.” Hamilton (1975) shows that localities can use                and adds to the
zoning to ensure that new home-buyers pay a property tax              regulations of the
equivalent to their benefit from locally provided goods,              regular zoning districts,
rendering the local property tax an efficient user charge.            specifying detailed
For instance, local governments could require new                     aesthetic features of
developments to pay an impact fee to cover the cost of                the buildings and
extending public services and utilities. Localities may be            properties, such as the
more willing to allow age-restricted housing for the elderly          pitch of roofs, size of
than general single- or multifamily housing, because
                                                                      yards, and appearance
elderly households do not put children into local schools.
                                                                      of facades.
Regulations could also require minimum lot sizes or
minimum square footages in order to ensure that any new
homes built will be expensive enough to pay a hefty
property tax bill.
     New Hampshire law charges local planning boards to
“[p]rovide against such scattered or premature subdivision
of land as would involve danger or injury to health, safety,
or prosperity by reason of the lack of water supply,

                                                    5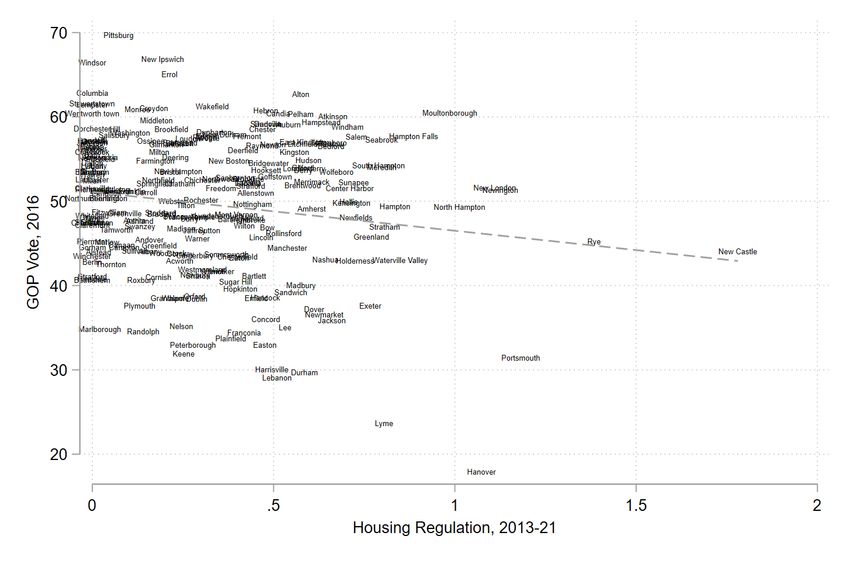
drainage, transportation, schools, fire protection, or other public services, or necessitate the
excessive expenditure of public funds for the supply of such services” (Vann 2018). If fiscal
zoning is done right, it reduces the overall property tax burden.3
    A third motivation for residential zoning is to raise the prices of existing homes, resulting in
a windfall for existing homeowners and possibly involving nakedly exclusionary motives toward
low-income and minority buyers. This kind of “rent-seeking” zoning is the most controversial.
Directly restricting new housing by capping
building permits, forcing houses to be
spread out (through minimum lot sizes and                 While antigrowth zoning raises
bans on multifamily homes and apartments),            rents and the prices of already-built
enforcing building codes arbitrarily, or              houses, it reduces average property
simply delaying development approvals can
                                                      values.
each raise the prices of existing homes if
demand is increasing.

2.2 The Effects of Rent-Seeking Housing Regulation

2.2.1 Theory
     For economists, the effects of regulation matter more than the motivations. When
regulation loads extra costs onto residential development, whether by simply making home-
building illegal in certain places or by adding delays and costly reviews, it restricts the growth of
the housing stock. The effects of growth-control regulation are easy to see in a simple supply
and demand framework (Figure 1) (Sorens 2018).
     In Figure 1, P1 and Q1 represent, respectively, the pre-growth equilibrium price and quantity
in the housing market, P* and Q* represent the post-growth equilibrium price and quantity of
housing without growth control zoning, and P2 and Q2 represent the post-growth equilibrium
price and quantity of housing with growth control zoning. Zoning can make housing supply
inelastic only above the pre-growth equilibrium, generating a kinked supply curve (Green,
Malpezzi & Mayo 2005: 334). Homeowners and governments in metropolitan areas that are not
growing cannot derive rents from limiting housing supply, but those in areas that are growing
can enjoy these rents from regulation. In growing areas, zoning raises the prices of homes and
reduces population, transferring wealth from new residents and local owners of developable
land to owners of already-developed land. Importantly, while antigrowth zoning raises rents and
the prices of already-built houses, it reduces average property values in a jurisdiction, because
the losses to landowners who are prevented from developing new housing exceed the gains to
people who already own houses (Fischel 2001).

    3
     Vann, a New Hampshire urban planner and legislator, argues that by prioritizing large-lot
development over infill development, most New Hampshire towns are failing to get fiscal zoning right.

                                                      6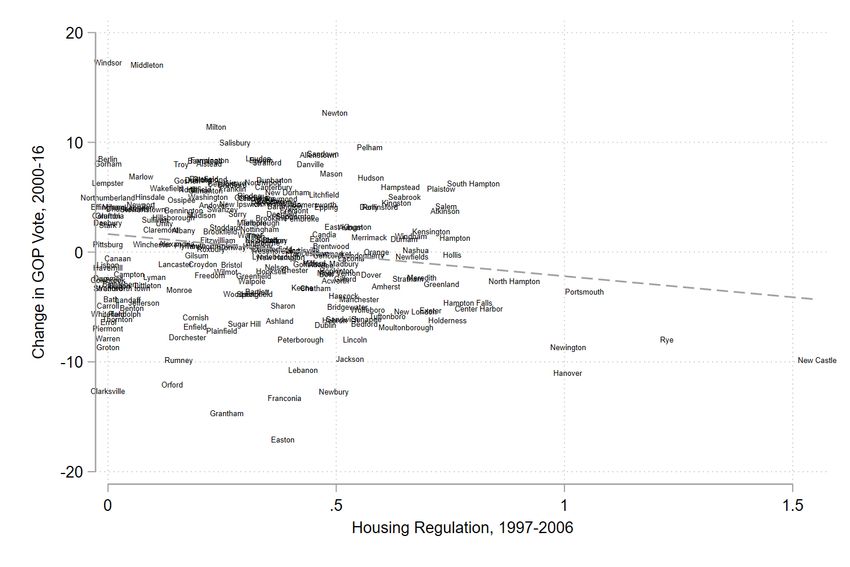
Figure 1: Effects of Growth-Control Housing Regulation
     Rent-seeking, antigrowth zoning will not work if the local jurisdiction lacks monopoly power.
If there are many, interchangeable local jurisdictions in a metropolitan area, for instance, home
buyers can simply go to jurisdictions with more relaxed regulations (Hamilton 1978; Fischel
1980, 1981). However, some jurisdictions may enjoy monopoly power because they host
important employers or rare amenities that home buyers seek. The evidence below will show
that New Hampshire municipalities with immobile employers, such as universities and state
government offices, feature much more restrictive zoning regulations.
     Rent-seeking zoning therefore causes some places to have more expensive housing and
slower population growth. Between two equally desirable locations, the less regulated location
will have more affordable housing and faster growth. Prices do not equalize between the two
locations so long as the more expensive location has some amenities or attractive employment
opportunities that are not available in the cheaper location, causing some households to be
willing to pay the higher price to live in the more costly place (Roback 1982; Chen & Rosenthal
2008).
     In general, wealthier households will be more
willing to pay to live in more regulated jurisdictions
than lower-income households, because housing
makes up a smaller share of their household                      “Anything not related to
budget. As Ganong & Shoag (2017: 78) point out,              health or safety is a tax on new
“Lawyers continue to earn much more in the New               housing construction.”
York area in both nominal terms and net of housing
costs, but janitors now earn less in the NY area
after housing costs than they do in the Deep South. This sharp difference arises in part because
for lawyers in the New York area, housing costs are equal to 21 percent of their income, while
housing costs are equal to 52 percent of income for New York area janitors.”
     How does rent-seeking housing regulation affect the distribution of house prices and rents?
If regulation effectively represents a per-unit tax on housing construction, it should make
smaller, affordable projects less attractive to buyers, less profitable, and therefore less widely
available, per Alchian & Allen’s (1964) famous theorem. A recent Union Leader story was
revealing on this score:
             “Atkinson builder Steven Lewis said some towns use zoning ‘to socially engineer
         communities to keep lower-income people out,’ such as requiring larger setbacks that

                                                  7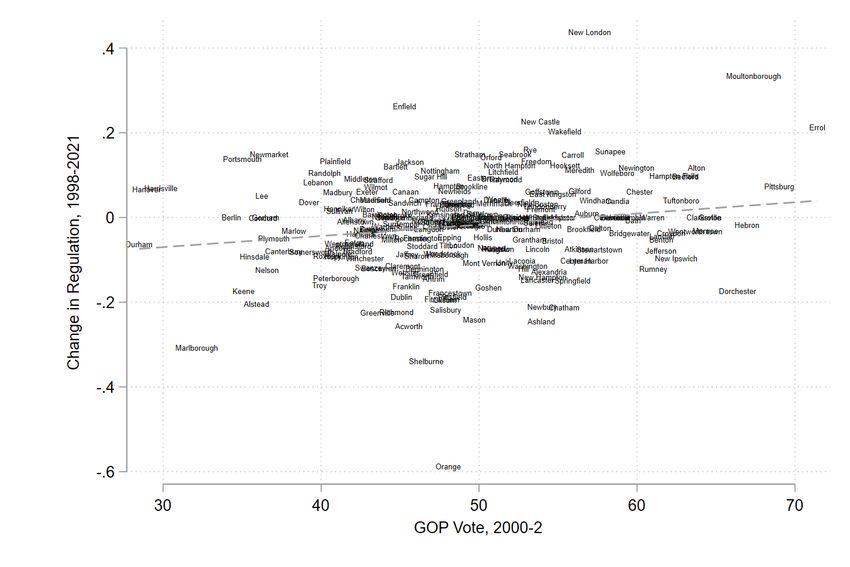
increase a house’s costs. He said ‘needless regulations’ boost the price of a new home
       by at least 25 percent. ‘Anything not directly related to health and safety is a tax on
       new-house construction,’ Lewis said. . .
           “Moe Archambault, a real estate broker who has marketed new homes in
       developments in Hooksett and Dunbarton, said things have changed over the past 15
       years. Some towns now ‘want granite curbing and underground utilities and sidewalks’ -
       - costs that get built into home prices. New homes, he said, are difficult to build for
       much less than $300,000 today.”4
   We should therefore expect more strictly regulated municipalities to have higher-quality
housing stock and less available for buyers at the bottom end of the market.

2.2.2 Nationwide Evidence
    The economic literature finding that stricter zoning regulations raise housing costs is
voluminous (Glaeser & Gyourko 2002; Glaeser, Gyourko, & Saks 2005a; Glaeser, Gyourko, &
Saks 2005b; Quigley & Raphael 2005; Ihlanfeldt 2007; Molloy 2018). In a recent literature
review, Molloy (2018) points out that while the relationship between zoning and average
housing costs is well established, the effect of zoning on housing affordability at the lower end
of the housing market is less well known, although the existing evidence is consistent with
theory: regulation particularly reduces the affordability or available quantity of the bottom end
of the housing market (Malpezzi & Green 1996; Charles 2013).5 This section of the paper
presents some data visualizations to make the relationship clearer.
    Figure 2 shows the relationship between each state’s residential building restrictions in the
mid-2000s, as measured by the Wharton Residential Land Use Regulatory Index (WRLURI)
(Gyourko, Saiz, & Summers 2008), and 2007 cost of living, as measured by the Bureau of
Economic Analysis’ (BEA) state price parities.6 The WRLURI includes the number of entities
whose approval is required for development to proceed, minimum lot sizes, typical approval
process time, public and political involvement in the approval process, hard building permit
caps, open space requirements, affordable housing requirements, and impact fees as measures
of regulation.

    4
      Union Leader New Hampshire Sunday News, October 7, 2018, p. 3.
    5
      The effect of housing regulation on rents is smaller than that on sale prices but still positive
(Malpezzi 1996; Green 1999; Xing, Hartzell, & Godschalk 2006).
    6
      The WRLURI comes from a survey of municipal and county officials from hundreds of jurisdictions
conducted in 2005 and 2006. No more recent study has been conducted.

                                                      8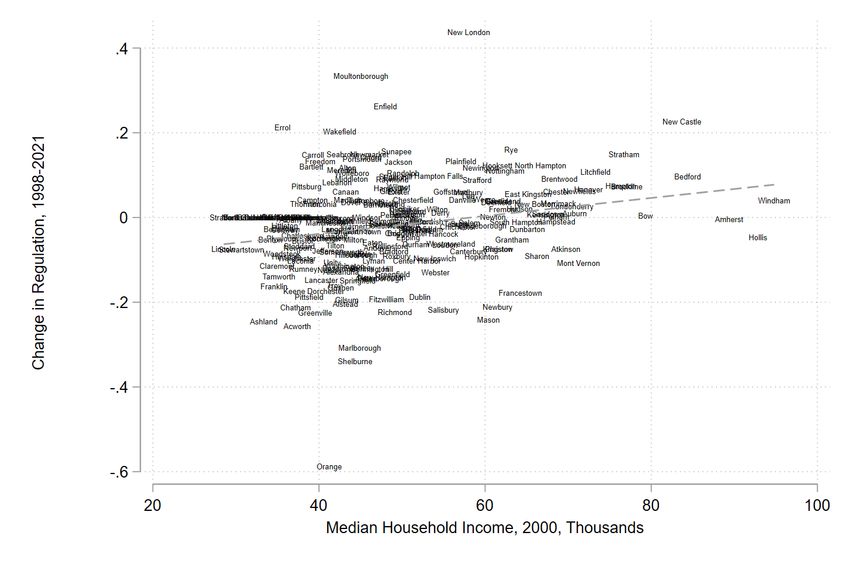
Figure 2: Zoning and Cost of Living in the 50 States

                         9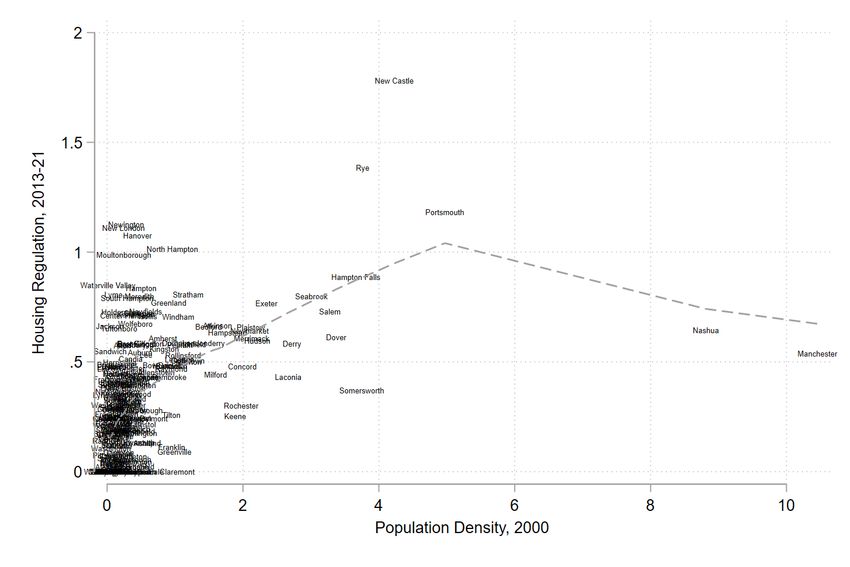
According to the WRLURI, New Hampshire was the fourth most regulated state for
homebuilding and the eighth most expensive state in the country just over a decade ago.7
Hawaii, Rhode Island, Massachusetts, and New Jersey, in that order, were the other top-five
states for housing regulation. Today, New Hampshire remains the eighth most expensive state,
with a general cost of living 5.9 percent above the national average.8
    The relationship between housing supply
regulation and cost of living over all 50 states is
extremely strong and positive. As we have seen,
there are good reasons to believe that a causal                  According to Wharton
effect of regulation on prices is responsible for this       School researchers, New
relationship, implying that by reducing zoning
                                                             Hampshire was recently the
restrictions, New Hampshire could substantially cut
                                                             fourth most regulated state for
the cost of living for thousands of families.
    High cost of living should drive families out of         housing. We are also the eighth
state, particularly non-wealthy families. A simple           most expensive state in the
bivariate correlation between cost of living and net         country.
migration would understate the harmful effects of
residential building restrictions, because only jurisdictions that expect to experience growth
have any incentive to adopt rent-seeking zoning, because only when demand is growing can
homeowners get a windfall by limiting new housing. Still, states that have stricter homebuilding
regulations experience net out-migration (Figure 3). The Y axis in Figure 3 represents the net
domestic migration rate, that is, the number of people moving to a state from other states
minus the number of people moving out of state to other states, between July 1, 2007 and July
1, 2014, divided by the number of residents as of July 1, 2007.
    The fact that people are moving from more regulated to less regulated states is remarkable,
since a past history of net migration encourages more regulation. The expense of living in
regulated states suggests that these states are desirable locations; demand for housing is high.
Net migration is negative because low- and average-income households make the decision to
leave these costly states, while high-income households stay or even come in. The former group
outnumbers the latter by a wide margin, making net out-migration consistent with high housing
cost, a combination that would otherwise be paradoxical since it would suggest that less
desirable states (to migrants) are more desirable (to housing demanders).

    7
       According to the most recent data from 2016, New Hampshire is still the eighth most expensive
state in the country (excluding District of Columbia).
     8
       Bureau of Economic Analysis, “News Release: Real Personal Income for States and Metropolitan
Areas, 2016,” May 17, 2018, https://bit.ly/2t1TRrZ.

                                                     10
Figure 3: Zoning and Net Migration in the United States
Figure 3 also shows that there are a few high-amenity and business-friendly states without
strict building regulation: these states have much higher net in-migration rates than would be
expected given their level of housing regulation. Colorado, Arizona, Nevada, and Oregon are
examples of states with high household-demanded amenities but not the highest levels of
building regulation. In-migration to the Dakotas, the Carolinas, Wyoming, Delaware, and Texas is
probably better explained by business environment than household-demanded amenities. Note
that New Hampshire lost people during this time period, a stark reversal of the 1970s to 1990s,
when the state was a major migration destination.
The true effect of zoning on net migration is far more negative than it appears in Figure 3
because of the reverse-causation problem already described. Saks (2008), Zabel (2012), and
Ganong & Shoag (2017) all show that housing regulation deters Americans from moving to high-
cost localities and states. Ruger & Sorens (2018) have investigated the causal effect of cost of
living on net interstate migration using spatial multiple regression to control for other factors
that drive migration. If we control for other features that make a state attractive to migrants,
such as climate, crime rates, taxes, and capital stock, then we should get a less biased estimate
of the true effect of cost of living on migration.9 Using the estimates from their state-to-state
9
We should not control for employment or income growth, because these variables are as much
effects of migration as they are causes. In the language of statistics, they are endogenous.
11migration models, Ruger and Sorens (2018: 139)
find that a standard-deviation increase in state i’s Residential land-use
cost of living relative to state j is associated with regulations that raise cost of
net out-migration from state i to state j of 0.026 living may reduce immigration
percent of the average of the two state’s
from other states.
populations in the pre-Great Recession period
(2001 to 2008) and of 0.017 percent in the post-
Great Recession period (2008 to 2017). We can
infer that reducing New Hampshire’s zoning restrictiveness so as to cause cost of living to fall by
a standard deviation, still leaving it higher than the average state’s, could increase in-migration
to New Hampshire over the next nine years by roughly 0.00017*325000000=55,250 people.
Zoning restrictions drive non-wealthy households out of the area, which should in turn
cause per capita income to rise among those residents that remain. Figure 4 shows the
relationship between the WRLURI and per capita income across states in 2007, not adjusted for
differences in cost of living across states.
States with more restrictions on homebuilding have higher per capita incomes, not because
they are somehow more economically productive, but because they tend to drive non-wealthy
households out of state. This evidence suggests that New Hampshire’s high cost of living and
tight zoning restrictions are particularly harmful to middle- and lower-income families.
2.2.3 Housing Supply Regulation, Class and Race Segregation, and Educational Inequality
Because housing supply restrictions drive out lower-income households, and the public
school system in the United States is still largely based on geographically assigned districts,
housing supply restrictions tend to force children from lower-income families into income- and
race-segregated schools that tend to be lower-performing, limiting their opportunities for
upward socioeconomic mobility. Neighborhood racial and class segregation indicators tend to
be worse in metro areas with stricter residential zoning, especially minimum lot size regulations
(Rothwell & Massey 2010; Rothwell 2011).
12Figure 4: Zoning and Per Capita Income in the 50 States
In a study for the Brookings Institution, Rothwell (2012: 1) finds that “Northeastern metro
areas with relatively high levels of economic segregation exhibit the highest school test-score
gaps between low-income students and other
students. Controlling for regional factors such as
size, income inequality, and racial/ethnic diversity
associated with school test-score gaps, Southern Eliminating exclusionary
metro areas such as Washington and Raleigh and zoning in a metro area would
Western metros like Portland and Seattle stand reduce its housing cost gap and
out for having smaller-than-expected test score therefore its school test-score
gaps between schools attended by low-income gap (Rothwell 2012).
and middle/high-income students.” Moreover,
“housing costs an average of 2.4 times as much, or
nearly $11,000 more per year, near a high-scoring public school than near a low-scoring public
school,” and “[l]arge metro areas with the least restrictive zoning have housing cost gaps that
are 40 to 63 percentage points lower than metro areas with the most exclusionary zoning.”
Therefore, eliminating “exclusionary zoning in a metro area would, by reducing its housing cost
gap, lower its school test-score gap by an estimated 4 to 7 percentiles.”
2.3 The Politics of Rent-Seeking Zoning
Why are incumbent homeowners able to transfer wealth to themselves from landowners
and new residents through growth-control zoning in some contexts but not others? Texas, the
Carolinas, the Dakotas, Florida, Arizona, and Nevada have kept the door open to new migrants
and made it easy to develop new housing stock, while New England, New Jersey, and California
have not.
Fischel (2001) argues that the strength of the “homevoter” coalition at the local level
determines the stringency of housing regulations. In rural contexts, the median voter owns
13developable land and opposes rent-seeking zoning. Therefore, regulation either does not exist
or has a light touch in rural areas. As already mentioned, there is also no rent-seeking incentive
to restrict new housing in places where there is little demand for new housing (Saiz 2010). In
large cities and in states where counties, not municipalities, make land-use decisions,
homeowners prefer strict zoning laws, but they are usually unable to influence the local political
process, unless state government has expressly empowered them to do so, as in California. But
in growing suburban and small-town jurisdictions where municipalities make land-use decisions,
the homevoter coalition has both the incentive and the power to seek restrictive zoning.
For Fischel, homevoter power has at least as many upsides as downsides. Homevoters
closely monitor their local governments for performance because they know their property
values depend in part on the efficiency of local government, and the decentralization of
spending and taxation decisions to the municipal level allows would-be residents an ample
menu of public service and tax burden mixes (Tiebout 1956). Precisely in those places where
local government is most responsive to taxpayers and most efficiently provides its services, local
governments are also most susceptible to exclusionary or rent-seeking zoning.
Fischel is a Dartmouth economics professor and has served on the Hanover zoning board. It
is likely that the New Hampshire experience informed his development of the “homevoter
hypothesis.” As the next section reveals, his hypotheses about the politics of zoning fit New
Hampshire particularly well.
2.4 Conclusions from Prior Research
Strict residential building regulations reduce population growth in attractive areas and raise
the cost of housing. As a result, they transfer wealth away from new residents, landowners, and
builders toward owners of existing homes and may particularly reduce the supply of affordable
housing for purchase. Further consequences include an increase in per capita income in more
regulated jurisdictions, as lower-income households are more likely to move away to avoid
housing costs, more class and racial segregation in neighborhoods, more educational disparity
across jurisdictions, and significantly lower total GDP due to spatial misallocation of labor.
New Hampshire has some of the strictest residential building restrictions in the United
States, particularly in the southeastern suburbs, White Mountains, parts of the Lakes Region,
and the towns closest to Dartmouth College. These restrictions likely account for the state’s low
population growth and more sluggish than usual economy since the early 2000s.
In the next section, I explore the extent to which residential building restrictions differ
across jurisdictions in New Hampshire. These data can be used to explore which towns are
suppressing affordable housing, with possible consequences for state policies to address the
problem.
3 Residential Building Regulation in New Hampshire
3.1 Previous Measures of Land-Use Regulation
There have been several attempts to measure the extent to which regulations prevent
homebuilding. The Glaeser and Gyourko (2002) approach is to compare actual house prices to
the price of construction, referring to the difference as the “land-use tax.” The flaw in this
approach is that surges in housing demand could cause prices to rise even if supply is not
constrained by regulation, since it takes time to build houses. Nevertheless, the core intuition
behind this approach makes sense and can be improved upon.
14The WRLURI developed by Gyourko et al. (2008) is based on a survey of local officials. It asks
them about the presence of several different land-use regulation tools, ranging from impact fees
to minimum lot sizes and building permit caps, as well as the activism of homeowners on
proposed developments in their area. One problem with this approach is that it crams together
several factors that are not really regulations at all, such as local homeowner activism. Another
is that it cannot possibly incorporate all the myriad tools local governments have at their
disposal for slowing down or discouraging new housing. It is well known that, regardless of the
planning regulations on the books, zoning boards have at their disposal a broad menu of
stratagems to kill projects they dislike, such as mandating costly environmental and traffic
impact studies. In New Hampshire, planning boards write the ordinances and zoning maps, and
zoning boards grant variances, but zoning boards’
attitudes toward new projects are not measurable.
Furthermore, even the regulations themselves do
not have straightforward interpretations without Regardless of the planning
complex local knowledge. For instance, a one-acre regulations on the books, zoning
minimum lot size in a rural zone might impede few boards have a broad menu of
projects, while the same restriction in an urban
stratagems to kill projects they
cluster could bring all new residential
dislike.
development to a halt.
Two economists have developed a new
measure for the state level: the number of state
appellate court decisions since 1920 containing the phrase “land use,” divided by state
population (Ganong & Shoag 2017). The idea is that states with more regulation will have more
lawsuits over land use. This is the noisiest measure of all for comparing states, but it has the
virtue of being available over time, and the authors show that it correlates reasonably well with
other measures of land-use regulation. It is worth mentioning that by this measure, New
Hampshire is the fifth most regulated state in the country, as of 2017. Thus, both of the widely
used measures of residential land-use restrictions show New Hampshire as one of the five most
regulated states in the country.
Sorens (2018) introduced a new measure of residential building restrictions for New
Hampshire. This measure does not rely on a dubious summary of on-the-books regulations but
instead improves upon the Glaeser and Gyourko (2002) approach of measuring the “land-use
tax” on the price of a home. The next section describes the approach and the data used.
3.2 Measuring Housing Supply Restrictions in New Hampshire
My approach develops an economic proxy for housing supply elasticity – the responsiveness
of housing supply to price – for every local jurisdiction in New Hampshire with sufficient data.
The first step in building this variable is to come up with an estimate of excess price, the extent
to which a typical home sells for more in a town than it would elsewhere in the state. To do this,
I collected nearly the whole population of single-family home sales that were publicly listed for
the period from January 1, 1998 to July 29, 2021 from redfin.com, then limited the dataset to
houses with at least one bedroom, one bathroom, 700 square feet, and a price of at least
$10,000.10
10
In addition, obviously miscoded observations with absurdly low square footage per bathroom or
bedroom, absurdly large square footage or lot sizes, and square footage larger than lot size were
dropped.
153.2.1 Excess House Price by Town
The strategy for coming up with an excess price measure by town works as follows. First, I
build a statistical model of house sale price to get unbiased coefficient estimates on house
features such as square footage and age. Then I use those coefficient estimates to get a
predicted value for each house sale in the dataset. Then it is possible to calculate an excess price
measure for each house, that is, the actual sale price minus the predicted sale price. Finally, the
excess price is averaged over all house sales for each town and each period. There are three
periods: 1998 to 2006, corresponding to a general rise in house prices, 2007 to 2012,
corresponding to a general decline in house prices, and 2013 to 2021, another upswing in the
house price cycle. (Multiple years are taken to ensure sufficient sample size of home sales even
in small towns.) This is the measure of “excess price.” In essence, it measures how expensive
houses are in town relative to the prices they should command given their characteristics.
Once the dataset of house sales was appropriately pared down, I built a log-linear statistical
model of sale price:
ln($%&'(! ) = +" + -# + .$ ln(/(0%1123! + 1) + .% ln(/67ℎ%1123! + 1) +
.& ln(9:;7! + 1) + .' ln(?(! + 1) + .) @A%%(B7C3(DE&?&FE(! ,
where i subscripts each sale, j each jurisdiction, and t each year, and + and - are vectors of
coefficient estimates on matrices of year and jurisdiction dummies, respectively.
@A%%(B7C3(DE&?&FE( is a dummy variable for lot sizes greater than 10 acres, which can qualify
for property tax reductions under New Hampshire law. The regression results are displayed in
Appendix Table A2 (the town and year dummies are not reported).
Newer houses with more bathrooms, more square footage, bigger lot size, and current use
eligibility sell for more, unsurprisingly. These coefficient estimates are used to create the excess
prices for each house sale. Then the house sale excess prices are averaged by town and time
period, as described above.
Figure 5 is a standard deviation map of excess price for all New Hampshire towns with data
for the 2013–2021 period. Stratford, Northumberland, and Berlin in Coös County emerge as the
most affordable towns in the state, while New Castle and Rye on the Seacoast are the least
affordable. Other especially unaffordable towns are Portsmouth, Newington, and “the
Hamptons” on the Seacoast, Hanover and Lyme in the Dartmouth College area,
Moultonborough on Lake Winnipesaukee, and Hale’s Location, a tiny mountain township
comprised mostly of a golf course community.
16Figure 5: Standard Deviation Map of Excess Price by New Hampshire Town, 2013–2020
To get a handle on the numbers involved, consider that the average single-family house
price during this period was $305,318. The statistical model suggests that an equivalent house in
Hanover would have sold for $678,819. In Glaeser and Gyourko (2002) terms, that means the
“land-use tax” on this house in Hanover amounts to 122%.
Another way to think about the data is to see what price the model predicts for an
affordable-type home and then see what that type of home would have cost in particular towns.
Consider, then, a house on a half-acre lot, built in 1950, with three bedrooms and one and a half
bathrooms and 1,500 square feet, and sold in 2020. In towns like Keene, Warner, Conway, and
17Rochester, all right around the statewide average, this house would have cost about
exp(7.32 − 0.07 × ln 71 + 0.008 × ln 4 + 0.315 × ln 2.5 + 0.508 × ln 1501 +
0.035 × ln 21701 + 0.93) ≅ $223,000. In Hanover this house would cost about $496,000, in
Portsmouth $556,000. New Hampshire’s two
largest cities are more reasonable. This
house would cost about $283,000 in
In towns like Keene, Warner, Manchester and about $315,000 in Nashua.
Springfield, and Rochester, all right These differences across localities partly
around the statewide average, this reflect the impact of planning and zoning
house would have cost about regulations and geographic limits to
$223,000. In Hanover this house homebuilding like steep slopes and public
would cost about $496,000, in lands, but they also reflect demand and
Portsmouth $556,000. unobserved characteristics of houses that
vary systematically from place to place.
Manchester has been losing population to
the suburbs since at least 1930, while Nashua has been growing. Moultonborough, Center
Harbor, and Sunapee have many expensive lakefront homes, while Rye, New Castle,
Portsmouth, and Hampton have oceanfront homes. Waterville Valley’s population lives next to a
major ski resort. These unobserved factors in the model help drive demand and higher prices.
To measure restrictions on housing supply, then, I try to net out the impact of differential
demand growth across localities. The next section explains the method.
3.2.2 Housing Supply Elasticity by Town
As Figure 1 showed, housing price reflects the interaction of demand and supply. If demand
is growing, prices rise provided housing supply is at all inelastic. Between two locations with
equally rapid demand growth, actual quantity of housing supplied is lower and price is higher in
the location with less elastic housing supply. Assuming that less elastic housing supply largely
reflects the impact of planning and zoning regulations and decisions, we can estimate a locality’s
underlying attitude toward residential development by estimating both quality-adjusted price
(performed in the previous section) and growth in quantity of housing supplied and demanded.
A rough estimate of quantity of housing supplied and demanded is population growth.
Suppose a town’s population is growing rapidly and its measured excess price is high. We should
infer that the town’s high excess price of housing might simply reflect, at least in part, strong
growth in housing demand. To see how much of the impact is due to growth in housing demand,
we should compare this town to others with similar population growth. Is excess price similarly
high in other fast-growing towns?
We can try to estimate the “free-market” relationship between town population growth and
excess price by looking specifically at those towns that lack zoning altogether. We know that
housing development is less regulated in these towns, and so the statistical relationship
between population growth and excess price in these towns is our best guess at the relationship
that would prevail in the absence of planning and zoning regulations.
This relationship is expressed in a formula, which allows us to predict the free-market excess
price that “should” prevail in each town given in its growth in quantity of housing demanded. To
the extent that a town has a higher excess price than this predicted amount, we can infer that
the difference is largely a result of inelastic housing supply caused by residential building
restrictions.
Figure 6 is a scatter plot of average excess price by town from 2013 to 2021 against the log
ratio of 2019 population to 2006 population. I used the 2006 to 2019 population growth
18because 2006 was the peak of the last housing cycle, and pent-up demand from growth during
the falling-prices period of 2007 to 2012 would likely show up in house prices once they started
rising again due to the strong economy. Towns without zoning are highlighted, and the dashed
line expresses the estimated statistical relationship between the two variables only for these
towns. There is a modestly positive relationship between quantity demanded growth and excess
price among these towns. The measure of housing regulation used in this study is given by each
town’s difference between its excess price and this line of best fit, with towns below the line of
best fit set to zero (it is not possible, presumably, to have negative housing regulation).
Unsurprisingly, no-zoning towns have low prices, even when they are growing rapidly.
Now imagine that Figure 6 is divided into four quadrants. In the upper left are towns with
slow population growth from 2006 to 2019 and with higher than average excess price. In the
bottom left are towns with slow growth and lower than average excess price. In the top right are
towns with fast growth and high prices, and in the bottom right are towns with fast growth and
low prices. We can be most confident that upper-left towns have barriers to residential building:
they have high prices despite sluggish demand. We can be most confident that bottom-right
towns have loose restrictions on residential building: they have low prices despite rapidly
growing demand. But as it turns out, the relationship between demand and price is fairly flat,
and so towns in the upper-right mostly have tight restrictions too, and towns in the bottom-left
have mostly loose restrictions.
By extrapolating the line to all observed values of population growth, we can come up with
a predicted value of excess price for every town under the counterfactual of no zoning, as well
as a residual value. That residual is the index of housing regulation: it represents how much
more expensive a town is than expected given both the characteristics of housing and its
population growth. By performing this same exercise for excess price over the 1998 to 2006
period against population growth from 1997 to 2006, I can create an index of housing regulation
for the last period of rising house prices as well.
Figure 7 maps housing regulation for New Hampshire localities for the last nine years. It is
not much different from the map of excess price (Figure 5). The same geographic patterns
19Figure 6: Excess Price and Population Growth by New Hampshire Town; Towns Without Zoning in Light Gray Typeface
20Figure 7: Map of Housing Regulation by New Hampshire Town, 2013–2021
observed in Figure 5 are apparent here. Regulation is most stringent in the southeast, Lakes Region, Dartmouth
College area, and White Mountains. It is least stringent in the southwest, especially Sullivan County, and the north,
especially Coös County. Note that regulation may be slightly overstated in those communities where there are
21geographic barriers to building, such as steep slopes or extensive public land, especially the White Mountain National
Forest. On the other hand, public land ownership could be considered a type of residential land-use restriction.
Appendix Table A1 shows all the jurisdictions in New Hampshire with data, displaying their housing regulation score,
change in regulation since the 1997–2006 period, excess price, ratio of 2019 to 2006 population, and 2015 median
household income from the Census Bureau’s American Community Survey. The “regulation change” measure should be
taken with a grain of salt, especially for smaller communities that might have had only a few home sales in each period,
because the figures could be sensitive to outliers.
The least regulated jurisdictions for homebuilding tend to be rural, but that is not universally the case. Towns like
Andover, Salisbury, Springfield, Webster, Grafton, Canaan, and Grantham are desirable bedroom communities near
employment centers, but have managed to accommodate population growth without escalating house prices.
Tamworth in the Lakes Region and Fitzwilliam in the Monadnock Region each have more than 2,000 people, are growing
significantly, and have maintained less regulation than their neighbors. The suburbs of Manchester and Nashua tend to
be pricey and regulated, but even here we can point to Weare and Dunbarton, and to a lesser extent Hooksett and
Milford, as communities that have accommodated more housing. In Rockingham County, Northwood is by some
distance the least regulated community. It maintains reasonable affordability compared to the rest of the state while
growing.
Among municipalities that are more densely populated than the state average, Hinsdale, Claremont, Greenville, and
Franklin are the least regulated for housing. These are generally considered “blue-collar” towns. After all, places that do
not expect strong housing demand have no reason to try to limit new housing supply. But some relatively well-to-do,
densely populated communities, like Belmont, Pembroke, and Hooksett, have still been relatively open to housing,
compared to the cities of Concord, Manchester, and Nashua, to say nothing of places like Portsmouth, Hanover, Exeter,
Salem, Windham, Bedford, and Hollis.
In the next section, I investigate the causes and consequences of residential building restrictions in New Hampshire.
3.3 The Causes and Consequences of Residential Building Restrictions in New Hampshire
3.3.1 Income Segregation
As a cursory perusal of Table A1 reveals that towns with stricter housing regulations have higher median household
income. This correlation fits with the prior economic research that has found a relationship between zoning and income
and racial segregation (Rothwell & Massey 2010; Rothwell 2011).
But correlation does not necessarily imply causation. Does regulation change household income, or does household
income change regulation? Perhaps richer towns are more likely to adopt new planning and zoning codes to keep their
towns the way they are.
To investigate causation, I looked at how regulation in the earliest period correlates with change in household
income, and how household income in the earliest period correlates with change in regulation.
Taking the former relationship first, Figure 8 plots change in median household income from 2000 to 2015 against
regulation in the 1997 to 2006 period. The relationship is strong and positive. The regression coefficient is highly
statistically significant.
By comparison, Figure 9 plots change in regulation against initial median household income. This relationship is
weaker but still discernible, and the weakness of the relationship may have something to do with the noise in the
“regulation change” variable already discussed. It is a statistically significant relationship once municipalities are
weighted by population to deal with small-population outliers.
22Figure 8: Housing Regulation and Change in Median Household Income by Town
These findings are consistent with the hypothesis that richer towns are more likely to tighten zoning regulations but
especially confirm that tight zoning regulations drive out lower-income households, making a town appear richer.
A more sophisticated approach to this question is multiple regression analysis controlling for other factors that may
influence change in household income. The first factor we may wish to control for is the previous level of median
household income. If towns are already in the process of segregating by income, then towns that are richer in 2000 will
tend to become even richer over the next 15 years, while towns that are poorer in 2000 will tend to become even
poorer over the next 15 years. We may also want to control for population density in a town and in its neighbors. If
richer residents tend to flee central cities for suburbs, perhaps own-town population density would be negatively
associated with income change, while nearby-town density would be positively associated with income change. A final
factor we may want to control for is politics. Perhaps more Republican or more Democratic towns tend to change in
income due, for instance, to local policies that prevail in different areas, such as property taxes and school spending.
23Figure 9: Median Household Income and Housing Regulation Change by Town
The multiple regression model of change in household income therefore looks like this:
∆"#$%&'!"#$$ = * + ,! "#$%&'$$ + ,% -'./0123%#&'$( + ,) 4'#5326$$ + 7* 84'#5326$$ +
," -'9/:03$1#$$$% ,
where W is a row-standardized, inverse-distance-weighted spatial weights matrix with a 20-mile cutoff.11 Republican
represents the towns’ average percentage of the vote for Republican candidates for Governor and President in 2000 and
U.S. Senate in 2002 (there was no U.S. Senate race in 2000). The dependent variable is measured in thousands. The
estimates presented below are derived from spatial error models, in which the residuals are assumed to be spatially
dependent.
Appendix Table A3 shows results of multiple regressions with different sets of control variables. No matter what
variables are controlled for, initial housing regulation remains strongly statistically significant in a model of change in
median household income by town. The coefficient estimate from the model with full controls implies that a standard-
deviation increase in regulation is associated with a more than $2,000 increase in median household income over the
next 15 years.
11
Intuitively, this means that WDensity is a weighted average of nearby towns’ population densities, where the weights are
each town’s distance to the “own town,” measured as distance between geographic centers (“centroids”), and towns with centroids
greater than 20 miles away are not included.
24Meanwhile, richer towns continue to get richer. For every additional $1,000 in median household income in 2000
(“Lag income” in the table), a town gained $293 in additional median household income over the next 15 years. Land-
use regulations appear to be exacerbating income segregation by driving low- and middle-income households out of
richer towns.
In the next section, I turn to an investigation of the causes of home-building regulations in New Hampshire towns. If
it is not simply a matter of richer towns regulating
more, what is going on? This analysis could help
us gain a better understanding of how to fight
excessive regulation at the local level. Land-use regulations appear to be
exacerbating income segregation by driving low-
3.3.2 The Politics of Land-Use Regulation
and middle-income households out of richer
in New Hampshire
towns.
3.3.2.a Partisanship and Land-Use Regulation
One of the first hypotheses we might wish to
investigate is the effect of politics in the partisan sense on land-use regulation. Are Republican or Democratic towns
more likely to intensify restrictions on home-building?
Figure 10 shows the relationship between Republican statewide candidates’ vote share in the 2016 presidential
election year and housing regulation in the most recent period. It is a noisy but obvious, negative correlation.
Still, correlation does not necessarily imply causation. Did strict zoning regulations affect which party’s voters tend
to live in a municipality, or did partisanship drive the adoption of zoning regulations?
We cannot run an experiment to answer this question, but we can look at the timing of changes in zoning
restrictiveness and partisan voting to see which variable is more likely to drive the other. Figure 11 shows the
relationship between Republican vote share in the early 2000s and subsequent change in zoning restrictiveness, while
Figure 12 shows the relationship between zoning restrictiveness in the late 1990s and early 2000s and subsequent
change in Republican voting.
There appears to be slight, positive relationship between Republican partisanship early on and subsequent
tightening of regulation, but it is weak and noisy. There is a much stronger relationship between initial zoning
restrictiveness and subsequent shifts toward Democratic voting, consistent with prior research using more sophisticated
statistical techniques that finds that regulation tends to make a town more Democratic (Sorens 2018). (The explanation
is that non-college-educated voters, who are more Republican, disproportionately move away from more regulated
locales.)
25You can also read