China Overtakes the US as the World's Largest Economy - Impact on Industries and Consumers Worldwide
←
→
Page content transcription
If your browser does not render page correctly, please read the page content below
¥                    ¥

$China Overtakes the
                  $
 US as the World’s
 Largest Economy

           ¥
 Impact on Industries and
                                ¥
 Consumers Worldwide

$                           $

           ¥                    ¥
Not to be distributed without permission.
CHINA OVERTAKES
THE US AS THE
WORLD’S LARGEST
ECONOMY:
IMPACT ON INDUSTRIES
AND CONSUMERS
WORLDWIDE

CONNECT W ITH US

                   © EUROMONITOR INTERNAT ION A L 2 0 1 4
CONTENTS
1 INTRODUCTION
3 CHINA IS BIGGER, BUT IS IT STRONGER?
4 A BATTLE OF ECONOMIC EQUALS?
China overtakes in size…
…But lags in living standards
Consumption vs. investment
Structurally sound?
Balancing trade
Twin drivers of global growth
9 BUSINESS ENVIRONMENT CREDENTIALS
Expenditure on Research and Development: China catching up
Ease of Doing Business: the USA leads comfortably
China has bigger issues with corruption
Productivity: USA more than nine times higher than China
12 CHINA LAGS IN CONSUMER SPENDING
Amazing differences in average incomes and savings
Income inequality as a common issue
Younger Chinese consumers spend, but consumer expenditure
is still not driving the Chinese economy
16 USA RETAINS THE EDGE IN POPULATION TRENDS
China scores the weakest in population measures
The USA wins the demographic race
iv © EU R O M O N I TO R I NTERNATI O NAL 2014Con te n ts
20 THE TWO BIGGEST ENERGY CONSUMERS
Emerging trend of “reshoring”
to the USA, as China’s manufacturing cost rises
Both are the world’s biggest energy consumers and
worst polluters
Diversifying energy sources to enhance energy security
and reduce carbon emissions
25 MOBILE INFLUENCE MOVES FROM WEST TO EAST
Asian brands drive Chinese mobile scene ahead while
saturated USA market stalls
28 THE STATE OF INTERNET RETAILING
31 AT ODDS IN ONLINE GAMES
Free-to-play model becoming a dominant force in the USA
Subscription payment model to stage a revival in China
33 CHINA TAKES THE LEAD IN TRAVEL TECHNOLOGY
Middle-class power house
Meet the new Chinese traveller
Leapfrogging ahead in mobile travel
Gen Y ahead of the game
International rivalry
37 CHINA PLAYS CATCH UP IN ONLINE FASHION RETAILING
Bargain hunting is the key pull factor in China
Omni-channel takes precedence in the USA
Social media is integral
The online revolution continues
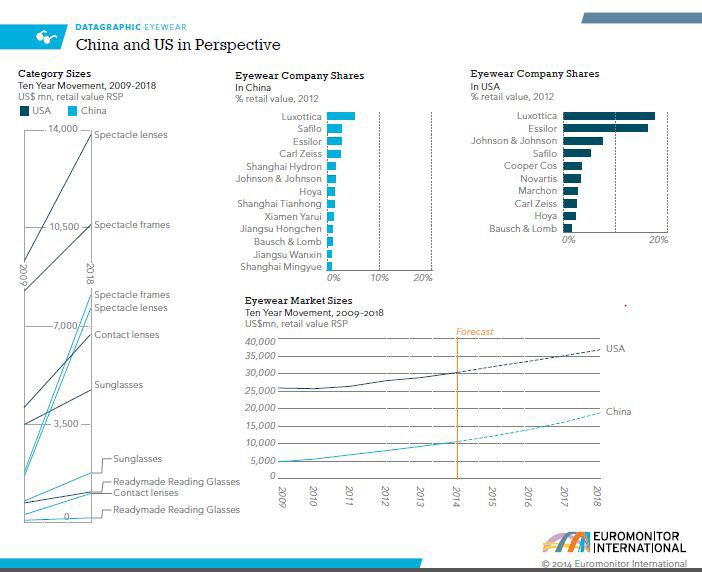
40 USA DOMINATES THE EYEWEAR MARKET
41 LUXURY DRIVES GROWTH IN PERSONAL ACCESSORIES
Consumer and marketer maturity
Global leaders’ traditional dependence on the USA
China’s fascination with jewellery
© EUROMONITOR INTERNATIONA L 201 4 vCon t e nts
43 A TALE OF TWO BEAUTIES
China growth prospects –
not a straightforward case
Competitive challenges push some foreign brands out of
China
Need for clear market segmentation in China
The USA more prospective than the macro-economic
figures
What Next?
47 SHIFTING POWER IN THE BEER MARKET
51 LIGHT VEHICLE SALES IN THE EARLY 2020s
54 ABOUT EUROMONITOR
vi © EU R O M O N I TO R I NTERNATI O NAL 2014INTRODUCTION
2014 is a landmark year for the world economy, one when the dominance of the
USA appears to be over as China becomes the world’s largest economy. China
and the USA may be economic rivals, but beyond the headline figures, divergent
trends in both countries are apparent. Everything from living standards,
consumption patterns, the business environment, productivity, retail and travel
markets differ in China from the USA.
Yet similarities are there—income inequality is an issue in both countries. Both
countries are leaders in the development of renewable energy technologies,
manufacturing production and, less auspiciously, pollution.
The real draw for consumer goods companies is China’s huge population and the
rapidly growing incomes of its consumers, whereas in the USA the overall size
of the consumer market and the affluence of its shoppers continue to entice
businesses operating in the consumer goods arena.
Taken together, the two economies play a crucial role in driving global growth.
A strong China in conjunction with a strong USA, whichever is nominally the
larger of the two, is central to a stable, well-functioning global economy. The
two countries together account for 1-in-3 dollars spent globally, thus a
well-researched China strategy, along with a carefully considered USA strategy,
is crucial to success.
© EUROMONITOR INTERNATIONA L 201 4 1In t rod ucti o n
This paper draws upon the expertise of Euromonitor’s analysts across a wide
range of industry sectors as well as the insights of our economic, demographic,
social, consumer trends and business environment specialists. We see that
in technology, China’s large population is gradually beginning to fulfil its
mobile potential, as government programmes, rising incomes and greater
affordability of both services and devices continue to drive revenues. In online
retail, we explore the local essence of the Chinese shopping experience. And
in automotive, beer and the personal accessories markets we learn that China
overtook the USA long ago.
We hope this paper provides a glimpse into both markets and gives a flavour
of the complexities of doing business in each. We believe that a thorough
understanding of the market and the socio-economic backdrop of a country
is crucial to success and have confidence that our analysis provides you with a
competitive edge, wherever in the world you operate.
Sarah Boumphrey
Head of Strategic, Economic and Consumer Insight
@SarahBoumphrey
2 © EU R O M O N I TO R I NTERNATI O NAL 2014CHINA IS BIGGER,
BUT IS IT STRONGER?
Datagraphic | 17 June 2014
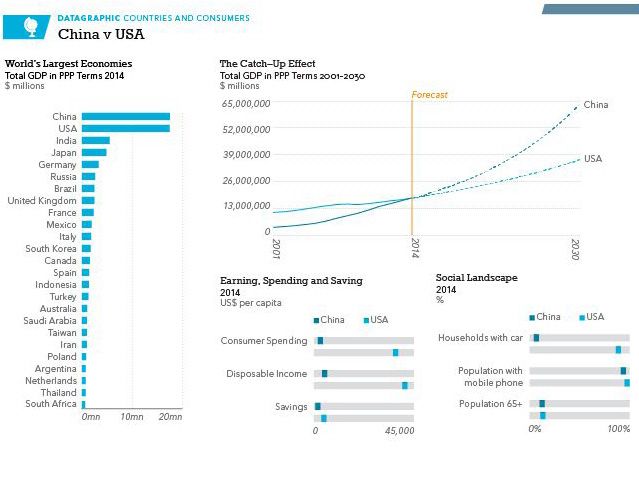
China vs. USA: China Is Bigger, but Is It Stronger?
An economic milestone occurs this year as China overtakes the USA to become
the world’s largest economy in purchase power parity, or PPP terms. Beneath
this headline there remain important differences between the two countries
with China significantly lagging in key indicators including income and
consumer expenditure. In terms of savings, the difference between the two
countries is notably narrower - indicative of China’s entrenched household
savings habit and the more relaxed attitude to credit in the USA.
© EUROMONITOR INTERNATIONA L 201 4 3A BATTLE OF
ECONOMIC EQUALS?
This year China will overtake the USA to become the world’s largest economy
in PPP terms. Whilst this is a major milestone, it doesn’t tell the whole story
of the two economies. China may be the largest in absolute terms but the
USA retains its pre-eminence in key areas. Above all, there are sharp contrasts
between the two countries, as shown in the graphic below.
Total GDP in PPP terms in China and the USA: 1980–2030
70,000
Total GDP in PPP terms in China and the USA: 1980-2030
60,000
China USA
1980 50,000 249.761 2862.5
1981 287.278 3210.9
1982 332.867 3345
40,000
$ billions
1983 383.722 3638.1
China
1984 457.737 4040.7
1985 30,000 536.153 4346.7 USA
1986 595.097 4590.1
1987 20,000 681.073 4870.2
1988 784.577 5252.6
1989 848.496 5657.7
10,000
1990 913.665 5979.6
1991 1030.727 6174
1992 0 1204.353 6539.3
1993 1980 1985 1990 1995 2000 2005 1405.2012010 20156878.72020 2025 2030
1994 1622.833 7308.7
1995Source: Euromonitor International from national statistics/Eurostat/OECD/UN/IMF
1837.69 7664
1996Note: Data from 2014 are forecast 2058.517 8100.2
1997 2288.4 8608.5
1998 2494.429 9089.1
1999 2722.848 9665.7
2000
2001China overtakes in size… 3019.505
3345.021
10289.725
10625.275
2002As you would expect with an emerging market, in growth
3704.903 terms China has
10980.2
2003 4157.822 11512.275
outpaced the USA consistently for decades and this is expected to continue into
2004 4697.901 12277.025
2005
the future. In practical terms, this means that in the
5364.258
same time it took the USA
13095.425
2006economy to double in size (1986–2013) the Chinese economy grew 12-fold.
6416.9464 13857.9
2007 7812.2284 14480.35
2008 9017.8111 14720.25
2009The two countries combined account10238.9214 for 37.5% of global real GDP growth in the
14417.95
2010 11796.8837 14958.3
2011 13538.8243 15533.825
2012 14829.7156 16244.575
4 © 2013
EU R O M O N I TO R I NTERNATI O NAL 2014 16196.0685 16799.7
2014 17622.0465 17481.707
2015 18670.8117 18303.3518A Battl e of Econ omic E qua ls ?
years leading up to 2030. Between 2013 and 2030, China will add USA$18,026
billion in GDP, the equivalent of another Western Europe, and the USA
USA$8,658 billion in 2013 prices.
…But lags in living standards
In GDP (PPP) per capita terms, China still ranks way below the USA. In fact, in
a ranking of 183 countries, China is in 75th place. Even in 2030, per capita GDP
in PPP terms in China will remain at less than half that of the USA.
In terms of living standards, China still has a long way to go and these
numbers are what really matter to the average person. In addition, the spoils
of economic growth have not been distributed evenly and income inequality
is a real challenge for the Chinese government. Yet, income inequality is an
issue that both countries have in common. For instance, since 2008, the
disposable income of a middle-income household in the USA has fallen whilst
that of a high income (decile 10) household has increased dramatically. In
China all income levels have seen growth, but the low income households are
overwhelmingly in rural areas leading to an urban-rural divide.
GDP per capita in PPP terms in China and the USA: 1980–2030
120,000
GDP per capita in PPP terms in China and the USA: 1980-2030
100,000
80,000 China USA
1980 256.1 12,597.7
$ per capita
1981 291.0 13,992.9
1982 60,000 332.6 14,439.0 China
1983 377.5 15,561.3 USA
1984 444.4 17,134.3
1985 40,000 513.8 18,269.3
1986 562.2 19,114.8
1987 633.5 20,100.8
20,000
1988 717.8 21,483.1
1989 764.2 22,922.4
1990 0 810.7 23,954.5
1991 1980 1985 1990 1995 2000 2005 901.5
2010 201524,405.0
2020 2025 2030
1992 1,039.8 25,492.9
1993 1,199.3 26,464.8
Source: Euromonitor International from national statistics/Eurostat/OECD/UN/IMF
1994
Note: Data from 2014 are forecast 1,369.3 27,776.4
1995 1,533.3 28,781.9
1996 1,699.6 30,068.2
1997 1,869.8 31,573.8
1998 2,017.7 32,948.9
1999 2,182.5 34,639.1
2000 2,400.5 36,467.4
2001 2,639.2 37,285.7
2002 2,902.9 38,175.4
2003 3,236.8 39,682.7
2004 3,635.4 41,929.0
2005 4,126.7 44,313.7
2006 4,907.6 46,443.8
2007 5,943.2 48,070.6
2008 6,825.0 48,406.9
2009 7,709.9 46,999.0
2010 8,839.9 48,354.0
© EUROMONITOR INTERNATIONA L 201 4 5
2011 10,096.7 49,850.0
2012 11,006.6 51,735.1A B at t l e o f Eco no m ic Equals ?
Consumption vs. investment
The structure of the two economies is also quite different. In 2014, private
consumption will account for an estimated 68.3% of GDP in the USA, compared
to just 37.2% in China. Chinese growth has been driven by investment, whereas
in the USA private consumption has been the driver. A point of similarity is
that both countries have seen debt-fuelled growth.
An unbalanced economy, whether it be weighted towards consumption
or investment, or fuelled by debt, is open to risk. Too much emphasis on
consumption could lead to pressure on the trade balance and inflationary
pressures, whereas if investment is not directed to where it’s needed it could be
wasted entirely, place pressure on inflation or create bubbles.
GDP by Usage in China and the USA: 2013
GDP by Usage in China and the USA: 2013
100%
China USA
80%
Net Exports of Goods and Services 1,073,045.7 -497,300.0
Gross Fixed Capital Formation 26,789,530.4 3,170,250.0
Increases in Stocks 1,184,860.1Government Final Consumption
106,050.0
Private60%
Final Consumption Expenditure 21,357,734.5Expenditure
11,501,550.0
Government Final Consumption Expenditure 7,945,813.7Private
2,519,200.0
Final Consumption
Expenditure
% of GDP
Increases in Stocks
40%
Source: Euromonitor International from national statistics/Eurostat/OECD/UN/IMF
Gross Fixed Capital Formation
20%
Net Exports of Goods and Services
0%
China USA
-20%
Source: Euromonitor International from national statistics/Eurostat/OECD/UN/IMF
Structurally sound?
Agriculture remains an important sector in China, contributing 10.0% to GDP
in 2013 whereas in the USA it is 1.0%. Productivity is much higher in the USA,
however with only 1.4% of the employed population working in agriculture in
the same year, compared to 32.6% in China. USA farms tend to be large-scale
businesses whereas in China many farms are traditional and small-scale. The
Chinese government aims to modernise farming, seeing a better-functioning
agricultural sector as a tool to combat rising rural-urban inequality and to quell
potential unrest.
6 © EU R O M O N I TO R I NTERNATI O NAL 2014A Battl e of Econ omic E qua ls ?
Another interesting point of difference is manufacturing. In China,
manufacturing accounts for a far larger proportion of the economy at 30.0%,
whereas in the USA it is 13.2%. Yet since 2010, manufacturing has been
expanding in importance in the USA while in China it is declining, having
peaked at 32.9% in 2007. The USA manufacturing sector is benefiting from the
reshoring trend driven by low energy costs and the subdued growth of labour
costs, whereas the Chinese manufacturing sector is suffering from increasing
costs and skills shortages.
Real Growth in Wages in Manufacturing in China and the USA: 2008–2013
The dimensions of these charts
150
Real Growth in Wages in Manufacturing in China and the USA: 2008-2013
145 China USA
2008 100 100
2009 140 110 104.3
2010 121.2 103.9
135
2011 131.1 102.3
2012 130 137.7 101.2
2008 = 100
2013 145.2 101.5
125
120
Source: Euromonitor International from International Labour Organisation (ILO)/Eurostat/national statistics
115
110
105
100
2008 2009 2010 2011 2012 2013
China USA
Source: Euromonitor International from International Labour Organisation (ILO)/Eurostat/national statistics
Balancing trade
Finally, the external sector also reveals huge differences. China’s trade balance
has been in surplus every year since 1994, whereas the USA has been in deficit
since before 1977. Looking at trends over time however, the balance of trade is
slowing converging with the trade deficit in the USA shrinking whilst China’s
trade surplus also shrinks.
© EUROMONITOR INTERNATIONA L 201 4 7A B at t l e o f Eco no m ic Equals ?
The Balance of Trade in China and the USA: 2008–2013
The dimensions of th
8.0
The Balance of Trade in China and the USA: 2008-2013
China USA
6.0
2008 6.5 -5.5
2009 3.9 -3.5
2010 4.0 3.1 -4.2
2011 2.2 -4.7
2012 2.0 2.8 -4.5
% of GDP
2013 2.8 -4.1
0.0
Source: Euromonitor International from national statistics/OECD/IMF
-2.0
-4.0
-6.0
-8.0
2008 2009 2010 2011 2012 2013
China USA
Source: Euromonitor International from national statistics/OECD/IMF
Twin drivers of global growth
China and the USA may be economic rivals, and China may just take the lead
this year in terms of the overall size of the economy, but beyond the headline
figures underlying contrasts are more apparent.
Taken together, the two economies play a crucial role in driving global growth
and a strong China in conjunction with a strong USA, whichever is nominally
the larger of the two, is central to stable and sound global growth.
Sarah Boumphrey
Head of Strategic, Economic and Consumer Insight
@SarahBoumphrey
8 © EU R O M O N I TO R I NTERNATI O NAL 2014BUSINESS ENVIRONMENT
CREDENTIALS
While China might be ready to surpass the USA in PPP terms, the USA still far
outpaces China when it comes to Ease of Doing Business rankings and labour
productivity. Research and development (R&D) however is one area where
China is rapidly gaining ground. Despite this, there is little real contest between
the two countries in terms of quality of the business environment. The real
draw for consumer goods companies is China’s population size and rapidly
growing consumer affluence, and firms investing there instead of the USA do so
despite, not because of its business environment.
Total Patents Granted in China and USA National Patent Offices: 2008–2013 ‘000
300
Single column (Column1 template) 265
253 257
Total Patents Granted at National Patent
FDI Intensity
2008 250 2.7 225
2009
220 1.4 217
2010 1.2
2011
200 2.1
167 172
Office ('000)
2012 158 1.6
150 135 China
128
USA
94
100
50
0
2008 2009 2010 2011 2012 2013
Source: Euromonitor from trade sources/national statistics
Two columns (Column1 template)
China USA
2008 93.7 158
2009 128 167
2010 135 220
2011 172 225
2012 217 253
2013 257 265
© EUROMONITOR INTERNATIONA L 201 4 9B u si n e s s E nv i r o nm e n t Credent ia ls
Expenditure on Research and
Development: China catching up
While the quality of China’s patents and research and development has been
called into question by many, there is little doubt that in terms of sheer
numbers, research and development and patents are an area where China is
beginning to gain ground rapidly on the USA. Total patent grants at its national
patents office stood at 256,943 in 2013, up sharply from 93,706 in 2008 and
catching up with 264,960 granted in the USA at its national patents office.
China has been open about its desire to become a world leader in innovation,
stating a goal of becoming an innovation-driven economy by 2020 in its five
year plan in 2013. China spent 2.1% of its total GDP on R&D in 2013, up
significantly from 1.5% in 2008, and comparing favourably with 2.9% in the
USA in 2013, which increased only a fraction from 2.8% in 2008.
Ease of Doing Business: the USA
leads comfortably
China seems far less concerned with making its business environment more
accessible to foreign investors than it is with becoming a self-sufficient
innovation driver and consequently has done relatively little to close the
wide gap between itself and the USA in terms of the quality of its business
environment. The figures speak for themselves. For the overall Ease of Doing
Business ranking in 2014, China stood in 96th place out of a total of 189
countries, compared with 4th for the USA. In fact, China’s ranking has actually
worsened from 78th place in 2010 out of 183 countries. There is much work to
be done to clean up its notoriously complex business procedures with 4 of the
10 sub-categories of Doing Business ranking over 100 in 2014. Construction
permits was the worst at 185th, while enforcing contracts was its best at 19th.
The USA performs relatively well across the board with eight of its
sub-categories ranking under 30th position in Doing Business 2014. Paying
taxes was its weak link at 64th, due to a rather high total tax rate of 46.3%
of total profits. In getting credit it was 3rd globally according to Doing Business
2014. Credit is easy to obtain in the USA, thanks to its universal private
bureau coverage.
China has bigger issues
with corruption
Corruption is an issue in China, and it ranked poorly at 80th out of 177
countries in Transparency International’s Corruption Perceptions Index 2013.
10 © EU R O M O N I TO R I NTERNATI O NAL 2014Busin ess En vir on m en t Cr e d e n tials
The USA ranked 19th in 2013, unchanged from its ranking in 2012 out of 176
countries. China recently made some public gestures to try to reduce lavish
government spending, as president Xi Jinping clamped down on excessive
spending by public officials at the end of 2012. In the long term, this could go
some way to narrowing the gap. However at a fundamental level, while the USA
is far from being free from corruption, China’s lack of democracy and freedom
of speech make corruption far more of an issue than the USA.
Productivity: USA more than nine
times higher than China
China has to become more self-sufficient. It has been trying to shift away from
low cost manufacturing towards more skilled work, and in the long term this
will help to raise its labour productivity, which is measured as GDP per person
employed. Currently however, its productivity of USA$11,753 in 2013 was in
stark contrast to the USA’s USA$109,115 in the same year. The main reason
behind the difference is that 32.6% of China’s total employed population
worked in the labour intensive, low productivity sectors of agriculture, hunting,
forestry and fishing in 2013, compared with just 1.4% in the USA, which is a
much more service based economy.
Labour Productivity in China and the USA: 2008–2013
GDP per person employed
140,000
Algeria Egypt Morocco Tunisia
2010 120,000 10.0 9.0 9.1 13.0 18.3 17.6
2011 10.0 12.0 9.0 18.3
Labour Producitivity (US$)
2012 100,000 9.7 12.7 9.0 17.6
2013 9.3 13.3 8.9 16.0
2014 80,000 9.0 11.8 8.8 13.5
2015 8.6 10.4 8.7 12.9
2016 60,000 8.4 9.0 8.6 12.0
2017 8.2 8.4 8.5 11.2
40,000
20,000
0
2008 2009 2010 2011 2012 2013
China USA
Source: Euromonitor International from International Labour Organisation (ILO)/Eurostat/national statistics
Carrie Lennard
Business
Stacked Line Environment Manager
(LineStacked1 template)
China USA
2008 8,114.5 101,440.7
2009 8,755.4 102,501.7
2010 9,525.8 105,662.9
2011 10,316.7 107,017.2
2012 11,014.3 108,115.5
2013 11,752.7 109,115.3
© EUROMONITOR INTERNATIONA L 201 4 11CHINA LAGS IN
CONSUMER SPENDING
When comparing income and consumer expenditure levels of the two countries,
China and the USA are still worlds apart. Although both countries are faced
with high levels of income inequality, which can impact businesses’ efforts to
expand in both markets, there are many extreme contrasts between the two
countries in terms of consumer income, savings and expenditure. To consumer
goods businesses, the stark contrasts in incomes and savings mean that China
is still a significantly smaller consumer market with less spending capacity
when compared to the USA.
Annual Gross Income in China and the USA: 1990–2030
25,000
Annual Gross Income, US$ billion
20,000
15,000
10,000
5,000
0
China USA
Source: Euromonitor International from national statistics
Note: Data are in 2013 prices, fixed exchange rates. Data for 2014–2030 are forecasts.
Two columns (Column1 template)
China USA
1990 615 9,622
1991 675 9,638
1992 769 9,949
1993 835 10,096
1994 946 10,349
1995 1009.9 10646.3
1996 1115.4 11008.5
1997 1218.7 11448.8
1998 1304 12088.2
12 © EU R O M O N I TO R I NTERNATI O NAL 2014
1999 1383.2 12480.7
2000 1545.7 13065.2Ch in a Lags in Con sum er S pe n d i n g
Amazing differences in average
incomes and savings
Although the growth in China’s total gross income over the past decades has
been very impressive, China is still lagging far behind the USA in terms of
per capita gross income. To international businesses, this per capita income
indicator matters most because it reflects consumers’ purchasing power. By
2030, Euromonitor forecasts that per capita gross income level in the USA will
still be 4.6 times higher than that of China, although this will be a significantly
narrower gap compared to 2013 when the USA’s per capita gross income was
10.5 times higher than that of China.
Per Capita Real Annual Gross Income in China and the USA: 1990–2030
70,000
China's Gross InUSA's Gross Inc China's Savings USA's Savings per Capita
1990 546.0 38547.5 157.5 3855.2
Per Capita Annual Gross Income, US$
1991 60,000 590.2 38096.5 169.1 3939.0
1992 664.1 38785.6 189.5 4050.8
1993 50,000 712.8 38844.3 192.3 3617.6
1994 798.6 39330.4 249.2 3383.8
1995 842.6 39981.9 240.6 3550.2
40,000
1996 920.9 40864.0 261.2 3524.8
1997 995.7 41991.4 300.2 3481.5
1998 30,000 1054.8 43821.1 315.6 3855.4
1999 1108.7 44727.3 317.1 3241.1
2000 20,000 1228.8 46303.7 364.3 3490.9
2001 1317.7 46429.2 389.3 3719.8
2002 1433.9 46127.3 423.1 4061.9
10,000
2003 1596.4 46352.9 505.2 4029.5
2004 1733.6 47510.1 543.6 3995.5
2005 0 1953.6 48083.5 637.2 3288.0
2006 2231.1 49414.8 762.0 3763.0
2007 2567.9 50023.8 921.2 3754.9
2008 2839.4 49275.3 1032 4544.3
2009 China's Gross Income
3186.3 per Capita
47797.1 1166.1 USA's Gross Income per Capita
4860.5
2010 3612.6 47941.4 1375.2 4565.8
2011 4023.7 48513.3 1480 4514.2
Source: Euromonitor 4366.6
2012 International from national statistics
49008.2 1575.7 4504.3
Note: Data are in 2013 4699
2013 prices, fixed exchange
49441.5 rates; Data for 2014–2030
1664.1 are forecasts.
4481.4
2014 5090.4 50252.7 1792.7 4480.1
China’s per capita gross income was 10.5 times lower than that of the USA in
2015 5475 51147.4 1902.3 4497.6
2016 5889.3 52085.1 2021.4 4557.3
2013, so it is remarkable that China’s per capita savings in the same year was
2017 6307.0 52938.7 2149.4 4607.7 3,855.2
2018 6735.0 53774.4 2283.2 4648.1
only 2.7 times less than the USA. Confident with the country’s rapid economic
2019 7182.9 54587.8 2424.1 4671.5
expansion over the past decades, Chinese consumers have increasingly
2020 7647.8 55438.5 2563.9 4709.2
2021 8147.3 56319.1 2710.6 4749.5
embraced consumer credit, yet collectively they are, and will still be, a nation of
2022 8669.0 57225.4 2867.3 4792.9
2023 9223 58159.5 3032.4 4840.3
savers. China’s savings ratio is forecast to remain high, at 35.7% of disposable
2024 9811.3 59121 3205.9 4891.7
income in 2030, compared to 10.0% in the USA in the same year. More
2025 10436 60107.8 3390.3 4945.3
2026 11100.3 61120 3585.7 5001.3
impressively, China’s total savings of USA$6.3 trillion in 2030 will be 3.4 times
2027 11806.8 62157.9 3792.8 5059.7
2028 12557.9 63221.2 4012.7 5120
higher than the USA, which will be a significantly wider gap compared to 2013
2029 13357.1 64310 4246.1 5182.2
2030 14207.5 65424.5 4493.9
when China’s total savings was 1.6 times higher than the USA’s 5246
total savings.
© EUROMONITOR INTERNATIONA L 201 4 13C hi n a Lag s i n Co ns umer Sp ending
Annual Savings in China and the USA: 1990–2030
7,000
6,000
Annual Savings, US$ billion
5,000
4,000
3,000
2,000
1,000
0
China USA
Source: Euromonitor International from national statistics
Note: Data are in 2013 prices, fixed exchange rates; Data for 2014–2030 are forecasts
Total savings:
China USA
Income inequality as a common issue
1990
1991
177.5
193.3
962.4
996.5
Reflected by the Gini index –1992
a standard economic
219.4 measure
1039.1 of income inequality
1993 225.3 940.3
with index scores varying between
1994 0% (representing
295.4 perfect
890.4 equality, with all
1995 288.3
people receiving the same income) and 100% (implying945.3
absolute inequality
1996 316.3 949.6
with only one person receiving all the income),
1997 367.4 income949.2 inequality levels are
1998 390.1 1063.5
comparable between China (47.3%
1999
in 2013)
395.7
and the USA (47.7% in 2013) and
904.4
are relatively high by international standards. High levels of income inequality
2000 458.3 985.0
2001 493.4 1,060.0
can hamper middle class expansion
2002 as well539.9
as polarise the consumer market
1,168.3
2003 649.0 1,169.0
into effectively two markets –2004
one of high702.5
spenders and the other of low-income
1,169.9
consumers. In the period through to 2030, China is expected to see falling
2005 828.3 971.6
2006 996.4 1122.8
inequality thanks to the country’s
2007 income distribution1131.1
1210.9 reforms while the level of
2008 1363.6
income inequality in the USA will steadily rise. 1381.9
2009 1548.6 1491.1
2010 1835.2 1412.4
2011 1984.5 1406.7
2012 2123 1414.3
2013 2253.2 1417.7
2014 2439.1 1427.9
2015 2600.1 1444.2
2016 2775 1474.2
2017 2962.9 1501.5
2018 3159.3 1525.8
2019 3365.7 1544.6
2020 3570.7 1568.3
2021 3785.3 1593
2022 4013.4 1618.9
2023 4252.9 1646.3
14 © EU R O M O N I TO R I NTERNATI O NAL 2014Ch in a Lags in Con sum er S pe n d i n g
Younger Chinese consumers spend,
but consumer expenditure is still not
driving the Chinese economy
Like the USA, China has a booming luxury goods market which became the
world’s third largest in 2013 behind the USA and Japan. This partly reflects the
high level of income inequality in China, and is partly the result of the higher
incomes enjoyed by younger Chinese consumers, who are generally more willing
to spend on luxury goods as a marker of success. In 2013, people aged 30–34
had the highest average gross income in China whereas the age cohort enjoying
the highest average gross income in the USA was 50–54.
Overall, however, Chinese consumers are not spending enough, as seen in the
country’s high savings ratio and the fact that China’s economic growth is mainly
investment driven. In 2013, consumer expenditure as a proportion of total GDP
was 36.5% in China, compared to 67.1% in the USA. Even by 2030, consumer
expenditure will still account for less than a half of the Chinese economy at
40.9% of total GDP, meaning it will still not be a driver of economic growth or
support a more balanced economy as the Chinese government had hoped.
An Hodgson
Income and Expenditure Manager
© EUROMONITOR INTERNATIONA L 201 4 15USA RETAINS THE EDGE IN
POPULATION TRENDS
Although China’s economy is growing, the USA will preserve the competitive
edge when it comes to population trends, giving it an advantage that boosts its
economy and competitiveness in the long term. China’s shifting demographic
structure is one of the biggest risks to sustainable economic growth in the
medium to long term. Population trends offer vital insights for strategists and
marketers interested in consumer market developments as population profiles
dictate consumer demand. This is all the more important for the USA, the
world’s largest consumer market (consumer spend in USA$ terms), and China,
the most populous country globally, where the government aims to rebalance
from a manufacturing and export-based economy to one driven by domestic
consumption. In line with global demographic trends, both countries are
ageing. However, China scores the poorest in most demographic indicators.
Old-Age Dependency Ratio in China and the USA: 2014–2030
Line (Line1 template)
40.0
China USA
2014 16.0 21.6
35.0
2015 16.9 22.2
Old-Age Dependency Ratio %
2016 18.0 22.8
2017 30.0
19.3 23.4
2018 20.4 24.0
2019 21.7 24.7
2020 25.0 23.1 25.5
2021 24.4 26.2
2022 25.9 27.0
2023 20.0 27.1 27.8
2024 27.7 28.5
2025 28.0 29.3
2026 15.0 29.1 30.1
2027 30.4 30.7
2028 32.8 31.4
10.0
2029 35.1 32.0
2014 2016 2018 2020 2022 2024 2026 2028 2030
2030 37.2 32.5
China USA
Source: Euromonitor International from national statistics/UN
Note: Indicates the percentage of persons older than 65 per persons aged 15 – 64
16 © EU R O M O N I TO R I NTERNATI O NAL 2014US A Retain s th e Edge in Popul ation T re n d s
China scores the weakest in
population measures
China’s unique demographic prospects are a result of the government’s
one-child policy since 1979, introduced to curb rapid population growth:
•• China has the world’s largest population but Euromonitor predicts
that India will overtake China by 2025. The country’s low fertility rate,
the number of children that would be born to a woman if she were to
live to the end of her childbearing years, dropped from 2.8 in 1977 to
1.2 in 2013, well below the replacement level of 2.1 usually associated
with a population being able to replace itself naturally. This compares
to a fertility rate of 1.9 in 2013 for the USA, where a large immigrant
population and a society that encourages mothers to work has buoyed
fertility rates vis-à-vis other developed economies.
•• The open immigration policy is boosting USA population growth. Our
projections show that the USA population will grow at a steady pace
of 0.7% on average per year in 2014–2030, more than double the
forecast for advanced economies, while countries such as Japan, Spain
and Germany will battle population declines. Concurrently, China will
have growth of just 0.2% on average per year, well below the average
for emerging and developing countries of 1.1%. Immigration to China
is limited with immigrants accounting for just 0.1% of the Chinese
population in 2010, according to the World Bank.
•• China’s median age of 40.3 in 2013 is more comparable to that of an
advanced economy and higher than that of the USA of 37.5 years. By
2030, Euromonitor forecasts that the median age will have soared by an
extra 6.8 years in China to reach 47.1 compared to 39.9 years in the USA.
These factors are increasing the burden on the working-age population
needed to support the growing number of elderly. China’s surplus of
cheap labour has been at the heart of its success in establishing itself as
the world’s largest manufacturer. However, we predict that the
working-age population (aged 15–64) will shrink by 10.8% over
2014–2030 (106.7 million fewer people) while the USA’s working-age
population will continue to grow by over 4.4%. This will result in less
people of working-age paying taxes to care for the elderly. The Chinese
old-age dependency ratio, the percentage of persons older than 65 per
persons aged 15–64, will overtake the USA in 2028 and will reach 37.2%
in 2030.
© EUROMONITOR INTERNATIONA L 201 4 17US A R e tains th e E d g e in Po p ulat io n Trends
Period Change in Population by Age Group in China and USA: 2014–2030
120.0
Two columns (Column1 template)
107.5
100.0 China USA
0-14 -6.7 3.5
15-64 -10.8 4.4
80.0
65+ 107.5 57.0
Period Change %
57.0
60.0
China
40.0 USA
20.0
3.5 4.4
0.0
-6.7
-20.0 -10.8
0-14 15-64 65+
Source: Euromonitor International from national statistics/UN
•• China has two other unique demographic challenges. The one-child
policy and a cultural preference for boys have resulted in a severe gender
imbalance. In 2013, there were 33.9 million more boys and men in China
than girls and women, equivalent to the entire population of Iraq. As
these men become ready for family life, there is a risk of a generation
of young, unmarried men due to the lack of females in Chinese society.
Furthermore, most families in China have a 4:2:1 family structure where
one child must support two parents and four grandparents adding an
extra dimension to the burden on the labour force.
The USA wins the demographic race
The USA also faces its own unique demographic conundrum. An open
immigration policy does not come without some internal resistance. Analysts
predict that the USA will become a “majority minority” population by 2050 as
the non-Hispanic white population declines. Additionally, even though the USA
population will reach a record of 400 million by 2050, it will lose its place as the
world’s third largest population to Nigeria by the same year, according
to UN projections.
We also need to put Chinese figures into context. At 1.4 billion in 2030,
the population will continue to dwarf the USA and the rest of the world. Its
working-age population is declining but at an expected 884.1 million in 2030,
this will be more than the total population of Europe combined. Marketers and
strategists can prepare for and benefit from changing demographics in both
countries by catering towards the rapidly growing number of elderly in China
and targeting the increasing diversity of the USA population.
18 © EU R O M O N I TO R I NTERNATI O NAL 2014US A Retain s th e Edge in Popul ation T re n d s
However, the implications of China’s population changes are acute because
it is experiencing rapid ageing without having reached developed economy
status. China is already losing competitiveness because of rising wages and
skills shortages; therefore, emerging markets which promise a growing labour
pool will become more attractive to investors. If China does not expand its
social safety net in terms of pensions and healthcare, this will harm consumer
spending prospects and potentially halt the middle class expansion as
disposable incomes are diverted to supporting the elderly. This will hinder
China’s ability to reach advanced economy levels and may even threaten its
place as the world’s largest economy.
Media Eghbal
Head of Countries Analysis
© EUROMONITOR INTERNATIONA L 201 4 19THE TWO BIGGEST
ENERGY CONSUMERS
China and the USA share many similarities when it comes to industry,
infrastructure and environment. Both countries lead the world in
manufacturing production, energy consumption, greenhouse gas emissions and
green energy investment. Yet the two countries differ in several ways. China’s
per capita resource availability is low and thus the country is significantly
more dependent on energy imports. At the same time, China is significantly
less energy efficient than the USA. Furthermore, China’s reliance on energy-
intensive manufacturing industries to drive exports and economic growth over
the past decades has led to rising carbon dioxide (CO2) emissions while the USA
is reigning in its emissions. In their efforts to become more energy independent
and efficient, China and the USA can together become the driving force in
making green energy viable and affordable, with great long-term implications
for the global energy market.
Major Polluters by Share of Global CO2 Emissions: 2013
Chart 5 - Total Year
China 28.3
USA 16.2
Western Europe 10.0
Rest of the
World 45.5 China
USA
Western Europe
Rest of the World
Source: Energy Information Administration of the USA Government, International Energy Annual
20 © EU R O M O N I TO R I NTERNATI O NAL 2014Th e Two Biggest En er gy Con s u me rs
Emerging trend of “reshoring”
to the USA, as China’s manufacturing
cost rises
China and the USA are the two largest manufacturing economies in the world,
yet with a total manufacturing output of USA$17.8 trillion in 2013, China’s
manufacturing production was over three times higher than that of the USA.
China’s emergence as the world’s largest producer of manufactured goods has
been impressive, with manufacturing production expanding at an average rate
of 15.7% per year in real terms between 1997 and 2013 – the fastest growth in
the world.
Total Manufacturing Production in China and the USA: 1997–2013
20,000
Total Manufacturing Production, US$ billion
Two columns
18,000 (Column1 template)
16,000 China USA% of GDP, China Manufacturi
14,000 1997 955 3,809 33.4 16.3
1998 1,028 3,960 32.3 16.2
12,000 1999 1,098 4,110 32 16
10,000 2000 1,280 4,276 32.3 15.2
2001 1,406 4,036 31.8 14
8,000 2002 1,604 3,991 31.4 13.9
6,000 2003 1,953 4,106 32.1 13.5
2004 2,613 4,404 32.4 13.7
4,000 2005 3,283 4,825 32.5 13.6
2,000 2006 4,296 5,094 32.9 13.3
2007 5,695 5,412 32.9 13.2
0 2008 7,564 5,511 32.7 12.4
2009 8,285 4,525 32.3 12
2010 10,294 4,995 32.5 12.2
China USA
2011 12,414 5,198 31.8 12.4
2012 14,172 5,408 30.6 12.9
2013 17,821 5,537 30 13.2
Source: Euromonitor International from national statistics/UN/OECD
China is one of the top destinations USA and multi-national businesses
outsource manufacturing work to take advantage of China’s lower wage costs.
In recent years, however, rising wages, labour shortages as a result of the one-
child policy, an appreciating renminbi and increasing transportation costs due
to high oil prices have started to erode China’s competitive advantage as a low-
cost production base. Meanwhile, productivity at USA factories has been rising,
leading to a trend, albeit in early stages, of USA businesses either “reshoring”
manufacturing back to the USA or “near shoring” it to a closer location such as
to Mexico. In the long term, this trend will benefit the USA economy through
job creation and rising USA manufactured exports and at the same time stunt
manufacturing expansion in China.
© EUROMONITOR INTERNATIONA L 201 4 21T he T wo Bi g g e st E ne rgy Co ns umers
Both are the world’s biggest energy
consumers and worst polluters
As the world’s two largest manufacturers, China and the USA lead global
energy consumption with China overtaking the USA in 2010 to become the
world’s biggest energy consumer. Consequently, both countries are also the
world’s worst polluters. In 2013, China accounted for 28.3% of the global CO2
emissions from the consumption and flaring of fossil fuels, followed by the
USA on 16.2%. Energy consumption per capita in China as the world’s most
populous nation is significantly below the USA level, but an important trend
that sets China and the USA apart is that China’s total CO2 emissions have
been rising, while the USA is reigning in its emissions.
With China having relied largely on energy-intensive manufacturing industries
to drive exports and economic growth, the value of GDP produced per tonne
of oil equivalent of energy consumed has been significantly lower in China
than in the USA.. In 2013, China generated USA$ 3,275 of GDP per tonne
of oil equivalent of energy consumed respectively, compared to USA$ 7,819
generated by the USA.
Coal makes up the largest share in China’s mix of primary energy consumption,
with 69.3% of total energy consumption in 2013, although this share has been
gradually declining as the country strives to reduce coal consumption. As well
as being the world’s top coal consumer, accounting for about half of global coal
consumption, China is also the world’s biggest producer and importer of coal.
In the USA, crude oil accounts for the largest share of energy consumption at
37.9% in 2013, followed by natural gas at 30.7% in the same year.
22 © EU R O M O N I TO R I NTERNATI O NAL 2014Th e Two Biggest En er gy Con s u me rs
Primary Energy Consumption by Type in China: 1990–2013
Coal Crude Oilroelectricity Natural GasNuclear Energy
1990 3,000 509.3 112.9 28.7 13.7 0
Primary Energy Consumption, million tonnes
1991 527.2 121.9 28.2 14.3 0
1992 545.2 132.4 29.6 14.3 0
1993 2,500 574.3 145.8 34.4 15.1 0.4
1994 612.0 148.1 37.9 15.6 3.3
1995 663.5 160.2 43.1 16 2.9
1996 2,000 677.4 175.7 42.5 16.6 3.2
of oil equivalent
1997 672.6 193.9 44.4 17.6 3.3
1998 652 197.1 47.1 18.2 3.2
1999 672.8 209.3 46.1 19.3 3.4
2000 1,500 679.2 224.2 50.3 22.1 3.8
2001 692.8 228.4 62.8 24.7 4
2002 728.4 247.5 65.2 26.3 5.7
2003 1,000 868.2 271.7 64.2 30.5 9.8
2004 1019.9 318.9 80 35.7 11.4
2005 1128.3 327.8 89.8 42.1 12
2006 1250.4 351.2 98.6 50.5 12.4
2007
500 1320.3 369.3 109.8 63.5 14.1
2008 1369.2 376 132.4 73.2 15.5
2009 1470.7 388.2 139.3 80.6 15.9
2010 0 1609.7 437.7 163.4 96.8 16.7
2011 1760.8
1990 1992 459.4
1994 1996 158.2 1998 117.5
2000 200219.5 2004 2006 2008 2010 2012
2012 1873.3 483.7 194.8 129.5 22
2013 Coal
1980.6 Crude Oil 206.8Hydroelectricity
505.3 139.8 Natural Gas
23.6 Nuclear Energy
Source: Euromonitor from BP Amoco, BP Statistical Review of World Energy
Diversifying energy sources to
enhance energy security and reduce
carbon emissions
Both countries have an all-of-the-above energy strategy that encompasses
traditional sources of energy such as coal, oil and gas, renewables such as
solar, wind and hydroelectric power, and other unconventional sources such as
shale gas extracted via hydraulic fracturing or “fracking.” This strategy aims at
enhancing energy security, increasing energy efficiency, sustaining economic
development while also reducing carbon emissions and other environmental
impacts by shifting towards cleaner energy.
The USA is already a global leader in fracking. Natural gas produced by
this technique accounted for over a third of total natural gas produced in
the country as of 2013 and is putting the USA on track to become energy
independent by 2035. Although natural gas is considered a cleaner energy
than coal due to lower carbon dioxide emissions, fracking has sparked public
concerns over environmental risks, including potential contamination
of groundwater.
© EUROMONITOR INTERNATIONA L 201 4 23T he T wo Bi g g e st E ne rgy Co ns umers
In China, the increased availability of shale and other LNG markets is driving
the country’s aggressive pursuit of natural gas. Euromonitor previously
predicted that in the medium term China could rival the USA as a major
player in fracking, but in a water-stressed country like China the potential
contamination of the water supply could bring the expansion of shale gas
production under public scrutiny.
Both China and the USA are leading investors in renewable energy, with China
making production of wind power a strategic priority. The sheer scale of the
energy markets in both countries present vast investment opportunities,
help to foster innovations and technological advances and encourage mass
production, which in the medium to long term will contribute to driving down
global energy prices. In other words, China and the USA can together be the
driving force in making renewable and clean energy viable and affordable in the
long term.
An Hodgson
Income and expenditure manager
24 © EU R O M O N I TO R I NTERNATI O NAL 2014MOBILE INFLUENCE MOVES
FROM WEST TO EAST
The USA is rapidly losing grip on its long-held title as the world’s mobile
telephone leader, with China’s surging urbanites driving a smartphone
revolution that is wrestling control of the world’s wireless telecom revenues.
China is already the largest market for smartphones and mobile telephone
subscriptions globally, and by the end of 2014 will also overtake the USA in
terms of total mobile revenues. This means that more apps, smartphone brands
and m-commerce services will be tailored towards Chinese consumers, with
USA firms eager to enter the lucrative market. However, the USA is still well
ahead of the Asian superpower in terms of online ad spend and total telecom
revenues, suggesting the North American economy remains the world’s
digital epicentre.
Telecom Revenues and Mobile Subscribers in the USA and China: 2000–2013
600 1,400
USA Revenues China Revenue USA Mobile SubChina Mobile Subscribers
2000 292.8 38.5 109.5 85.3
2001 500 301.8 44.9 128.5 144.8 1,200
Total Telecom Revenues (US$ Billion)
2002 292.8 51.0 141.8 206.0
Mobile Subscribers (US$ Million)
2003 301.8 55.5 160.6 270.0 1,000
400
2004 366.0 63.7 184.8 334.8
2005 378.0 71.3 203.7 393.4 800
2006 300 459.3 81.4 229.6 461.1
2007 480.0 97.3 249.3 547.3 600
2008 498.1 117.3 261.3 641.2
2009 200 495.1 125.1 274.3 747.2 400
2010 504.6 129.5 285.1 859.0
2011 100 526.0 152.0 298.3 986.3
200
2012 526.9 173.1 303.1 1,112.2
2013 528.0 180.2 312.2 1,180.6
0 0
2000 2001 2002 2003 2004 2005 2006 2007 2008 2009 2010 2011 2012 2013
USA Revenues China Revenues
USA Mobile Subscribers China Mobile Subscribers
Sources: Euromonitor International from International Telecommunications Union (ITU)/national statistics
© EUROMONITOR INTERNATIONA L 201 4 25M obile I nflue nc e M ov es f ro m West to Ea st
Asian brands drive Chinese mobile
scene ahead while saturated USA
market stalls
China’s large population is gradually beginning to fulfil its mobile potential,
as government programmes, rising incomes and greater affordability of both
services and devices continue to drive revenues in the segment. According to
trade sources, in 2014 Chinese mobile revenues will reach USA$87.0 billion,
outpacing the USA for the first time, which will see revenues of $60.0 billion.
This historic shift will occur due to several factors:
•• Asia has seen an evolution of major regional smartphone brands such as
Lenovo, Huawei and Samsung, which are better placed to understand the
feature and price demands of Chinese consumers. They are now actively
expanding distribution channels in the country to serve a growing
adoption of smartphones, for which the retail market is projected
USA$55.9 billion in 2013.
•• More Chinese consumers are arriving to cities from rural areas, which
is increasing earnings due to improved job opportunities and allowing
access to better digital connectivity. Demand for and uptake of mobile
services is rising. The country’s urban population increased by 17.4%
while mobile subscriptions rose by 84.1% over 2008–2013.
•• With home possession of a mobile phone at 98.3% and mobile broadband
penetration of subscriptions at 81.8% in 2013, the USA is a saturated
mobile market with little room remaining for growth. By contrast, only
16.0% of Chinese mobile subscribers were connected to the web in 2013,
meaning growth opportunities in mobile added-value services such as
data plans and m-commerce are much more vibrant.
While the USA gives up ground in the mobile marketplace, it remains the
dominant digital force.
China’s growth drivers also provide limitations to an improved information
and communications technologies landscape, as the country’s low telecoms
base creates weaker impacts in segments such as digital advertising and online
media. By contrast, the USA is able to optimise its digital economy through its
tech-savvy and well-connected Internet users.
26 © EU R O M O N I TO R I NTERNATI O NAL 2014Mobi l e In fluen ce Moves fr om We st to Ea st
Although China is quickly maturing, the USA market is
able to more successfully monetise digital services:
•• The USA remains the world’s leader in digital marketing, as continuous
innovations and maturity of the online advertising space enable greater
expenditure by brands and businesses on targeting Internet and mobile
users. In 2013, USA online ad spend stood at USA$33.9 billion, well
ahead of the USA$7.9 billion spent in China.
•• USA consumers have greater access to digital services, with IPTV, high-
speed broadband Internet and Video-on-Demand much more readily
available. As a result, operators and providers are able to generate much
greater revenues from the consumer market. The USA boasted telecom
revenues of USA$528 billion in 2013, compared to China’s USA$180
billion in 2013.
Nonetheless, success in China is becoming key for both digital vendors and
service providers. The influence of the global mobile landscape has already
switched from the innovative but saturated USA economy to the more dynamic
and populated Chinese marketplace, and continued economic growth in the
Asian nation will enable greater digital gains in other segments going forward.
Pavel Marceux
Technology, Communications and Media Analyst
© EUROMONITOR INTERNATIONA L 201 4 27THE STATE OF
INTERNET RETAILING
Much has been written recently about the explosive growth in Chinese
e-commerce and the country’s imminent rise to become the leader in the
global online shopping arena, overtaking the USA in the process when taking
consumer-to-consumer sales into account. While strictly comparing revenue
levels, the number of internet users and other sterile data is important,
it nevertheless provides little insight into the dynamics of the two online
shopping environments. It also neglects to offer any level of understanding
of the factors that are shaping the significantly different and sometimes
contrasting online shopping experiences. Additionally, focusing on sales data
tends to overlook the unique shopping attitudes and habits of consumers
that drive the respective markets. Indeed, a closer examination of these often
unique consumer behaviours can provide a better look and a more insightful
comparison of the state of internet retailing in the two countries.
First, it is clear that the considerable differences in internet retail infrastructure
in the two countries have had a strong influence on respective online
purchasing behaviour. Among these fundamental differences is the prevalence
in the Chinese market of the consumer-to-consumer internet retail model
with its proliferation of small, independent sellers offering a massive range of
products, a result of the success of Alibaba’s Taobao and the relatively small
proportion of retailer sites. The dominance of this model has led to Chinese
consumers typically being far more concerned than USA consumers about the
authenticity of the products they buy as well as opportunities for fraud that
might be perpetrated by little-known sellers. In the more mature USA online
retail market, retailer, manufacturer and brand sites dominate, resulting in
28 © EU R O M O N I TO R I NTERNATI O NAL 2014Th e State of In ter n et R e taili n g
consumers enjoying a suitable level of comfort and trust in the sites they visit.
Due to relatively poor logistics throughout China, from inefficient national
delivery services and inadequate warehousing facilities to services and
restrictive regulations, Chinese consumers, particularly those in rural areas,
tend to place greater value on basic delivery such as schedules being met,
collection options and easy returns. In contrast, most USA online buyers,
regardless of where they happen to live, tend to take these services for granted
and would be surprised if their expectations were not met.
Payment methods used by consumers to pay for their online purchases are also
different in the two countries. In the USA, the primary way to pay for products
bought online is via credit or debit cards or through payment facilitators such
as PayPal. In China, far fewer consumers have credit or debit cards and, even if
they did, it would be doubtful if many small, independent online sellers would
even accept them for payment. As a result, third-party payments and cash on
delivery are still common in China, as is the popular escrow model used by
Alibaba’s Alipay system.
But beyond these structural factors, many of the unique online shopping habits
of Chinese and American consumers stem from how they tend to traditionally
approach their personal shopping, regardless of the channel. A recent article
in Business Insider magazine observed that while Western consumers,
including those in the USA, find the greatest benefit of online shopping to be
convenience, “their counterparts in China purchase online primarily to find
good value,” adding it is “not news that Chinese consumers [are] generally
price-sensitive.” In contrast, according to A T Kearney, online shoppers in the
United States seek competitive prices but they also greatly value “easy payment
options, quick delivery and free returns, and top-notch customer service,”
expecting the same level of service they demand when shopping in brick-and-
mortar retail stores.
In terms of the way consumers in both countries glean the internet for
product information, Business Insider went on to describe another significant
difference: “Chinese consumers prefer a much more comprehensive, even
overwhelming, online presentation style while in Western countries it is better
to keep the website clean and simple. To be specific, a multi-angle display and
informative description of products is extremely important for Chinese online
shoppers. Detailed photos and descriptions can effectively mitigate their
concern about product quality, and thus make the store trustworthy… Instead
of feeling overwhelmed, Chinese consumers like to have a quick overview of
© EUROMONITOR INTERNATIONA L 201 4 29T he State o f I nte r ne t Retai ling
overall collections and access to different categories quickly.”
A further difference between Chinese and American online consumers is the
dominance of mobile shopping in China. Recent surveys have revealed that
three-quarters of smartphone users in China have said they’ve used their
devices to make purchases online compared to around one-quarter of American
smartphone users.
Indeed, the strength of mobile shopping in China was highlighted on Singles
Day in November 2013 when Alibaba-owned Taobao registered record sales of
USA$5.7 billion in 24 hours. Twenty-five percent of those sales were the result
of consumers purchasing products using their mobile devices. In contrast, on
Cyber Monday in 2013 in the USA, mobile sales accounted for 17% of total
sales, up from around 11% in 2012.
Clearly, relying solely on overall retail sales numbers does not tell the whole
story of the competing internet retail environments in China and the USA.
Those that do will overlook many of the nuances and details that provide
context and, in turn, provide insight into consumer dynamics and expectations.
Yes, the Chinese online market is growing faster and—depending on how
you measure it—may soon be larger, but many Chinese consumers do not yet
benefit from many of the highly developed customer services that make the
USA experience so rich and, from a USA consumer point of view, so satisfying.
On the other hand, the lack of customer service in China certainly hasn’t
slowed growth.
Among the intriguing questions in coming years will be whether the Chinese
online shopping experience will evolve and become more ‘American’ or will it
remain ‘local’ and somewhat idiosyncratic. The best guess, based on the massive
investments now being made by Chinese online businesses to enhance their
services, is the former. Observers should also expect to see far more retailer
sites serving Chinese online consumers, with significant growth overall in the
number of business-to-consumer sites at the expense of consumer-to-consumer
sites. Also expect to see significant improvements in logistics and customer
services and, in turn, a rise in the expectations of Chinese consumers shopping
online. Once these customer enhancements are commonplace in the Chinese
online shopping environment, it may be safe to say that, indeed, the biggest
online market is the best.
Jennifer Elster
Consumer Lifestyles Manager
30 © EU R O M O N I TO R I NTERNATI O NAL 2014You can also read