A Strategy for Developing a Market for Nonperforming Loans in Italy - WP/15/24
←
→
Page content transcription
If your browser does not render page correctly, please read the page content below
WP/15/24

A Strategy for Developing a Market for
    Nonperforming Loans in Italy
      Nadège Jassaud and Kenneth Kang
WP/15/24
© 2015 International Monetary Fund
IMF Working Paper
European Department and Strategy Policy and Review Department
A Strategy for Developing a Market for Nonperforming Loans in Italy
Prepared by Nadège Jassaud and Kenneth Kang1
Authorized for distribution by Vikram Haksar and Petya Koeva Brooks
February 2015
This Working Paper should not be reported as representing the views of the IMF.
The views expressed in this Working Paper are those of the author(s) and do not necessarily
represent those of the IMF or IMF policy. Working Papers describe research in progress by the
author(s) and are published to elicit comments and to further debate.
Abstract
Addressing the buildup of nonperforming loans (NPLs) in Italy since the global financial crisis
will remain a challenge for some time and be important for supporting a sustained, robust
economic recovery. The buildup reflects both the prolonged recession as well as structural
factors that have held back NPL write-offs by banks. The paper discusses the impediments to
NPL resolution in Italy and a strategy for fostering a market for restructuring distressed assets
that could support corporate and financial restructuring.
JEL Classification Numbers: E440, K22, G33, G38
Keywords: NPLs, NPL disposal, distressed assets, problem loans, bad debt, write-offs,
corporate restructuring, debt restructuring, bad bank, AMCs, Asset Quality Review, Balance
Sheet Assesment, Resolution.
Author’s E-Mail Address: njassaud@imf.org; kkang@imf.org
1
This paper, which expands on the findings of the IMF Article IV and Selected Issues Paper (2013), has benefited
from comments and inputs received from colleagues at the Italian Ministry of Economy and Finance, Bank of Italy,
academia (Jan-Pieter Krahnen and Michael Schneider, University of Frankfurt) and market participants (in
particular, Daniela Andreatta, Patrizio Messina, Ettore Consalvi, Francesco Faldi, Jacopo Lambri, and Paola
Sabione). David Velazquez and Jesse Siminitz provided valuable research support, and Sasha Pitrof and Katherine
Cincotta provided editorial assistance. Any remaining errors in the paper are ours. The views expressed are our
own and are not necessarily the official views of the IMF.3
Contents Page
Abbreviations and Acronyms ...............................................................................................................................4
I. Introduction .......................................................................................................................................................5
II. Current Situation with Nonperforming Loans in Italy .....................................................................................6
A. High and Rising Stocks of Nonperforming Loans ............................................................................6
B. Low Cash Provisioning and Write-offs .............................................................................................7
C. Implications of Slow Pace of Write-offs ...........................................................................................8
III. Reasons Behind the Slow Pace of NPL Resolution ........................................................................................10
A. Supply Factors: Limited Incentives for Banks to Sell and Write Off ................................................11
B. Demand Factors: High Cost and Limited Options for Restructuring ................................................14
IV. A Strategy for Developing a Market for Nonperforming Loans in Italy ........................................................15
A. Benefits of a Market for Nonperforming Loans ................................................................................15
B. Current State of the Distressed Debt Market .....................................................................................17
C. Strategy for Fostering a Market for Nonperforming Loans ...............................................................19
V. Conclusion .......................................................................................................................................................27
Figures
1. Italy: Nonperforming Loans ............................................................................................................................... 6
2. NPLs in EU, USA and Japan, 2008–2013 .......................................................................................................... 6
3. Nonperforming Loans by Region ....................................................................................................................... 7
4. Corporate Leverage in Italy and Euro Area, 2014Q1 ......................................................................................... 7
5. Nonperforming Loans and Coverage Ratio, June 2014 ...................................................................................... 7
6. Write-offs and NPL Rations ............................................................................................................................... 8
7. Bad Debt Ratio for Different Rates of Write-offs .............................................................................................. 8
8. NPL Ratio Versus 5Y Credit Default Swap Spreads, June 2014...................................................................... 10
9. NPL Ratios and Provisions in Percent of NPLs ............................................................................................... 10
10. Nonperforming Loans Net of Provisions to Capital, June 2014 ..................................................................... 11
11. Nonperforming Exposures Before and After the ECB AQR in Italian Banks, December 2013 .................... 12
12. Nonperforming Loans in Japan ...................................................................................................................... 16
13. Who Buys and Sells Italian NPLs? ................................................................................................................. 17
14. Distressed Debt Markets in Europe ................................................................................................................ 19
15. Stocks of Nonperforming Loans in the Corporate Sector, March 2014 ......................................................... 21
16. Bank-led Voluntary Restructuring Process for Corporate Loans ................................................................... 24
Boxes
1. Calculating the Cost of Capital for Holding Nonperforming Loans ................................................................... 9
2. The European Central Bank’s Balance Sheet Assessment and Results for Italy .............................................. 12
3. How Does the Accounting Approach to Accured Interest Disincentivize Write-offs? .................................... 14
4. Japan's Experience with Distressed Loan Markets ........................................................................................... 16
5. UniCredit and Intesa Partnership Initiative with Kohlberg Kravis Roberts and Alvarez & Marsal ................. 18
6. International Practices for the Write-off of Nonperforming Loans .................................................................. 20
7. The Swedish Approach of Nonperforming Loan Resolution ........................................................................... 21
8. The Icelandic Crisis and the Corporate Debt Restructuring ............................................................................. 24
9. Korea’s Experience with Corporate Restructuring ........................................................................................... 26
References ............................................................................................................................................................ 294
ABBREVIATIONS AND ACRONYMS
A&M Alvarez & Marsal
ABS Asset Backed Securities
AMC Asset Management Company
AQR Asset Quality Review
BoI Bank of Italy
BSA Balance Sheet Assessment
CET1 Common Equity Tier One
CRC Corporate Restructuring Company
CRF Corporate Restructuring Fund
CRV Corporate Restructuring Vehicle
DFA Deferred Tax Asset
FSA Financial Service Authority
FSS Financial Supervisory Service
HQS High-Quality Securitization
ICR Interest Coverage Ratio
IRBA Internal Ratings-Based Advanced
IRBF Internal Ratings-Based Foundation
IRR Internal Rate of Return
ISP Intesa San Paolo
KAMCO Korea Asset Management Company
KKR Kohlberg Kravis Roberts
NCA Noncore asset
NPE Nonperforming Exposure
NPL Nonperforming Loan
RCC Resolution and Collection Corporation
RWA Risk Weighted Asset
SME Small- and Medium-Sized Enterprise
SPV Special Purpose Vehicle
SSM Single Supervisory Mechanism
UCG UniCredit Group
UL Unexpected Loss5
I. INTRODUCTION
High and rising levels of nonperforming loans (NPLs) in Italy continue to weigh on
banks’ balance sheets. Since the onset of the global financial crisis, NPLs have more than
tripled to 17 percent (June 20142) of total loans, from just above 5 percent in 2007. The rapid
rise reflects in part the prolonged recession which has worsened the creditworthiness of
borrowers, particularly small- and medium-sized enterprises (SMEs). At the same time, the
inefficient and lengthy judicial process, combined with the limited incentives to write off
loans, has held back the pace of NPL resolution. Without a significant pick-up in write-offs,
NPLs will continue to remain high and a drag on bank profitability and market confidence.
The Italian authorities have taken a number of measures to promote NPL resolution.
The Bank of Italy (BoI) special inspections and the ECB Asset Quality Review (AQR) have
enhanced the transparency of problem loans and boosted provisioning. Recent tax reforms
have also made it more favorable for banks to set aside loan loss provisions. As a result,
banks have increased provisioning against bad loans and raised additional capital, along with
announcing plans to offload some of their NPL portfolio.
To complement these efforts, further development of a market for restructuring NPLs
in Italy would allow banks to more rapidly and efficiently address their distressed
assets.3 As seen in other countries, involving outside investors in either directly purchasing
NPLs or working with banks to restructure distressed borrowers can help Italian banks to
reduce their NPL stock and over time, become a regular tool for managing bad loans. Interest
in a distressed debt market is growing in Europe, with NPL transactions estimated to have
reached €64 billion in 2013.4 The market in Italy has also picked up, with the announcement
by two of the largest banks, UniCredit (UCG) and Intesa (ISP), to partner with outside
investors in setting up special purpose vehicles (SPVs) to manage a portion of their NPLs.
This paper discusses a strategy to foster a distressed debt market that would contribute
to addressing the NPL and debt overhang problem. Such a market would relieve the
burden on banks for debt collection and collateral foreclosure, by boosting the recovery
values of bad loans and leveraging outside financing and expertise. Facilitating debt
restructuring and equity conversions could also inject significant capital into the corporate
sector and help promote “good” deleveraging. Ultimately, such a market could generate a
virtuous circle, where progress in cleaning banks’ balance sheets and restructuring distressed
2
BoI, consolidated data.
3
In an address at the Italian Banking Association Annual Meeting in July 2014, Bank of Italy Governor Ignazio Visco also
highlighted the benefits of developing a secondary market for NPLs.
4
PricewaterhouseCoopers, 2014.6
borrowers strengthens confidence, improves bank profitability, and frees up resources to
support new lending in a recovery.5
The paper is organized as follows: Section II describes the current situation with NPLs in
Italy, while Section III outlines the factors behind the slow pace of NPL resolution. Building
on international experience, Section IV describes the potential benefits of a market for NPLs
for Italy and ways to foster its development; Section V concludes.
II. CURRENT SITUATION WITH NONPERFORMING LOANS IN ITALY
A. High and Rising Stocks of Nonperforming Loans
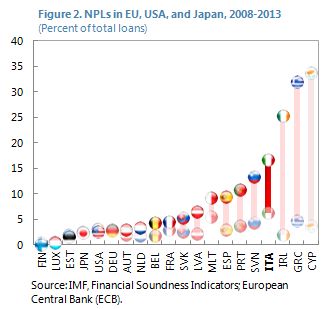
Nonperforming loans in Italy have tripled since 2007, reaching a historical peak. NPLs
in Italy cover four categories: "bad debt” (loans in a state of insolvency), "substandard," "past
due," and "restructured" loans (Figure 1). NPLs have grown at around 20 percent annually
since 2008, topping €333 billion in June 2014 (24 percent of GDP or 16.8 percent of total
loans). The worst NPL category—sofferenze or “bad debt”—has increased the most and now
accounts for more than half of total NPLs. Compared to the European average, the NPL ratio
in Italy is more than four times greater6 and has increased at a much faster pace (Figure 2).
Figure 1. Italy: Nonperforming Loans
20
Past due
Restructured
15
Substandard
Bad debt
10
5
0
2007 2009 2011 2013
Source: IMF Financial Soundness Indicators; European
Central Bank (ECB).
More than 80 percent of bank NPLs are in the corporate sector.7 Corporate NPL ratios
have reached nearly 30 percent on average in 2014 and are significantly higher in the South
(Figure 3). High corporate NPLs reflect both weak profitability in a severe recession as well
the heavy indebtedness of many Italian firms, especially SMEs, which are among the highest
5
Private Sector Deleveraging and Growth Following Busts,” 2014, by Sally Chen, Minsuk Kim, Marijn Otte, Kevin
Wiseman, Aleksandra Zdzienicka, IMF WP forthcoming.
6
In some cases, comparisons may be undermined by differences in the NPL definitions adopted in the different IFRS
jurisdictions. Since January 2015, BoI has aligned the Italian definition of NPLs to the nonperforming exposure (NPE) and
forbearance notion provided by the EU regulation on supervisory reportings.
7
BoI. As of March 2014, corporate loans amount to €1,037 billion (52 percent of total bank loans in Italy), of which
corporate NPLs account for almost €300 billion (solo basis data).7
in the Euro Area (Figure 4). This picture is consistent with corporate survey data which
shows nearly 30 percent of corporate debt owed by firms whose earnings (before interest and
taxes) are insufficient to cover their interest payments.8
Figure 3. 3.
Nonperforming Loans Figure4.
Figure 4.Corporate
CorporateLeverage,
Leverage,2012
2012
Figure Non-Performing Loanby
byRegion
Region
(Percent)
(Percent)
180
180
160
140
120
100
100
80
80
60
60
40
40
20
20
0
0
SVN
FRA
HUN
ITA
ESP
AUT
GRC
PRT
POL
IRL
SVK
EST
FIN
DEU
BEL
CZE
SVN
ITA
GRC
PRT
Source: OECD.
Source: IMF staff calculations. and Bank of Italy Source:Corporate
OECD. leverage is defined as debt to equity.
Source: IMF staff calculations. Note:
Note: Defined as total liabilities over equity in non
B. Low Cash Provisioning and Write-offs
Provisioning coverage has not kept pace Figure 5. Nonperforming Loans and Coverage
Ratio, June 2014
with the rise of NPLs and is uneven across 60 25
NPLs (rhs)
banks. The average provisioning coverage for 50
Provisioning ratio
EU average: 45% 20
Italian banks has declined from 48 percent in
2007 to a low of 37 percent in June 2012. As a 40
15
result of the BoI’s special loan inspections and
30
in preparation for the European AQR, 10
provisioning coverage has subsequently 20
increased to 42 percent in June 2014. The 5
10
improvement, however, varies, with mid-
sized9 and smaller banks featuring lower 0 0
Large banks Mid-size banks Small banks
coverage ratios (Figure 5).10
Source: BOI; ECB.
The pace of NPL write-offs has also slowed. The average time for writing off a bad loan
has increased to over six years,11 from just under four years before the crisis. In 2013, on
average less than 10 percent of bad debt, despite already being in a state of insolvency, was
8
IMF Global Financial Stability Report, April 2014.
9
In this paper, the large banks refer to the top 5 Italian banks in terms of total assets. Mid-sized banks refer to the 6th to 15th
largest Italian banks. Small and minor banks refer to banks beyond the 16th largest bank.
10
On average, smaller banks display higher capital ratios.
11
BoI Financial Stability Review, April 2013 and IMF Detailed Assessment of Observance of Basel Core Principles for
Effective Banking Supervision, December 2013, page 120 (stressing the age of the NPL portfolio in Italy).8
Figure 6. Write-Offs and NPL ratios
written off or sold.12 The bad debt write-off 18
NPL ratio (percent of total loans), right scale
30
rate varies significantly across the major 16 Bad debt write-offs (percent of bad debt)
25
banks, with banks with the highest NPL 14
ratios featuring the lowest write-off rates
12 20
(Figure 6).
10
15
The slow pace of write-offs is an 8
important factor in the rapid buildup of 6 10
NPLs. Write-offs13 or sales to third parties 4
are one of the most efficient and quickest 5
2
means of removing bad assets from banks’
0 0
balance sheets. Italian banks, on the other
MPS Intesa Unicredit UBI Banco
hand, tend to hold on to NPLs, while Popolare
Sources: BoFA, Annual Reports.
pursuing internal collection and loan
restructuring efforts. In normal downturns, this strategy has allowed banks to gradually
reduce NPLs as the flow of new bad debt declines with the recovery. However, with the
prolonged recession, the inflow of new NPLs has remained high while write-off rates have
not increased significantly, leading to a large backlog of bad debts.
C. Implications of the Slow Pace of Write-offs
Without a significant pickup in write- Figure 7. Bad Debt Ratio for Different Rates of Write-offs 1/
14
offs, NPLs will remain high for a
prolonged period. Staff simulations 12
8% (current)
suggest that at the current write-off pace
10
and assuming a modest decline in default
rates next year, the bad debt ratio would 8
20%
peak only in 2019 and decline gradually
6
thereafter. In the absence of a stronger
recovery, it will take a substantial increase 4 35%
in write-offs (and sales)—nearly five times
2 2007 = 3.1
compared to the current rate—to bring
down the bad debt ratio to pre-crisis levels 0
within ten years (Figure 7), highlighting 2007 2009 2011 2013 2015 2017 2019 2021 2023
the significant challenge in addressing the Sources: Bank of Italy; and IMF staff estimates.
1/ The simulation assumes a 2 percent default rate, reduced to 1.7
huge backlog created by the slow pace of from 2016 and to 1 from 2019, and a 1 percent loan growth. Write
off rates are expressed as a percentage of bad debt and include
write-offs. sales.
12
In 2013, the bad debt write-off rate was 7.7 percent, including sales of NPLs.
13
A loan that is written off is removed from the balance sheet, while a loan that is written down (provisioned) is still on the
balance sheet, albeit at a lower value net of impairments (provisions), with a possibility to recover the initial value.9
High NPLs depress bank profitability and constrain new lending. On the revenue side,
NPLs generate a “negative carry,” as they do not produce cash interest revenues, yet require
funding at market rates. This in turn pushes up interest rates on performing loans to
compensate for the lost revenue. Holding NPLs also tie up human and operational resources
and involve legal and administrative costs, which could be used to support new investment.
NPLs, even if adequately provisioned, also absorb valuable bank capital which if released,
could support fresh lending. For example, staff estimates of the capital cost for NPLs (as high
as 6 percent of capital for the largest bank) suggest that selling the bad debt portion of NPLs,
i.e., those already in insolvency and are full provisioned, could free up significant capital to
support new loans (Box 1).
Box 1. Calculating the Cost of Capital for Holding Nonperforming Loans
In large Italian banks, NPLs, even if adequately provisioned, absorb valuable bank capital.
Calculating the cost of capital for holding NPLs depends on the credit risk approach:
For banks using standardized methods, the capital charge for NPLs amounts to 12 percent of risk
weighted assets but only applies to NPLs that are inadequately provisioned or not collateralized. Most
mid-sized and all small Italian banks follow standardized methods.
Under the internal ratings-based models, the capital charges on NPLs depend on the risk approach.
- For banks under the Basel II IRB Advanced (IRBA) approach, the capital cost for NPLs is twofold: (i)
a capital deduction for the provision shortfall between Basel II expected losses and IFRS accounting
provisions. This capital deduction is known as the “IRB shortfall,” and (ii) a capital charge for gross
NPLs (i.e., even if adequately provisioned), based on banks’ internal models. All large Italian banks
(UCG, ISP, MPS, Banca Popolare, and Ubibanca) are under the IRBA approach.
- In contrast, banks under the IRB foundation (IRBF) approach are only required to deduct the “IRB
shortfall.” There is no other capital charge on NPLs. In Italy, only two mid-sized banks follow IRBF
methods.
Based on the example of the largest Italian bank, NPLs are estimated to tie up more 6 percent of capital
and if sold, could free up significant resources for new lending. The capital cost of holding NPLs can be
approximated through the recent disclosure on noncore assets (NCAs) by the largest Italian bank, UCG. In
June 2014, UGC reported €81 billion of NCAs absorbing €2.7 billion of capital, i.e., 6 percent of UCG’s
CET1.14 If the bad debts from the NCAs were sold at book value,15 the capital released could amount to
€1.6 billion, possibly supporting up to €56 billion in new lending.
Sources: Basel Committee on Banking Supervision The Internal Ratings-Based Approach Supporting
Document to the New Basel Capital Accord, 2001; UniCredit, “UniCredit Group: Guidelines of Strategic Plan
2013–18,” and “Fixed income presentation,” December 2014.
14
NCAs include bad debts and problem loans, i.e., performing loans with higher risk. They absorb €33.4 billion of RWAs.
One third of UGC’s NPLs is not reported as NCAs, therefore not included in this capital calculation. Hence, it represents a
low base estimate for large banks.
15
The calculation is made under the assumptions that the high provisions on bad debt would not imply further losses. When
there is pricing gap, the capital releases may be less (see part III).10
High NPLs also lower bank valuations and increase the cost of funding. Weak asset
quality may be an important factor in explaining Italian banks’ higher CDS spreads and
lower market valuations compared to banks in
Figure 8. NPL Ratio versus 5Y Credit Default Swap Spreads,
the rest of Europe and the United States June 2014
(24 Large International Banks)
(Figure 8). Because probabilities of default and 250
loss given default are highly correlated, higher
ITA
NPLs in an economic downturn lead to lower 200 ITA
recovery values and larger credit losses. There
5Y CDS Spread
150
is also empirical evidence that banks with
worse asset quality are more sensitive to 100
ITA
sovereign distress, 16pushing up risk premia in
the real economy. High levels of NPLs 50
exacerbate this sensitivity by raising the range
surrounding possible future losses. 0
0 5 10 15 20 25 30 35
Non-Performing Loans Ratio, June 2014
The slow pace of write-offs in Italy stands in Sources: Bloomberg; and SNL.
Note: The sample involves 24 large international banks across the
contrast with other countries that have United States and the EU.
experienced a rapid buildup in NPLs. For Figure 9. NPL Ratios
example, after U.S. banks’ NPLs peaked at 18
(Percent of total loans)
5 percent in 2009, provision and write-off rates 16
NPL: Italy
rose quickly, helping to push U.S. NPL ratios to NPL: EU
14
NPL: USA
below their pre-2008 levels within 3 years 12
(Figure 9). Similarly, in Japan after its banking 10
crisis, aggressive supervisory policies helped 8
reduce the NPL ratio of major Japanese banks 6
from 8.5 percent in 2000, to below 2 percent in 4
2005 (see Box 4). In contrast, NPLs in Italy and 2
the euro area as a whole continue to rise, 0
2005 2006 2007 2008 2009 2010 2011 2012 2013
reflecting in part slow write offs and sales. Sources: ECB; Federal Reserve Economic Data; and IMF, FSI.
III. REASONS BEHIND THE SLOW PACE OF NPL RESOLUTION
Both supply and demand factors are behind the slow pace of NPL resolution. Factors
limiting supply relate to the limited incentives for banks to write off and sell NPLs. Low
provisioning of problem loans represents a significant obstacle, leading to large gaps in
pricing. Other impediments include limited capital to absorb further losses, the accounting
treatment of the write-offs under IFRS, and a tax regime that tends to penalize aggressive
provision and write offs. On the demand side, the slow pace of NPL resolution is held back
16
On sovereign distress and bank funding, see CGFS 43, The impact of sovereign credit risk on bank funding conditions”,
July 2011.11
by a lengthy and inefficiency judicial system and the lack of a secondary market for NPLs.
A. Supply Factors: Limited Incentives for Banks to Sell and Write Off
1. Low provisions and capital buffers
Low provisioning for problem loans has led to large pricing gaps that have held back
write-offs and sales. When provisioning is too low, write-offs generate losses that are
immediately taken out of bank capital. Similar to writing off, selling NPLs would imply
some discount compared to book valuations, if investors perceive current provisioning as too
low. Depending on the type of loans, this NPL “pricing gap” between book and market
values is reported to be around 15–20 percent and to have narrowed recently, partly as a
result of the BoI’s special inspections in 2012 and the European AQR. The pricing gaps also
partly reflects different provisioning rates for the same borrower across banks, which can
lead to creditor holdout problems when trying to sell distressed loans.
Banks also face the incentive to hold on rather than dispose of provisioned loans to
boost their overall provisioning coverage ratios. The provisioning ratio is defined as cash
provisions to gross loans and is a commonly used indicator for assessing credit risk. Putting
aside the benefits of disposing NPLs, writing off bad loans that are highly or fully
provisioned reduces the provisioning coverage ratio by lowering gross loans (the
denominator) more than level of provisioning (the numerator).17 In normal times when NPLs
are low, banks may be indifferent to the impact of NPL disposal on their coverage ratios.
However, when NPLs are high and coverage is low, banks may face strong market pressure
to maintain their provisioning coverage ratio and hold on to highly provisioned loans, rather
than disposing. Figure 10. Non-Performing Loans Net of Provisions to
Capital, June 2014
(Percent)
Capital buffers remain thin to absorb future credit Greece
losses. The low level of sales and write-offs may also
Italy
reflect banks’ limited buffers to absorb further losses.
Ireland
As of December 2013, 13 out of the 15 large Italian
Portugal
banks had a CET1 ratio below their Euro Area peer
average (11.4 percent).18 Moreover, the ratio of Germany
unprovisioned NPLs to capital and reserves—the so- France
called “Texas ratio”—stood at around 90 percent in UK
June 2014, well above those of other EU countries USA
(Figure 10), highlighting Italian banks’ vulnerability to 0 50 100 150
further credit losses.19 Source: IMF, Financial Soundness Indicators (2012 for UK).
17
For instance, assuming a bank has half of its bad debt provisioned at 60 percent and the other half at 20 percent, its
average provisioning ratio would be 40 percent. If the bank was to write off or sell the 60 percent provisioned debt, its
provisioning ratio would fall to 20 percent.
18
ECB, October 2014. Since January 2014, the large Italian banks have raised capital; their weighted capital CET1 ratio
reached 11.5 percent as of end-June 2014.
19
The “Texas ratio” has been used as crude measure of a bank’s likelihood of failure by comparing its bad assets to
available capital and reserves. A ratio above 100 percent indicates that banks have insufficient cash to cover fully losses on
(continued…)12
2. Heavy reliance on collateral and close relationships with borrowers
Bank’s reliance on collateral also limits the incentives to write-off or sell. Italian banks
remain heavily reliant on collateral, covering over two-thirds of loans, mainly in the form of
personal guarantees or real estate.20 While collateral provides added security against losses, it
also encourages banks to wait and collect at the end of foreclosure rather than to dispose
immediately. In other words, with paid collateral providing coverage against further losses,
banks possess a “zero-cost call option” to wait for the loan value to recover. Selling collateral
at below book value could also lead to the re-pricing of other similar collateral and lower
further banks’ overall provision coverage.
In addition, disposing of loans based on long standing relationships may pose
reputational risks. In general, relationship-based lending reinforces banks’ ability to assess
the creditworthiness of borrowers, especially SMEs, and address information asymmetry
issues by relying on “soft” information gathered by loan officers, through continuous, direct
contacts with the owners and managers, and the local community in which they operate.
Aggressive NPL disposal may undermine banks’ business reputation and model, raising the
cost for early NPL disposal and the likelihood of a more drawn out resolution process.
Box 2. The European Central Bank’s Balance Sheet Assessment and Results for Italy
In October 2014, the ECB published the results of the Figure 11. Nonperforming Exposures Before and After the ECB AQR in
Italian Banks, December 2013
comprehensive Balance Sheet Assessment (BSA). This exercise, 45
performed by the ECB in cooperation with the national supervisors, 40
reviewed the balance sheets of 130 Euro Area banks, of which 15 35
were Italian banks. 30
25
Methodology. Based on year-end 2013 accounting data, the
20
comprehensive BSA included two steps:
15
10
An Asset Quality Review (AQR), which assessed the
5
adequacy of provisions and collateral valuations.
0
A baseline and an adverse stress test scenarios, over a three
year horizon (2014–2016).
Under the AQR and the baseline scenario, the banks’ capital Source: ECB
adequacy was evaluated against an 8.0 percent common equity
capital threshold, and under the adverse scenario, a requirement of 5.5 percent.
Results for Italian banks:
Capital. The results highlighted €9.7 billion of capital shortfall for nine Italian banks out of the 15 under review (December
2013). After accounting for the capital increases undertaken between January and September 2014, the capital shortfall
applied to only four banks, amounting to €3.3 billion.
Provisioning. The AQR disclosed an average discrepancy of 10 percent 21 on gross NPE, based on the sample of audited
loans. For 11 banks, more than one fifth of the exposure was not performing (Figure 11).
their bad loans. The ratio was developed in the late 1980s and early 1990s to gauge the likelihood of bank failure in Texas.
In 1989, more than 20 percent of the banks in Texas had a ratio that exceeded 100 percent, leading to more than 130 failures.
20
According to the Credit Register data, one quarter of corporate loans are backed by real estate collateral, with the
remaining security in the form of personal guarantees.
21
BoI Financial Stability Review, November 2014. This figure is about half the corresponding figure for the entire SSM.13 3. Tax disincentives to provisioning and write-offs The tax regime in Italy tends to penalize banks that aggressively provision and write off their NPLs. Until recently, write-offs in Italy were not tax deductible without a court declaration of insolvency, which could take several years. Banks were allowed to deduct loan-loss provisions from taxable income only up to 0.3 percent of outstanding loans. The remaining provisions were treated as a deferred tax asset (DTA) that could be deducted from taxable revenues in equal installments over 18 years but at a lower net present value. The cap on tax deductibility was a disincentive for banks to provision their bad loans more aggressively. The law was changed in 2013 and now allows provisions and write-offs to be deducted in equal installments over five years with a higher tax rate (including the regional tax IRAP).22 This is still more restrictive than in most other countries, but compared to the past, provides greater incentives for banks to provision. Public agency’s priority status in bankruptcy may also deter banks from initiating debt restructuring or pursuing liquidation. Tax authorities like other public debtors (social security) in Italy benefit from a higher priority claim than other unsecured creditors in bankruptcy procedures. For firms that have accumulated large public arrears with preferred creditors, this may diminish banks’ incentives to pursue bankruptcy procedures on borrowers. 4. Accounting regime favorable to holding NPLs The lack of accounting guidance under IFRS lengthens NPL write-offs. Similar to other European banks, banks in Italy base their financial reports on IFRS, where the current rules (IAS 39) do not specify when and how to write off uncollectible loans.23 In the absence of clearly defined write-off rules under IAS 39, some banks 24 follow the rules for loan cancellation (derecognition), which require banks to exhaust all legal means or give up contractual rights on the loans before removing them from the balance sheet. 25 The new norm (IFRS 9), which comes into effect in January 2018, will include a definition of “write- off” that is different from loan cancellation and will reinforce the current guidance from BoI. The accounting approach to accrued interest allows banks to overstate earnings on NPLs. As IAS 39 permits interest on impaired loans (NPLs) to be accrued on certain categories of NPLs, banks continue to recognize uncollected interest income even though the borrower is unlikely to repay either the principal or the interest of the loan. This accounting 22 See A. De Vincenzo and G. Ricotti, “The use of tax law from a macroprudential perspective,” http://www.bancaditalia.it/pubblicazioni/note-stabilita/2014-0001/index.html. 23 “Supervisory Roles in Loan Loss Provisioning in Countries Implementing IFRS,” WP/14/170, Ellen Gaston and In Won Song. 24 This should in principle be mitigated by the general guidance provided by the BoI according to which write-offs take place when the management formally acknowledges the impossibility to collect the loan or part of it. However, some banks may have implemented laxer write off policies, limiting them to the loan cancellation. 25 The derecognition rule was designed for specific events, such as the sale or transfer of financial instruments.
14

treatment thus overstates interest income as well as banks’ provisioning ratio, providing a
strong incentive for banks to retain old NPLs that have accrued a large amount of uncollected
interest (Box 3).

     Box 3. How Does the Accounting Approach to Accrued Interest Disincentivize Write-offs?
Accrued interest under IFRS tends to overstate the interest income and to unduly boost provisioning ratios,
discouraging banks from writing off NPLs.1

According to IAS 39, loans classified as NPL continue to include interest in the estimated future cash flow
provided that the banks consider them recoverable based on historical collections (this is not the case for bad
loans, the so-called “sofferenze”).26

Mechanism. When accrued (uncollected) interest on NPLs is reported as income, bank’s true profits are
overstated. To compensate for this impact on profits and capital, accrued interest is offset by an opposite
accounting entry, i.e., a 100 percent provision. This accounting entry, however, adds to the stock of outstanding
provisions (numerator), while increasing the size of assets that are not likely to be recoverable (denominator). As
a result, the accounting of accrued interest overstates the calculations of banks’ provisioning ratio.

Illustration. In year 1, a bank holds 100 of NPLs, provisioned at 55 percent. In year 2, the accrued interest is
calculated at 1 and is provisioned at 100 percent. The total stock of provisions becomes 56 and the total NPLs
becomes 101. The provisioning ratio has mechanically increased by half a percent, from 55 to 55.5 percent. Over
years, this effect cumulates and can overstate the actual improvements in provisioning.

1/Accrued interest on “NPLs” accounted for €4.3 billion in December 2013, i.e., around 10 percent of the net
interest income. Banks do not accrue interest on bad loans (loans in state of insolvency).

           B. Demand Factors: High Cost and Limited Options for Restructuring

1. A lengthy and inefficient judicial process

The lengthy inefficient judicial process raises the cost of foreclosure and lowers the
return on NPL restructuring. By various measures, performance and efficiency of the
Italian justice system is well below the European and OECD averages. For example, it takes
on average more than seven years to complete a bankruptcy procedure and three years to
foreclose on real estate collateral. According to the World Bank Doing Business surveys,
Italy ranks low in resolving insolvency (#20 out of 31 OECD countries) and in enforcing
contracts (#30 out of 31). Legal uncertainties and a lengthy foreclosure process limit the
options for and drive up the cost of restructuring.

Despite improvements in the insolvency law, the large backlog of cases continues to rise.
Since 2005, various amendments to the insolvency system have allowed for both out-of-court
restructurings27 and court-led alternatives, such as composition with creditors. In 2007, the
authorities introduced a U.S. Chapter 11-like procedure (Concordato preventivo) that a
growing number of distressed firms have used. 28 Despite these improvements, the pace of

26
  Detailed Assessment of Observance of Basel Core Principles for Effective Banking Supervision, December 2013,
page 120.
15
insolvency remains slow. With the number of defaults having doubled during 2007–13, the
large backlog of cases (estimated at around 9.7 million in 2012) continues to grow and hold
back NPL resolution.29
Debt restructuring is also limited under the legal framework. For example, debt-equity
swaps, where the lender, usually a bank, reduces the borrower’s debt against an equal value
of new shares, are an important instrument in corporate restructuring. However, under the
Italian legal system, debt-equity swaps are effectively limited to restructuring under the
Concordato preventivo procedure which allows for cram down of dissenting creditors. In
out-of-court workouts, debt-equity swaps are possible but only on a consensual basis (with
no cram down). Even out-of-court enforcement of share pledge agreements is in practice
little used due to potential legal challenges by shareholders for the enforcing banks.30
2. A small investor base with limited risk capital
A small investor base and lack of equity capital have also limited demand for distressed
loans. Banks face inherent difficulties in corporate restructuring, given their traditional
lending focus and higher capital requirements under Basel III for holding converted equity.
Compared to banks, private equity or restructuring funds are better equipped in terms of risk
capital and expertise to undertake debt and operational restructuring of distressed firms. The
private equity market in Italy, however, is small, with only around €3 billion of transactions
annually. Institutional investors, such as pension funds and insurance companies, follow a
fairly conservative portfolio strategy, with only a small share invested in alternative assets,
such as distressed debt.
IV. A STRATEGY FOR DEVELOPING A MARKET FOR NONPERFORMING LOANS IN ITALY
A. Benefits of a Market for Nonperforming Loans
For banks, an active market for NPLs would facilitate disposals and support new
lending. A secondary market for NPLs would reduce the collection burden on banks and free
up resources and capital to support new lending. It would also help boost loan recovery
values by providing a more cost effective alternative to lengthy court procedures. A liquid
27
Out of court mechanisms are represented by the “reorganization plans” and “debt restructuring agreements.”
28
The Concordato Preventivo is a restructuring instrument through which the debtor can agree on a plan with creditors
(subject to a vote) to avoid bankruptcy. The procedure also grants an automatic stay against enforcements and precautionary
judgments (60 to 180 days), similar to the U.S. automatic stay, during which the debtor remains in possession and continues
to run the business.
29
IMF WP 14/32, “Judicial System Reform in Italy—A Key to Growth”, G.Esposito, S.Lanau, and S.Pompe.
30
When banks benefit from a share pledge agreement over the borrower, such a pledge can be used to force a debt-equity
swap in a distressed scenario (for instance, when a firm has a negative equity). However, in practice such a pledge is
difficult to enforce as there is no clear law and guidelines. Moreover, any enforcement process can be challenged, for
instance, by arguing it does not maximize the value of the shares, and as a consequence implying a damage for the existing
shareholders. See also Linklaters LLP, Insight and Foresight, “Navigating the European Loan Portfolio Market.”16
secondary market for distressed debt (and foreclosed collateral) would also enhance bank risk
management by providing another instrument to manage credit and market risks. Over time,
such a market could become a standard operational tool for Italian banks for offloading bad
assets and reorienting their loan portfolios.
Box 4. Japan’s Experience with Distressed Loan Markets
Starting in 1991, the collapse of the Japanese financial bubble lasted for more than a decade, with plummeting
asset prices resulting in high bank NPLs. In 2001–2002, the government took emergency measures to
simultaneously resolve the NPLs and corporate overhang. These measures had positive effects on financial
stability, with the NPLs reduced by more than a half in less than five years.
In 2001, the Japanese government outlined a Figure 12. Nonperforming Loans in Japan
9.0
strategy for addressing the NPL problem in the
banking system. The strategy called for major banks 8.0
to accelerate the disposal of NPLs from their books
7.0
within three years after their recognition. Banks were
expected to remove these loans either by selling them 6.0 Major banks
directly to the market, pursuing bankruptcy 5.0
proceedings, or by rehabilitating borrowers through
4.0
out-of court workout procedures. Any remaining loans
were to be sold to the Resolution and Collection 3.0
Corporation (RCC), which under the Financial
2.0
Reconstruction Law had been given new powers to
purchase distressed assets at fair market value and to 1.0
restructure companies. 0.0
2000 2002 2004 2006 2008 2010 2012
The centralized AMC was given special powers. Source: Bank of Japan.
RCC is a government-owned agency that was Note: Nonperforming loans are broadly defined as bank loans past 90 days
100 percent owned by Deposit Insurance due. There are some differences across countries in the exact definition, so
comparisons should be approached cautiously.
Corporation. Between 1999 and mid-2002, it acquired
¥55 trillion ($495 billion) in face value loans at a purchase price of ¥1.3 trillion (96 percent discount). The law
expanded its mandate to securitize NPLs, rehabilitate troubled firms and participate in debt-equity swaps. It was
entrusted with special investigative powers that allowed it to tackle difficult cases, such as real estate tied to
organized crime for banks that had been unable to collect or sell bad loans. The RCC could take on difficult
assets that other investors are unwilling to touch and help resolve intra-creditor dispute and strengthen the
leverage in negotiating with the debtors. The RCC also improved the transparency of the NPL market by setting
standards of disclosure and publishing information on collateral.
In a second step, the government shifted the supervisory emphasis to exiting nonviable corporates and
restructuring viable ones. The FSA tightened the collateral valuation for nonviable borrowers by requiring
banks to mark down collateral to market prices. This induced banks to sell their real-estate collateralized loans,
which in turn created a market for distressed collateral sales. In the beginning, since the number of active
investors was very limited, transactions were executed on a bilateral basis, at low prices. As the number of
investors increased and as the banks improvised on using auctions in their collateral sales, the returns to investors
decreased. Japanese buyers gradually replaced foreign investors. The government announced the Financial
Revitalization Program to promote corporate debt restructuring for large firms (2002). The FSA tightened loan
assessment standards for large borrowers, using market information such as stock prices, credit ratings and
discounted cash flow analysis to evaluate the viability of the underlying corporates. This led banks to reclassify
part of their portfolio to sub-performing and sell them.
Sources: Kazunari Ohashi and Manmohan Singh, “Japan’s Distressed Debt Market,” IMF WP/04/86, May 2004;
Japan’s Lost Decade, Policies for Economic Revival, Tim Callen and Jonathan D. Ostry.17
A market for NPLs would also support corporate restructuring and expand sources of
financing. An active market for NPLs would improve secondary market liquidity for loans
and attract a wider range of institutional investors, such as private equity funds, asset
managers, insurance companies, and pension funds, including from overseas, to assist in
corporate restructuring. These institutional investors could help expand nonbank sources of
financing and provide another source of needed capital for the corporate sector.31 In the near
term, a market for NPLs could support a faster recovery by facilitating the exit of nonviable
firms and supporting the growth of viable ones. Over time, a distressed debt market could
help promote more broadly the reallocation of resources towards more productive corporates
and assist in their reorganization and expansion.
B. Current State of the Distressed Debt Market
Despite the buildup in NPLs, a market for restructuring distressed debt in Italy has yet
to pick up after the global financial crisis. Compared to the large size of NPLs
(€333 billion), the market for distressed debt remains small in Italy, with NPL sales of only
around €2–3 billion in 2012–13 (PwC). 32 In Italy, sales accounted for only 1 percent of bad
debts in 2013 and were concentrated mainly on highly provisioned loans, whose values had
already been fully discounted without risk of further loss. According to market participants,
these sales involved loans that defaulted more than 10 years ago (before the global financial
crisis). Reflecting the paucity of domestic players, buyers of Italian NPLs are mostly Anglo-
Saxon hedge funds and private equity funds, while the main sellers have been large Italian
and foreign-owned banks (Figure 13).
Figure 13. Who Buys and Sells Italian NPLs?
Who is selling Italian NPLs? Who is buying Italian NPLs?
Small banks
Not disclosed
Large
US funds
Italian
banks
UK funds
Foreign
owned
Italian
banks
Source: PwC (2013).
31
For example, for Italian banks’ bad debt, which is already in a state of insolvency and fully provisioned, writing off or
converting bad debt to equity (even partially) could reduce the indebtedness of the Italian corporate sector by as much as
€106 billion (8 percent of GDP), improving the capital position of corporates with little further losses for the banks.
However, it would also lower the provisioning ratio from 42 to 15 percent.
32
For the first half of 2014, PwC reported €2.5 bn (public transactions).18
A market for securitizing NPLs also exists, and in past recessions (1996–2000), was used
extensively by Italian banks to dispose of NPLs. For example, in 2000, 50 percent of asset-
backed securities (ABS) issued by Italian banks in 2000 was for NPL disposal the figure fell
to 20 percent over 2001–05. 33 However, with the collapse in securitization after the financial
crisis, Italian NPL-ABS issuances have also dried up, with ABS issuance now concentrated
on the highest quality securities for the purposes of collateralized ECB borrowing.
In Italy, initiatives to set up private AMCs and restructuring vehicles are slowly
emerging. Since December 2013, UCG closed two deals for about €2 billion and has been
negotiating a partnership with ISP to set up a special purpose vehicle (SPV) with outside
investors (see Box 5), and a sale of its servicer disposal platform for about €2.5 billion.34 In
June 2014, MPS sold €0.5 billion of NPLs to Fortress. In May 2014, Banca Popolare, the
fifth largest Italian bank, also announced its intention to sell a large portfolio of NPLs and
properties ("Release") for a net book value of €3.2 billion.35 In contrast, NPL activity by
smaller banks has been very limited.
Box 5. UniCredit and Intesa Partnership Initiative with Kohlberg Kravis Roberts and
Alvarez & Marsal
In April 2014, UCG, ISP, KKR, and A&M signed a memorandum of understanding to jointly develop and
implement a vehicle that optimizes the performance of a selected corporate loan portfolio under restructuring
through proactive management and additional funding. This new vehicle is expected to kick off in 2015.
No risk deconsolidation. ISP and UCG will retain a material interest and will not deconsolidate their shares in
the vehicle.
Limited amounts but open structure. The vehicle will target the corporate loans that the two banks have in
common and for which they are the primary banks (for instance, granting more than 50 percent of the loans). The
objective is to obtain control of these corporates through debt equity swaps and new equity in order to restructure
them. The vehicle will start with a limited number of loans (estimates of €2 billion, about 1.5 percent of gross
NPLs of both banks). In the future, the vehicle could be opened to other banks that have common exposures.
Profit sharing. The original banking claims will be ranked junior to the new financing provided by the KKR.
There will be a profit sharing agreement, with KKR earning a fixed annual return as well as a percentage of the
upside gains.
The distressed debt market in Europe is small but has also shown signs of picking up.
Compared to the United States where a market for NPLs has existed since the late 1980s and
amounts to around $400–450 billion in transaction per year, the market in Europe is still in
the early stages. NPL sales in Europe are estimated to have risen from €11 billion in 2010 to
33
The domestic accounting standards in force at that time alleviated the transfer cost, as it allowed banks to deconsolidate at
net book values, while recognizing the market losses over five years. Such schemes would not be compliant with IFRS and
thus could not be undertaken today. From 2001 to 2005, nearly €26 billion of bad loans were securitized.
34
Due to difficulties in reaching a price agreement, press reports a smaller sale than initially anticipated in May 2014 (from
€3-4 billion to €2.5 billion).
35
Press reports delays due to difficulties in reaching a price agreement.19
Figure 14. Distressed Debt Markets in Europe
(Face value, euro billions)
over €64 billion in 2013.36 Most of the activity has 70
taken place in Germany, Ireland, Spain, and the Netherlands
60
United Kingdom and focused mainly on Belgium
50
commercial real estate and consumer loans. The Italy
Italy
main factors behind its recent growth include: 40 Germany
Germany
Other Other
increased sales of defaulted loans, tougher 30 Portugal
France
Spain
Spain
Ireland
regulation, especially under the ECB’s 20
Other
Ireland Spain
comprehensive assessment, ample liquidity, Ireland UK
10
improving sovereign risk, and growing interest UK UK
0
from overseas investors seeking higher yields 2011 2012 2013
(Figure 14). Source: PwC.
C. Strategy for Fostering a Market for Nonperforming Loans
A strategy for developing a market for NPLs in Italy should look to remove
impediments to restructuring and enhance the incentive for banks to sell. Here, the
priorities would be to: (i) tighten supervisory policies on provisioning and write-offs to speed
up NPL resolution and restructuring; (ii) remove tax and regulatory impediments to debt
restructuring; and (iii) improve further the insolvency framework and encourage more out-of-
court workouts. Finally, facilitating the creation of NPL AMCs and corporate restructuring
vehicles would give banks more instruments to restructure, while expanding financing for
distressed firms.
1. Supervisory policies to speed up NPL resolution and debt restructuring
Stricter supervisory guidelines on loan provisioning would accelerate write-offs. As
recommended by the 2013 Italy FSAP, supervisory guidelines on provisioning would
promote harmonization of provisioning practices.37 For example, several European countries,
such as Ireland, have overlaid their accounting standards with guidelines on provisioning.
Where legally feasible, other countries have introduced a stricter approach. For instance in
Malta, banks are required to build up additional capital for NPLs equal to 2½ percent of
banks’ NPLs less IFRS impairments and accrued interest. In 2012, Bank of Spain (which is
also the accounting setter) required restructured loans to be provisioned by 15 to 25 percent.
As tried in other countries, supervisors could also tighten supervisory requirements to
speed up write-offs. Measures such as imposing higher capital charge or a time-limit on
NPL write-offs38 (Box 6), as currently done in the United States on mortgages, could put
36
See Ernst & Young, “European Non-Performing Loan Report 2011” and “Flocking to Europe: Ernst & Young 2013 Non-
Performing Loan Report.”
37
For a broader discussion, see the WP/14/170 (referenced in footnote 20).
38
A time-limit for NPL write off should be combined with a parallel strategy for addressing the length of judicial
proceedings in order not to penalize banks. As a first step, such a time limit could be set at the average lengths for
foreclosure or bankruptcy and be further reduced over time. The objective could be to remove from bank balance sheets very
old NPLs, older than 5 years.20
further pressure on banks to dispose of bad loans.39 Japan in 2001–05 also imposed a time
limit on NPLs to oblige banks to clean their balance sheets following the financial crisis.
Spain also required in 2012 a full write-off of unsecured NPLs classified as “doubtful” after a
set period of provisioning. Ending the practice of accruing interest on NPLs for prudential
purposes would also remove an important disincentive for banks to write off bad loans.40
Box 6. International Practices for the Write-off of Nonperforming Loans
In the United States, regulators have overlaid the accounting standard with detailed regulatory guidance
that harmonizes the treatment of write-offs. The regulators acknowledge that management will have discretion
in judging write-offs under U.S. generally accepted accounting principles. But to guide management, regulators
have added detailed regulatory guidance that harmonizes the treatment of write-offs. Compliance with the
guidance, in turn, is validated through onsite inspections.
U.S. regulatory guidance has introduced time-limits on writing off NPLs that are independent from the
time needed to foreclose. For example, after 180 days past due, a mortgage loan is valued exclusively based on
the underlying collateral (at market price with no adjustment for possible increase in value over time). Any loan
balance that exceeds the value of the collateral, less the cost to sell, should be written off. This requirement is
regardless of how long it takes to foreclose.
Guidance on write-offs has also been introduced in other countries to help clean bank books from legacy
assets. For instance, in Japan, the emergency economic measures of 2001 further accelerated the disposal of
distressed collateral.1 A guideline required major banks to remove near-bankruptcy and lower quality loans (“bad
debt”) within three years after their recognition. This helped remove a book value of old loans worth 270 billion
USD from bank balance sheets from 2001 to 2004. In Brazil, distressed loans (so called “H” loans) must be
written off after six months. They continue to be accounted for off-balance sheet, provisioned at 100 percent.
Smaller Latin American countries, like Guatemala, also apply rules on write-offs for consumer loans.
Sources: “The U.S. mortgage crisis: Are There Lessons for policymakers?” Michael Fratantoni and Michael Moore, February
2013; FDIC Risk Management Manual; IMF WP/04/86, Basel Core Principles for Effective Banking Supervision—Detailed
Assessment of Compliance for Brazil and Japan, 2012.
1
This temporary measure was withdrawn in 2005 after the stock of NPLs had declined substantially and the banking system
was officially regarded as “normalized.” Instead, a new guidance was issued to continue to encourage early identification and
disposal of bad debt.
To help address the corporate debt overhang, supervisory policies should facilitate the
liquidation of nonviable firms. Delays in placing nonviable firms in insolvency remain an
issue in Italy and many other European countries. Bad debt (in a state of insolvency) in Italy
accounts for more than half of NPLs and is concentrated mainly among medium and large
firms (Figure 15). As initiated in the ECB AQR, by using stricter impairment triggers and
discounted cash flow analysis, supervisors could encourage banks to distinguish more
aggressively between viable borrowers (who will continue to generate cash flows to cover
interest payments) and nonviable ones that need to be exited. For nonviable borrowers, as
39
As recommended by the IMF WP/14/170, in order to avoid giving up their contractual rights on future recovery proceeds
(e.g., collateral), banks need to ensure they have safeguards over loan documents and collection ledgers for loans that are
written off but still have legal rights and potential for recovery (as is the case in the United States).
40
While constraining banks behavior for accounting purposes could raise legal issues due to IAS 39, encouraging banks to
disclose their results under both accrual (IFRS) and non-accrual (prudential rules) practices would help users better identify
cash versus noncash earnings. This assumes that banks continue to keep the prudential provisioning systems after adopting
IFRS (see Section IV.A).You can also read