Matters arising from our audits of the 2018-28 long-term plans
←
→
Page content transcription
If your browser does not render page correctly, please read the page content below

B.29[19a]

Matters arising
from our audits
of the 2018-28
long-term plans
PhotoPhoto
      acknowledgement:
           acknowledgement:
©iStock
     ©iStock
        LazingBee
             LazingBee
B.29[19a] Matters arising from our audits of the 2018-28 long-term plans Presented to the House of Representatives under section 20 of the Public Audit Act 2001. February 2019 ISBN 978-0-9951185-0-8
Contents

    Auditor-General’s overview                                                             4
    Recommendations                                                                       7
    Part 1 – How long-term plans have evolved                                              8
    Part 2 – Activities and outcomes                                                      10
     The Act’s performance framework requirements                                         10
     Did councils’ performance frameworks have a logical flow?                            11
     What community outcomes were disclosed in the 2018-28 long-term plans?               12
     Consideration should be given to the size of performance frameworks                  13
     Opportunity for improving performance frameworks                                     14

    Part 3 – Financial trends and insights                                                15
     How we completed our financial analysis                                              16
     Councils are forecasting higher spending                                             16
     Forecast growth is not evenly spread                                                 16
     Councils face risks to their large forecast capital expenditure programme            19
     Councils need to better manage and reinvest in their existing assets                 20
     Priorities for councils when managing their assets                                   22
     Councils’ funding sources are continuing to increase                                 23

    Part 4 – Financial strategies                                                         27
     Legislative requirements for financial strategies                                    27
     Are financial strategies meeting the legislative intentions?                         28
     Disclosures required in the financial strategy                                       29

    Part 5 – Infrastructure strategies                                                    32
     Legislative requirements for infrastructure strategies                               32
     A summary of our observations in 2015                                                33
     Infrastructure strategies are important                                              34
     Asset condition and performance information                                          34
     Financial sustainability and affordability                                           36
     The scope of infrastructure strategies                                               37
     How did infrastructure strategies approach levels of service?                        38
     Early clarity helps                                                                  38

    Part 6 – How have councils considered resilience?                                     39
     National and international context                                                   39
     How have councils described the risks to their assets from natural hazards?          41
     Approaches identified to provide for the resilience of infrastructure                43
     Preparing for the 2021-31 long-term plans                                            45

    Part 7 – What did councils tell us about their long-term plan process?                46
     Palmerston North City Council                                                        46
     Gisborne District Council                                                            47
     Main observations                                                                    48
     What happens when the process goes wrong?                                            49

2
Contents
Part 8 – The audit reports we issued 51
Uncertainty about central government funding 51
Uncertainty about forecast expenditure 52
Decisions to increase the uniform annual general charge and amend the revenue and financing policy
without proper consultation 52
Late adoption of long-term plans 53
Appendices
1 – The introduction of long-term plans and changes to their content 55
2 – Sub-sectors and the high-growth councils 61
3 – Auckland Council’s forecast financial results 63
4 – Metropolitan councils’ forecast financial results 68
5 – Provincial councils’ forecast financial results 73
6 – Regional councils’ forecast financial results 78
7 – Rural councils’ forecast financial results 83
8 – Non-standard audit reports 88
Figures
1 – The Local Government Act’s performance framework requirements 11
2 – Words councils used most in their community outcomes 13
3 – 2018-28 forecast financial information compared with 2015-25 forecast financial information for
all councils 17
4 – Comparison between 2018-28 forecast financial information and 2015-25 forecast financial
information for high-growth and low-growth councils 17
5 – Forecast debt as a percentage of total revenue for high-growth councils 18
6 – Forecast capital expenditure in the 2018-28 long-term plans compared with the 2015-25
long-term plans 19
7 – Forecast renewal capital expenditure compared with forecast depreciation for all councils 21
8 – Rates revenue for councils as a whole, as forecast in the 2015-25 and 2018-28 long-term plans 24
9 – Debt forecast in the 2015-25 and 2018-28 long-term plans 25
10 – Interest expense and interest expense as a percentage of borrowing, as forecast in the 2015-25 and
2018-28 long-term plans 26
11 – What councils expect to spend on selected assets, for years 11 to 30 of the infrastructure strategies 36
3Auditor-General’s overview
Councils provide a range of important services to all New Zealanders, including
the roads we travel on, the water we drink, and the locally owned community
facilities, such as libraries, that we use. Councils need to plan well, often many
years in advance, to ensure that they deliver these services for the long term, to a
standard their communities want and can afford.
Every three years, councils are required to prepare a 10-year long-term plan (LTP).
The LTP is the main way for councils to describe the services they plan to provide,
the community outcomes they plan to contribute to, and the forecast cost of
those services.
My auditors are required to express an opinion about whether each council’s LTP is
fit for purpose. Only one council received a modified audit opinion on its 2018-28
LTP. This was because it did not have reliable information to support some of its
financial forecasts.
Councils have a hard job, and I acknowledge the effort those working in the local
government sector make. Preparing an LTP is a significant task – the preparation
takes time and costs money. However, I consider the LTP to be a fundamental tool
for communities to hold their council to account.
The benefits of planning for a longer term, being transparent, and engaging with
the community about the goals being pursued and their expected time frames
and trade-offs cannot be underestimated. There is much about this process that
other public organisations could learn from.
Challenges councils face
Councils are facing many significant and often conflicting pressures. Difficult
decisions will need to be made as a result. Some councils are responding to
unprecedented levels of growth. All councils are responding to increasing
requirements for levels of service, including as a result of regulatory changes. They
also need to reinvest in their existing infrastructure, often at higher levels than
in the past to address historical underinvestment and improve services to meet
community expectations.
This comes at a cost. The 2018-28 LTPs show significant forecast capital
expenditure compared with previous LTPs. The increase in capital expenditure is
not isolated to the 10-year period of the LTP. The 30-year infrastructure strategies
reflect that this trend is expected to continue beyond the 10-year period.
Councils have a difficult job balancing the services they provide to communities
with the long-term cost of those services, so providing affordable and sustainable
services to their communities remains a challenge for councils. Council rates are
4Auditor-General’s overview
forecast to continue to increase, and, for many communities, these increases are
likely to be proportionately more than the increase in their other household costs
or income.
Consistent with the principle of intergenerational equity, many councils use debt
to fund much of their new capital expenditure. As a result, the 2018-28 LTPs
reflect a sharp increase in expected debt for councils overall. Some “high-growth”
councils (that is, councils experiencing high population growth) are starting to
come up against the debt limits that they have set, in the context of prudent
financial management.
Faced with this, councils are increasingly starting to consider using more innovative
funding tools. For example, some are setting up “special purpose vehicles” to
provide councils with alternative funding mechanisms. We will watch these
developments and ensure that they are appropriately accounted for and disclosed.
The Productivity Commission is currently inquiring into the adequacy and
efficiency of the existing funding and financing options for councils and whether
these are sustainable. We expect that the inquiry will consider the trends and
concerns that we discuss in this report.
To support better planning, councils need to do more to gain better information
about the condition of their assets, the likelihood of a natural hazard event
occurring, and the potential effects of climate change. I urge local and central
government to work together to provide leadership on this.
Communities are already feeling the effects of climate change. Addressing these
effects could compound the pressure of increasing capital expenditure forecasts.
In many respects, councils do not know the extent of the challenges they face in
responding to climate change and are forecasting expenditure without a good
understanding of the risks.
The suitability of long-term plans
Since LTPs were introduced in 2002, there have been numerous changes to
legislation. Some of the changes focused on increasing the ability of communities
to engage in the planning process, and some were to provide more information.
LTPs, and the strategies they contain, remain long and complex. It is timely for the
Department of Internal Affairs and the local government sector to discuss and
review the required content for LTPs to ensure that they remain fit for purpose as
planning and accountability documents.
5Auditor-General’s overview
Financial and infrastructure strategies are critical components of a council’s LTP.
These strategies must be clear about the current state of the council’s finances
and infrastructure, its goals, and the trade-offs that are needed. This is so readers
of the LTP can meaningfully assess the prudence of their council’s financial
management and its long-term stewardship of infrastructure.
Councils should present their strategies concisely. In this report, I have set the
challenge for councils to prepare a financial strategy in up to five pages. This is by
no means easy but would hopefully aid a broader understanding of the council’s
strategy.
I also consider that there is an opportunity for further discussion about the
effectiveness of councils’ performance reporting to ensure that it remains fit
for purpose. As part of our future work, we plan to take a more active role in
influencing improvement in performance reporting throughout the public sector.
In my view, changes to the content of LTPs could make them more effective. I have
heard from councils how resource-intensive it is to prepare an LTP. Improvements
in requirements for LTPs could help decrease the burden on councils without
compromising the primary purpose of LTPs.
Concluding comments
This report identifies that there is a lot for councils to grapple with. Further, with
changes in technology, communities have different expectations for how they will
interact with, and receive services from, their council. Future service delivery will
look different. Councils can no longer plan based on the status quo – they need to
actively consider what their future service delivery models will be.
Central and local government need to work together to ensure that the issues
faced by our cities, districts, and regions are addressed in the best way for the
benefit of all New Zealanders. LTPs provide a richness of information and planning
that should be used by local and central government to form wider consideration
of the important issues, and solutions to address these.
I have made four recommendations to central and local government to support
the changes that, in my view, are needed.
John Ryan
Controller and Auditor-General
8 February 2019
6Recommendations
We recommend:
1. that councils prioritise collecting condition and performance information
of critical assets and, in the meantime, take a precautionary approach for
significant services where the condition information of critical assets
is unknown;
2. that the Department of Internal Affairs and the local government sector review
the required content for long-term plans to ensure that they remain fit for
purpose, particularly:
–– the current suite of mandatory performance measures;
–– the disclosure requirements for financial and infrastructure strategies;
–– disclosures required under the Local Government (Financial Reporting and
Prudence) Regulations 2014; and
–– how assumptions are disclosed in long-term plans;
3. that the Productivity Commission, in its review into the adequacy and
efficiency of the existing funding and financing options for councils, consider
the trends arising in the 2018-28 long-term plans, particularly the trends and
concerns we have raised about increasing debt; and
4. that central government and local government continue to consider how
increased leadership can be provided for climate change matters, particularly:
–– what data is needed and who collects this;
–– the quality of this data; and
–– how councils should consider this in future accountability documents,
including the long-term plan.
71 How long-term plans
have evolved
1.1 The 2018-28 long-term plans (LTPs) are the fifth set that we have audited. In this
report, we discuss how councils met the main content requirements in their
2018-28 LTPs and the audit reports we issued. We also describe what we heard
from two councils about their approaches to preparing an LTP.
1.2 The requirement for councils to prepare LTPs, and for the Auditor-General to audit
them, was put into the Local Government Act 2002 (the Act) as part of significant
local government law reform to replace the previous Local Government Act 1974.
1.3 LTPs are an important mechanism to strengthen long-term planning, community
consultation and participation, and accountability in local government.
1.4 Numerous changes have been made to the Act since 2002. These have included
changes to the purpose of local government; the process, purpose, and content of
LTPs; and our audit role. We outline the changes in more detail in Appendix 1.
1.5 The most substantive changes affecting LTPs were a result of Government reviews
between 2010 and 2014.
1.6 The main changes affecting the content of LTPs have been for the documents to
contain the council’s:
• financial strategy (since the 2012-22 LTPs); and
• infrastructure strategy (since the 2015-25 LTPs).
1.7 We continue to express our support for these two strategies.
1.8 Other changes affecting the content of LTPs include:
• financial prudence:
–– additional disclosures in the forecast financial statements, financial
prudence benchmark disclosures, and funding impact statements, in the
form prescribed by regulations;1 and
• standardised activities and measures:
–– standard groups of activities for infrastructure services (water supply,
sewage treatment and disposal, stormwater drainage, road and footpaths,
and flood protection and control works); and
–– some prescribed non-financial performance measures for those groups of
activities, as specified in rules made by central government.2
1.9 These changes were intended to provide greater consistency between councils in
their planning and reporting, and to improve the ability to assess their financial
1 Local Government Act 2002, Part 1, Schedule 10, and the Local Government (Financial Reporting and Prudence)
Regulations 2014.
8 2 Local Government Act 2002, section 261B and clause 4 of Schedule 10.Part 1
How long-term plans have evolved
health and compare their performance. There were related changes to council
annual reporting and our audit requirements.3
1.10 Despite changes to make LTPs more strategic and streamlined, the documents
remain long and complex. There is a risk that they contain material that does not
help them achieve their purpose.
1.11 In our view, it would be timely for the Department of Internal Affairs and the local
government sector to discuss and review the content required for LTPs to ensure
that they remain fit for purpose.
1.12 Particularly, we recommend that any review consider whether all the content
required for LTPs is actually needed, such as some of the mandatory disclosures in
the financial strategies and the duplication in the Act in the area of assumptions.
3 Local Government Act 2002, section 259C. 92 Activities and outcomes
2.1 The Act gives councils a framework and powers to decide what activities to
carry out and how they will carry them out. The Act also states that councils are
accountable to their communities.4 The performance information included in the
LTP is an important part of how councils demonstrate that accountability.
2.2 Councils are required to present information on community outcomes, groups
of activities, and a statement of service provision (including performance
measures and targets) and clearly and logically link them together. We refer to this
information collectively as the “performance framework”, although the Act does
not use this term.
2.3 In this Part, we discuss:
• the Act’s performance framework requirements;
• whether councils’ performance frameworks had a logical flow;
• what community outcomes were included in councils’ performance
frameworks in the LTPs;
• the size of councils’ performance frameworks; and
• the opportunity to improve performance frameworks to ensure that they will
continue to be an effective basis for accountability.
2.4 In this Part, we do not comment on all aspects of councils’ performance
frameworks as disclosed in their LTP.
2.5 We consider that there is an opportunity for further discussion about the
effectiveness of councils’ performance reporting to ensure that it remains fit for
purpose. As part of our work, we plan to take a more active role in influencing
improvements in performance reporting throughout the public sector.
The Act’s performance framework requirements
2.6 The Act requires an LTP to be explicit about the link between the community
outcomes the council wants, the rationale for its delivery of groups of activities,
and its performance measures and targets. The Act sets out performance
framework requirements (see Figure 1).5
2.7 Community outcomes are the aspirations the council has for its community.6
4 Local Government Act 2002, section 3.
5 Local Government Act 2002, Schedule 10, clause 2.
6 Community outcomes are the outcomes that the council aims to achieve in meeting the current and future
needs of communities for good-quality local infrastructure, local public services, and performance of regulatory
10 functions (Local Government Act 2002, section 5).Part 2
Activities and outcomes
Figure 1
The Local Government Act’s performance framework requirements
Community outcomes: the outcomes the council wants to achieve.
Groups of activities: activities in each group of activities are clearly identified.
Rationale for activities: how the groups of activities contribute to well-being/outcomes and
to the council’s strategic objectives and duties.
Significant negative effects: any significant negative effects that an activity might have on
the community.
Service levels: including intended levels of service delivery; any intended changes to the level
of service provided in the year before the first year covered by the plan and the reasons for
the changes; and the reason for any material change in the cost of a service.
Performance measures (for service delivery): the specific criteria or means used to objectively
measure performance (in detail for years 1-3, in outline for years 4-10). They include the
mandatory performance measures specified under a rule made under section 261B.
Targets: the level of performance sought (supported by quality information) on forecast
expenditure, assets, resources (capability, capacity), and robust assumptions.
2.8 The Act also requires several disclosures that must be made in an LTP for each
group of activities a council selects, including:
• any performance measures specified by the Secretary for Local Government;
• the performance measures that the council considers will enable the
community to assess the level of service for major aspects of groups of
activities for which performance measures have not been specified;
• the performance target or targets set by the council for each performance
measure;
• any intended changes to the level of service that was provided for in the year
before the first year covered by the plan and the reasons for the changes; and
• the reason for any material change to the cost of a service.7
2.9 It is important that the council selects the forecast performance measures and
targets well to provide a meaningful picture of its activities and levels of service.
This includes considering aspects of service and performance that are of greatest
importance to the community and reflect the financial significance of the activity.
2.10 The measures disclosed in the LTP are a critical part of the performance
framework, because monitoring and reporting against these measures (in the
annual report) allows councils to demonstrate their performance.
Did councils’ performance frameworks have a logical flow?
2.11 Most councils’ performance frameworks in their LTPs had clear links between each
of the components described in Figure 1.
7 Local Government Act 2002, Schedule 10, clause 4. 11Part 2
Activities and outcomes
2.12 Some councils presented the logical flow of the parts of their performance
framework on one page. The information presented often included links between
the LTP and the council’s other strategic documents. We considered that these
types of disclosures usefully helped readers’ understanding of how the council
was going to demonstrate accountability.
2.13 However, in many instances, the community outcomes being sought were so
broad (see paragraphs 2.17 to 2.22) that they linked to most of the groups of
activities the council delivers.
2.14 It is unlikely that all activities will support community outcomes to the same
extent. Therefore, we considered that it was helpful when councils provided an
indication in each of their activity statements of the primary community outcome
that the activity was seeking to support. For example, Napier City Council took
this approach and also noted secondary contributions.
2.15 Central Otago District Council and Waimakariri District Council, in disclosing their
performance measures and targets for each activity, made a clear link back to the
relevant community outcomes. In contrast, most councils simply described, at a
high level, which community outcome the group of activities related to.
What community outcomes were disclosed in the 2018-28
long-term plans?
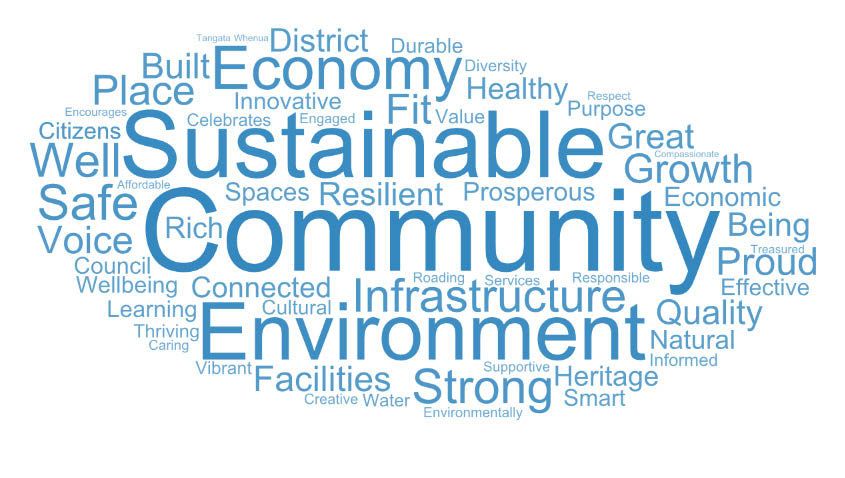
2.16 On average, councils had five community outcomes in their 2018-28 LTPs. Figure 2
shows the words councils used most in their community outcomes.
2.17 The outcomes set by councils were generally broad aspirations. For example, half
of the regional councils had a community outcome including the phrase “healthy
environment”.
2.18 Because community outcomes are so broad, there is a risk that members of the
community will not understand what actions the council is taking to contribute
to the community outcome and how the council will measure and demonstrate
whether it has achieved that outcome.
2.19 A small number of councils included specific outcome measures and indicators
that they will use to demonstrate achievement of, or progress towards, the
outcomes they seek. For example, Hawke’s Bay Regional Council disclosed
23 specific outcome measures in its LTP.
2.20 Some councils provided additional content, such as goals or descriptions of
how they plan to achieve the community outcomes. For example, Buller District
Council provided information under each community outcome on its related
objectives (“What does Council want to achieve?”), how it will contribute to
achieving those objectives, and relevant programmes and projects.
12Part 2
Activities and outcomes
Figure 2
Words councils used most in their community outcomes
Councils described their community outcomes using a wide variety of words,
most commonly: community, sustainable, environment, economy, and strong.
2.21 A third of councils explicitly said in their LTPs that they had refreshed their
community outcomes as part of preparing their 2018-28 LTPs. Most councils
signalled that they did this to better align their outcomes with their vision and
goals. It is important that community outcomes align with the strategic direction
that the council wants.
2.22 Most councils plan to demonstrate performance towards community outcomes
by reporting against their performance measures for service delivery (at an
activity level) in the annual report. Because performance measures tend to have a
short-term focus, it will be important that councils collect trend information over
multiple years to provide an indication of how they are making progress towards
their long-term outcomes.
Consideration should be given to the size of performance
frameworks
2.23 On average, councils had 11 activity statements. Each activity statement generally
had numerous performance measures.
2.24 The performance framework in councils’ LTPs should provide enough information
about what is important to the council and the community. However, it is
important that readers are not burdened with too much detail and that the cost for
councils preparing the information for reporting in the annual report is not onerous.
13Part 2
Activities and outcomes
2.25 Reporting against each of these performance measures is a significant task for
a council and is likely to be long and detailed in the council’s annual report. Few
members of the community will have the desire or the ability to read and assess
this amount of information.
2.26 There could be an opportunity for councils to further aggregate their groups
of activities to reduce the amount of repetitive information and performance
reporting for similar activities.
2.27 There might also be an opportunity to consider and reduce the number of
performance measures that a council has. For example, Christchurch City Council
removed about 235 measures from its previous performance framework.
2.28 We have previously reported concerns that some of the mandatory performance
measures do not provide a meaningful indication of a council’s performance. In
our view, it is timely for the Department of Internal Affairs to consider whether
the current suite of mandatory performance measures is fit for purpose.
Opportunity for improving performance frameworks
2.29 There were only a few instances where, having completed the audit of the 2018-28
LTPs, auditors made recommendations to councils to improve their performance
frameworks. The recommendations were for improvements for the council to
consider as opposed to significant concerns about the performance framework.
2.30 This reflects that councils are generally providing a logical and reasonable
performance framework. That is not to suggest performance frameworks could
not be improved.
2.31 We would like to see performance frameworks that provide greater clarity about
the main matters a council is working on. The Parliamentary Commissioner for
the Environment had a similar view about presenting clear information. In a 2016
report discussing the state of the environment monitoring, it was noted that:
The answer is to have a purpose that is crystal clear. Any information that does
not serve that purpose can be excluded.8
2.32 Parliament is currently considering whether it should reintroduce the four
well-beings into the Act.9 This would provide for councils to play a broad role in
promoting the social, economic, environmental well-being of their communities,
taking a sustainable development approach. This could be an opportunity for the
local government sector to think more deliberately about what it reports and how
it will report it.
8 Parliamentary Commissioner for the Environment (2015), The state of New Zealand’s environment:
Commentary by the Parliamentary Commissioner for the Environment on “Environment Aotearoa 2015”, page 6.
9 Amendments to the Act changed councils’ focus on the well-being of the community to a more restricted
14 focus on core services and cost-effectiveness.Financial trends and insights 3
3.1 In this Part, we discuss the forecast financial information10 in the 2018-28 LTPs.11
We wanted to understand the trends in the forecast financial information.
3.2 The main trend we identified is significant forecast capital expenditure in the
2018-28 LTPs. Most of the councils’ planned capital expenditure is to renew their
assets. However, this amount remains less than forecast depreciation, indicating
that councils as a whole might not be adequately reinvesting in their assets.
3.3 Most councils have assessed that they are in this position and have plans to
manage their “renewals gap”. Councils need to actively review these plans so that
they will be able to adequately reinvest in their assets.
3.4 A large portion of forecast capital expenditure is on new infrastructure and to
increase levels of service. Councils have to respond to growth and changes in
levels of service, including regulatory changes. It is also important that they
continue to renew and invest in their current infrastructure or risk that crucial
infrastructure assets could start to fail.
3.5 Meeting proposed levels of service comes at a cost. Although councils have expressed
a desire to keep rates at affordable levels, rates revenue is expected to increase by
more than 50% in the next 10 years to fund proposed services. This increase is largely
consistent with rates increases that were forecast in the 2015-25 LTPs.
3.6 There is also a sharp increase in expected debt to fund the anticipated growth. Some
councils expecting high growth are starting to come up against debt covenants.
Councils nearing such limits run the risk that they will not be able to respond to
unexpected events because, if they occur, funding sources could be limited.
3.7 Councils’ forecast interest expenditure is comparatively lower than the 2015-25
LTPs despite increased debt signalling lower interest rates. We are concerned
by this trend. If interest rates increase more than anticipated, this could limit
some councils’ ability to service their debt and carry out their capital expenditure
programmes without making other changes, such as increasing rates or reducing
expenditure.
3.8 The Productivity Commission is currently inquiring into the adequacy and
efficiency of the existing funding and financing options for councils and whether
10 Auckland Council prepared an LTP that covers the Council and its group of council-controlled organisations. Other
councils prepared an LTP that included council-only financial forecasts. We included Auckland Council’s group
financial forecasts in our analysis.
11 Our financial analysis excludes Kaikōura District Council. An Order-in-Council in March 2018 allowed the Council
to prepare a customised three-year plan in place of the standard 10-year LTP. There was no audit requirement
for the three-year plan. The Government agreed to this approach because the Council faced exceptional
circumstances after the Hurunui/Kaikōura earthquake. A similar approach was taken to support Christchurch
City Council after the Canterbury earthquakes.
Our financial analysis also excludes Wairoa District Council and West Coast Regional Council, because their LTPs
were not available when this report was written. 15Part 3
Financial trends and insights
these are sustainable. We recommend that this review consider the trends and
concerns we have raised.
How we completed our financial analysis
3.9 In our analysis, we considered the sector as a whole and as five sub-sectors. The
sub-sectors we considered were:
• metropolitan councils;
• Auckland Council (considered separately from other metropolitan councils
because of its size);
• provincial councils;
• regional councils; and
• rural councils.
3.10 We also considered the effect of population growth on councils and categorised
councils as either “high-growth” or “low-growth”.12
3.11 See Appendix 2 for more information on the sub-sectors and high-growth councils,
and Appendices 3 to 7 for the forecast financial picture of the five sub-sectors.
Councils are forecasting higher spending
3.12 Compared with the financial forecasts for 2015-25, councils are forecasting to spend
more to address greater demand on council services, improve levels of service, and
carry out their normal operations.13 To fund this additional spending, councils are
forecasting to increase revenue streams, such as rates, and to borrow more.
3.13 This trend is not new. However, the scale of change from the 2015-25 LTPs to the
2018-28 LTPs is new, especially the increase in forecast capital expenditure.
3.14 Figure 3 summarises the increases in councils’ revenue, operating expenditure,
and capital expenditure forecasts by comparing the 2018-28 LTPs’ forecasts with
the 2015-25 LTPs’ forecasts. These movements are not uniform throughout all
councils (see Appendices 3 to 7).
Forecast growth is not evenly spread
3.15 Some councils are having to plan for and manage large increases in the number of
people who will live and work in their cities, districts, or regions. We have described
the councils experiencing the largest population increase as “high-growth”.
12 We have used the National Policy Statement on Urban Development Capacity 2016 to define high-growth
councils. All other councils we have defined as low-growth.
13 In comparing to the 2015-25 LTP forecasts, we have not adjusted these forecasts for any LTP amendments
16 adopted by councils.Part 3
Financial trends and insights
Figure 3
2018-28 forecast financial information compared with 2015-25 forecast financial
information for all councils
2015-25 LTP 2018-28 LTP
% increase14
$billion $billion
Operating revenue 122.7 149.5 22
Operating
110.8 130.1 17
expenditure
Capital expenditure 41.5 54.5 31
3.16 High-growth councils forecast larger increases compared with the 2015-25 LTPs
than their low-growth counterparts (see Figure 4).
Figure 4
Comparison between 2018-28 forecast financial information and 2015-25
forecast financial information for high-growth and low-growth councils
High-growth councils Low-growth councils
2015-25 2018-28 2015-25 2018-28
% %
LTP LTP LTP LTP
increase14 increase14
$billion $billion $billion $billion
Operating
70.6 88.6 25 52.1 60.9 17
revenue
Operating
61.3 73.0 19 49.5 57.1 15
expenditure
Capital
28.0 36.9 32 13.6 17.6 30
expenditure
3.17 Some high-growth councils forecast large increases. For example, Queenstown-
Lakes District Council and Tauranga City Council both forecast more than a 50%
increase in operating revenue and operating expenditure compared with 2015-
25. Both councils have more than doubled their forecast capital expenditure
programme in their 2018-28 LTPs.
3.18 The forecast capital expenditure increases for the high-growth and low-growth
councils shown in Figure 4 are similar. However, the high-growth councils have
forecast 29% of their planned capital expenditure to allow for meeting increased
demand. Low-growth councils expect some growth but, at 9% of their planned
capital expenditure, it is far less. “Growth” capital expenditure is primarily funded
by borrowing. Councils also have other funding sources for growth capital
expenditure, such as subsidies from the New Zealand Transport Agency and by
levying contributions from the developers wanting the capital expenditure.
14 The financial information compared in Figures 3 and 4, and in other parts of our report, was prepared at different
times. This means the percentage movements discussed include the effect of inflation on councils since the
2015-25 LTPs were prepared. 17Part 3
Financial trends and insights
3.19 We see two main risks that high-growth councils must manage.
3.20 The first risk is when to provide new assets to meet additional demand. If councils
build assets too early, the cost to service the debt used to fund the assets will fall
disproportionately on existing ratepayers. If they build assets too late, the services
they provide to the community will be affected.
3.21 The second risk is funding the growth. High-growth councils need to borrow
significantly to fund capital expenditure for new assets – the 2018-28 LTP
forecasts show a 49% increase in debt from 2018/19 to 2027/28 for these
councils. Figure 5 shows the forecast debt as a percentage of revenue for the
11 high-growth councils.15
Figure 5
Forecast debt as a percentage of total revenue for high-growth councils
The 2018-28 LTP forecasts show an increase in debt as a percentage of total revenue for
high-growth councils, peaking in 2022/23.
%
250
200
Forecast 150
debt as
percentage
of forecast 100
revenue
50
0
2019 2020 2021 2022 2023 2024 2025 2026 2027 2028
As at 30 June
3.22 Most high-growth councils have debt covenants that restrict their ability to
borrow more than 250% of their revenue. Based on forecast debt levels, most
high-growth councils generally do not have much borrowing capacity to respond
to other risks. Increasingly, councils’ ability to sustainably manage growth is
becoming more at risk.
opportunitygrant@marram.co.nz
15 By comparison, low-growth councils’ forecast borrowing as a percentage of revenue does not exceed 120% during
18 the period of the 2018-28 LTPs.Part 3
Financial trends and insights
Councils face risks to their large forecast capital
expenditure programme
3.23 As noted in Figure 3, councils have significantly increased the amount of planned
capital expenditure in the latest LTPs compared with the 2015-25 LTPs. Figure 6
breaks down the forecast capital expenditure into three categories:
• expenditure for new assets to meet additional demand;
• expenditure to improve levels of service; and
• expenditure to replace or renew existing assets.
Figure 6
Forecast capital expenditure in the 2018-28 long-term plans compared with the
2015-25 long-term plans
2015-25 LTP 2018-28 LTP
Capital expenditure % increase
$billion $billion
Meet additional demand 8.2 12.4 51
Improve the level of service 13.2 18.6 41
Renew existing assets 20.1 23.5 17
Total 41.5 54.5 31
3.24 Figure 6 shows that councils are progressively forecasting more capital expenditure
to meet additional demand and improve service levels. As noted above, capital
expenditure forecast to meet additional demand is concentrated in high-growth
councils. Some councils included forecast capital expenditure to respond to the
recommendations in the Report of the Havelock North drinking water inquiry:
Stage 2, and to meet the expectations included in national policy statements.
3.25 The overall forecast capital expenditure increase compared with the 2015-25 LTP
forecasts affects almost all councils. Appendices 3 to 7 show that all sub-sectors
are forecast to increase their capital expenditure significantly. Only seven councils
are forecasting a decrease in capital expenditure compared with their 2015-25 LTP
forecasts.
3.26 Generally speaking, low-growth councils are increasingly turning their attention
to renewing existing and ageing infrastructure. We consider this to be prudent
and consistent with councils’ stewardship responsibilities. On the other hand,
high-growth councils are more focused on providing capital expenditure to meet
anticipated demand. We discuss council renewals in paragraphs 3.34 to 3.44.
3.27 Achieving this forecast capital expenditure programme will be challenging.
The capital expenditure programme is larger than what councils have forecast
previously and also larger than what has been recently achieved.
19Part 3
Financial trends and insights
3.28 From 2013/14 to 2016/17, councils overall have managed to spend between 66%
and 78% of their planned capital expenditure budgets. Capital expenditure budgets
during this period ranged from $3.2 billion (in 2013/14) to $4.9 billion (in 2015/16).
3.29 We consider that councils will need to carefully plan, prioritise, and monitor their
budgets to have a realistic ability to achieve capital expenditure programme
budgets. Councils will also need to consider whether they have the staff capacity
and capability to manage their capital expenditure programme.
3.30 This is a matter of interest to us. Through our focus on public sector procurement
practices, we plan to examine councils’ capital procurement capacity and capability.16
3.31 In paragraphs 3.20 and 3.21, we noted that high-growth councils will need to
carefully manage the pressures of growth. This is even more relevant for councils
that have to manage growth in their cities, districts, or regions after a long period
of no growth. Among other factors, these councils should consider whether they
are applying the right funding tools (such as development contributions) to pay
for growth-related capital expenditure.
3.32 New Zealand is a small country, and there are several other planned or occurring
projects17 that will compete with councils for service from the construction
industry. This could affect when councils complete their planned capital work and
the cost of this work.
3.33 A new independent infrastructure body is being set up. We understand that this
entity is likely to have a role in considering project delivery throughout the public
and private sectors.
Councils need to better manage and reinvest in their
existing assets
3.34 We have previously reported our concerns that many councils are not adequately
reinvesting in their assets.18 To consider how councils are reinvesting in
their assets, we compared renewal and replacement capital expenditure to
depreciation. We consider depreciation to be the best available estimate of what
portion of the asset was used up during the financial year.
3.35 When examining LTPs, we can get a better sense of how councils plan to manage
their existing assets over time. A council that is spending less on renewing its
assets compared to the depreciation expense will, at some point in the future,
need to spend more to “catch-up” its asset reinvestment. The LTPs, and specifically
16 For more information, see Controller and Auditor-General (2018), Introducing our work about procurement,
Wellington.
17 For example, the Government’s KiwiBuild development scheme.
18 See, for example, Controller and Auditor-General (2018), Local government: Results of the 2016/17 audits,
20 Wellington, pages 10 and 11.Part 3
Financial trends and insights
the financial and infrastructure strategies, should explain what approaches
councils will take to manage reinvestment in existing infrastructure.
3.36 Figure 7 compares the forecast renewal capital expenditure to forecast
depreciation for all councils. Forecast renewals remain less than forecast
depreciation during the period of the LTP.
3.37 These are similar trends to those we have seen from analysing the 2012-22 and
2015-25 LTP figures.19 There are no significant differences when looking at
sub-sectors or at high-growth and low-growth councils.
Figure 7
Forecast renewal capital expenditure compared with forecast depreciation for all
councils
Forecast renewals remain less than forecast depreciation during the period of the LTP.
%
100
80
Forecast
60
renewals as
percentage
of forecast 40
depreciation
20
0
2019 2020 2021 2022 2023 2024 2025 2026 2027 2028
Year ended 30 June
3.38 For councils’ core assets, councils are forecasting renewals expenditure to be
significantly above 100% of depreciation only in flood protection and control
works. Other asset classes have the following averages:
• Roading – on average, forecast renewals are 83% of forecast depreciation.
• Water supply – on average, forecast renewals are 82% of forecast depreciation.
• Wastewater – on average, forecast renewals are 67% of forecast depreciation.
• Stormwater – on average, forecast renewals are 52% of forecast depreciation.
3.39 The trends shown by these forecasts reinforce our previous concerns that councils
as a whole might not be reinvesting adequately in their assets.
3.40 Roading is the only major asset class to differ from trends we have seen previously.
This is because metropolitan councils forecast to spend less on renewing roading
assets than in previous LTPs.
19 See Controller and Auditor-General (2015), Matters arising from the 2015-25 local authority long-term plans,
page 11. 21Part 3
Financial trends and insights
3.41 From the work our auditors did, 44 councils identified a gap between forecast
renewals and depreciation. Additionally, our auditors identified that not all councils
formally analysed whether they had a “renewals gap”. This is not good enough
given the criticality of the infrastructure in question. All councils need to formally
assess what stage in the life cycle their critical assets are at and plan accordingly.
3.42 Councils that have identified a renewals gap used one or more of the following
approaches to manage the upcoming renewals peak:
• Putting in place funding sources to pay for the future renewals. The most
common approach taken was levying rates to cover their depreciation expense
and placing any rates that were not spent on renewals in reserve.
• Progressively increasing renewal expenditure over a period of time. Some
councils are actively addressing a backlog of renewals on their major assets,
leading to these councils significantly increasing their forecast renewals
expenditure.
• Evening out the future renewals forecasts to “smooth” the expected peak.
• Increasing internal staff numbers to ensure that there are enough people to
manage a larger capital expenditure renewals programme.
• Focusing on renewing critical assets first, so the most important parts of the
council’s asset network continue to deliver services.
3.43 Councils with a renewals peak to manage also planned to improve their
knowledge of the condition and performance of their assets. This would give them
better information to more accurately forecast when they need to renew assets.
3.44 From reviewing councils’ financial and infrastructure strategies, we consider that
councils could have been clearer about the approaches discussed in paragraph
3.42. We discuss our concerns about how councils set out the implications of their
proposals in the financial and infrastructure strategies in Parts 4 and 5.
Priorities for councils when managing their assets
3.45 In general, councils are reporting in their infrastructure strategies a need to
improve their asset condition and performance information, especially for assets
used to supply three waters services (see also Part 5).
3.46 Councils are also using their incomplete knowledge of the condition and
performance of their major assets to model renewal forecasts. Because the
information they use is not as complete and robust as it should be, there is greater
uncertainty about when assets need to be replaced or when the councils’ renewal
peaks will be.
22Part 3
Financial trends and insights
3.47 We recommend that, to increase the reliability of future renewals forecasts and
the associated funding needs, councils continue to prioritise their understanding
of the condition and performance of their most important assets and use this
updated information for planning.
3.48 A common comment we hear from councils is that they expect their major assets
to last longer than the asset lives they assign to them. Councils use the asset
lives to estimate their depreciation expense, which they recognise for financial
reporting purposes and use in the LTP financial forecasts.
3.49 However, councils do not believe that they have enough knowledge about their
assets to increase the asset life. As councils continue to improve the condition
and performance of assets, they should prioritise work on confirming whether the
asset lives they have assigned to their assets are accurate.
Councils’ funding sources are continuing to increase
3.50 Councils’ financial strategies discuss two major funding sources: rates revenue
and borrowing.
Rates revenue
3.51 Figure 8 compares rates revenue forecast in the 2018-28 LTPs to what was
forecast in the 2015-25 LTPs, for councils as a whole. Rates revenue is forecast to
be $6.2 billion in 2018/19 and is forecast to increase to $9.3 billion in 2027/28.
This is an increase of slightly more than 50% during the 10-year period. It is similar
to the 2015-25 LTP forecasts, where councils forecast an increase of 47% in rates
during the 10-year period.
3.52 Council rate increases are primarily because of three factors:
• to fund inflation (the cost of services increasing over time);
• to fund the cost of new services; and
• to reflect increased demand for services (this is relevant for growth councils).
3.53 Projected rates revenue in 2018/19 is similar to what was forecast in the 2015-25
LTPs. However, in the 2018-28 LTPs, rates are forecast to increase at a faster rate
compared with the 2015-25 forecasts.
23Part 3
Financial trends and insights
Figure 8
Rates revenue for councils as a whole, as forecast in the 2015-25 and 2018-28
long-term plans
In the latest LTPs, the projected rates revenue for 2018/19 is similar to what was forecast in the
2015-25 LTPs. For the following years, however, rates revenue is forecast to increase at a faster
rate compared with the 2015-25 forecasts.
$billion
10.0 6 %
8.0 5
Forecast 4
6.0
annual
rates 3
revenue 4.0
2
2.0 1
0.0 0
2016 2017 2018 2019 2020 2021 2022 2023 2024 2025 2026 2027 2028
Year ended 30 June
2015-25 LTP forecast of rates revenue (left-hand scale)
2018-28 LTP forecast of rates revenue (left-hand scale)
2015-25 LTP % increase in rates revenue (right-hand scale)
2018-28 LTP % increase in rates revenue (right-hand scale)
3.54 In their LTPs, councils consistently state that they want to provide affordable
services. Figure 8 shows that councils overall forecast that annual rates increases
are below 4% in only one year – 2027/28. The annual forecast rates increases in
the current LTP forecasts are also higher than that forecast in the 2015-25 LTPs.
3.55 Some of the forecast annual rates increases will be because of growth and
therefore more ratepayers. Most of these forecast rates increases will be charged
to existing ratepayers.
Debt and borrowing
3.56 In the 2018-28 LTP forecasts, councils overall are forecasting to borrow about
$5.4 billion more in 2024/25 compared with 2015-25 LTP forecasts (see Figure 9).
This is despite the forecast debt position in 2018/19 being almost the same for
both 2015-25 and 2018-28 LTPs, at $17.6 billion. Debt is forecast to increase
47% in the 2018-28 LTPs and expected to peak at $25.9 billion in 2026/27.
3.57 Metropolitan councils are forecasting the highest increase in debt during the
10-year period of the LTP, with debt increasing by 72%. The forecast lowest
increase in borrowing, 28% for rural councils, is still significant. Auckland Council
remains the largest council borrower.
24Part 3
Financial trends and insights
Figure 9
Debt forecast in the 2015-25 and 2018-28 long-term plans
In the 2018-28 LTPs, debt is forecast to increase at a greater rate than was forecast in the
2015-25 LTPs and is expected to peak at $25.9 billion in 2026/27.
$billion
30
25
20
Forecast
15
total debt
10
5
0
2016 2017 2018 2019 2020 2021 2022 2023 2024 2025 2026 2027 2028
As at 30 June
2015-25 LTP 2018-28 LTP
3.58 Not all councils are forecasting to have debt. In the current LTP forecasts, between
six and eight councils forecast to have no external borrowings. The number
increases as some councils forecast to repay their debt in the LTP period. Regional
councils are more likely to not borrow.
3.59 By and large, the increase in forecast debt is to fund the councils’ large capital
expenditure programme, as discussed in paragraphs 3.23 to 3.33.
3.60 Some councils (Auckland Council, metropolitan councils, and other high-growth
councils) generally have proportionately more debt than other councils. These
high debt levels could limit how councils might respond to unexpected events.
3.61 Interest rates have been historically low in New Zealand since the global financial
crisis. Based on the current LTP forecasts, councils overall are forecasting lower
interest rates compared with 2015-25 (see Figure 10).
25Part 3
Financial trends and insights
Figure 10
Interest expense and interest expense as a percentage of borrowing, as forecast
in the 2015-25 and 2018-28 long-term plans
Councils overall are forecasting lower interest rates compared with 2015-25.
$billion
1.6 6.0 %
1.4 5.8
1.2 5.6
1.0 5.4
Forecast
0.8 5.2
total
annual
0.6 5.0
interest
expense
0.4 4.8
0.2 4.6
0.0 4.4
2016 2017 2018 2019 2020 2021 2022 2023 2024 2025 2026 2027 2028
Year ended 30 June
2015-25 LTP forecast of interest expense (left-hand scale)
2018-28 LTP forecast of interest expense (left-hand scale)
2015-25 LTP interest as % of borrowing (right-hand scale)
2018-28 LTP interest as % of borrowing (right-hand scale)
3.62 Councils that are borrowing need to have approaches to protect themselves from
any significant increase in interest rates. Potentially small increases in interest
rates above those forecast might mean that some councils are unable to service
what they propose to borrow without making other changes, such as increasing
rates or cutting expenditure.
26Financial strategies 4
4.1 In this Part, we outline the legal requirement for councils to prepare a financial
strategy. We also comment on how effective the financial strategies were in
meeting the requirements.
4.2 Financial strategies are a critical part of the LTP. For the readers of the LTP to
meaningfully assess the prudence of councils’ financial management, the
financial strategy must be clear about its goals and trade-offs and presented in a
concise way.
4.3 Financial strategies have been required for the last three LTPs. However, we
have seen little improvement in how they are presented during this time. We
encourage councils to put more effort into their future financial strategies. We
suggest that councils could usefully focus on presenting clear and succinct
information that is truly strategic.
4.4 As noted in Part 1, we consider that it would be useful for the Department of
Internal Affairs and the sector to consider the effects and effectiveness of the
current disclosure requirements. The disclosures required by section 101A of the Act
and the Local Government (Financial Reporting and Prudence) Regulations 2014, in
particular, could usefully be considered to ensure that they remain fit for purpose.
4.5 There is a risk that these disclosures are not helping readers to understand how
councils manage their finances and evaluate their council’s performance.
Legislative requirements for financial strategies
4.6 The Act sets out the purpose and required content of the financial strategy. The
financial strategy must cover the period of the LTP, which is at least 10 years, and
must be updated for each LTP.
4.7 The purpose of the financial strategy is to:20
• facilitate prudent financial management by the council by providing a guide for
the council to consider proposals for funding and expenditure against; and
• provide a context for consultation on the council’s proposals for funding and
expenditure by making transparent the overall effects of those proposals on
the council’s services, rates, debt, and investments.21
4.8 The financial strategy is a mix of forecast information about what could have a
significant financial effect on the council, such as changes in population or land
use, expected capital expenditure in significant areas, and disclosures about
financial parameters in which the council will operate (limits on rates, rates
increases, borrowing, and targeted returns for financial investments).
20 Local Government Act 2002, section 101A.
21 This occurs when consulting on the proposed content of the LTP. The consultation document must set out the
public interest matters relating to the proposed content of the financial strategy. 27Part 4
Financial strategies
4.9 The requirement for a financial strategy fits with the purposes of the LTP,
particularly those related to integrated decision-making, long-term planning, and
accountability.
Are financial strategies meeting the legislative intentions?
4.10 Financial strategies were introduced into the Act in 2010 and were first required
to be included in the 2012-22 LTPs. We have previously said that we were pleased
to see the financial strategy included as a compulsory disclosure. This is because
it improved the information contained in the LTPs and helped communities to
assess the implications of the decisions they were consulted on.
4.11 After reviewing the financial strategies in the 2012-22 LTPs, we noted that the
most useful strategies were those that discussed the implications of the chosen
strategy in a broad way, rather than including only what is required by the Act.
Councils needed to remain focused on the intent of the financial strategy and
balance the broader purpose against the specific disclosure requirements.
4.12 We cautioned against any further prescription of disclosure requirements for the
financial strategy, which could lead the sector to address the requirements in a
mechanistic way.22
4.13 After considering the 2018-28 financial strategies, we consider that there remains
room for improvement.
4.14 The Act’s requirements were included in most of the 2018-28 financial strategies.
However, this did not mean we found the financial strategies as effective as they
should be.
4.15 In our view, for a financial strategy to be effective, it needs to clearly explain the
end goal – and the decisions and trade-offs the council has to consider to reach
that goal – in a way that is relevant to readers. In effect, councils should be clear
about the implications arising from their financial strategy. In our view, the
implications arising from the financial strategy was still not strongly presented in
many cases.
4.16 Kāpiti Coast District Council was one of the few exceptions. The Council presented
a financial strategy that, in our view, effectively presented the Council’s goal
and how the Council plans to achieve that goal. It also presents an effective
description of how the combined use of rates, capital expenditure, and debt
influences the level of service provided to the community.
28 22 Controller and Auditor-General (2012), Matters arising from the 2012-22 local authority long-term plans.You can also read