Interim Q2 2019 - Investor Relations

Page created by Mike Austin
 
CONTINUE READING
Interim Q2 2019 - Investor Relations
15 August 2019                                                                              ALL THE WAY

     Interim
           Report
      Q2 2019

A.P. Møller - Mærsk A/S   Esplanaden 50, DK-1098 Copenhagen K / Registration no. 22756214
Interim Q2 2019 - Investor Relations
002   A.P. Moller - Maersk Interim Report Q2 2019               Contents

                    Table of
                                                                                                                                                 The Interim Report for Q2 2019 of A.P. Møller - Mærsk A/S
                                                                                                                                                 (further referred to as A.P. Moller - Maersk or Maersk
                                                                                                                                                 as the consolidated group of companies) has been pre-

                         contents
                                                                                                                                                 pared in accordance with IAS 34 ‘Interim Financial
                                                                                                                                                 Reporting’ as issued by the International Accounting
                                                                                                                                                 Standards Board (IASB) and as adopted by the EU and
                                                                                                                                                 additional Danish disclosure requirements for interim
                                                                                                                                                 financial reporting of listed companies.

                                                                                                                                                 Change in presentation and comparative figures

                                        003 Directors’ report                           039 Statements                                           The IFRS 16 leases accounting standard entails lessees
                                                                                                                                                 to recognise leases in the balance sheet as a right-of-use
                                                    005 Highlights Q2 2019                  039	
                                                                                            039 Statement of the Board of Directors and          (ROU) asset and a related lease liability. In the income
                                                                                                 the Executive Board                             statement, the lease cost is replaced by depreciation of
                                                    006 Summary financial information
                                                                                                                                                 the leased asset and an interest expense for the financial
                                                                                            040	
                                                                                            040 Independent Auditor’s Review Report on interim
                                                    008 Financial review Q2 2019                                                                 liability.
                                                                                                 consolidated financial statements
                                                    011 Guidance for 2019
                                                                                                                                                 The standard was implemented on 1 January 2019 using
                                                    012 Strategy update                                                                          the modified retrospective approach, and comparative
                                                                                        041 Financials                                           figures have not been restated in the interim consoli-
                                                    015 Market update
                                                                                            042 Condensed income statement                       dated financial statements. A.P. Moller - Maersk uses
                                                                                                                                                 EBITDA as the key operating performance indicator,
                                                                                            043	
                                                                                            043 Condensed statement of comprehensive income
                                                                                                                                                 and 2018 figures have therefore been restated in the
                                                    018 Segment review
                                                                                            044 Condensed balance sheet at 30 June               Directors´ Report and internal reporting to retrospec-
                                                    019 Ocean                                                                                    tively reflect the effect of IFRS 16. Guidance for 2019 is
                                                                                            045 Condensed cash flow statement
                                                    023 Logistics & Services                                                                     based on IFRS 16.
                                                                                            046 Condensed statement of changes in equity
                                                    026 Terminals & Towage                                                                       Maersk Supply Service has been reclassified as continuing
                                                                                            047 Notes
                                                    032 Manufacturing & Others                                                                   operations, following the Board of Directors’ decision to
                                                                                                                                                 no longer pursue a separation solution. Comparison fig-
                                                    035	
                                                    035 Financial review H1 2019                                                                 ures for the income statement, balance sheet and cash
                                                                                        056 Additional information                               flow statement have been restated as if Maersk Supply
                                                                                            057 Quarterly summary                                Service had always been part of continuing operations.

                                                                                            058 Definition of terms
                                                                                                                                                 Unless otherwise stated, all figures in parenthesis refer to
                                                                                                                                                 the corresponding figures for the same period prior year.
      Cover photo
                                                                                                                                                 Forward-looking statements
      Bringing bananas and pineapples to the world
                                                                                                                                                 The interim report contains forward-looking state-
      Today, Costa Rican exporters can transport their goods faster                                                                              ments. Such statements are subject to risks and uncer-
      to new and additional markets in Asia and Europe. With this                                                                                tainties as numerous factors, many of which are beyond
                                                                                                                                                 A.P. Moller - Maersk’s control, may cause the actual
      ability to move products on transcontinental routes without                                                                                development and results to differ materially from
      transhipments, Maersk is enabling customers’ growth and                                                                                    expectations contained in the interim report.

      improving societal opportunities.
Interim Q2 2019 - Investor Relations
003   A.P. Moller - Maersk   Interim Report Q2 2019   Directors’ report

           Directors’
                 report
              Highlights Q2 2019

              Summary financial information

              Financial review Q2 2019

              Guidance for 2019

              Strategy update

              Market update

              Segment review

              Financial review H1 2019
Interim Q2 2019 - Investor Relations
004   A.P. Moller - Maersk   Interim Report Q2 2019          Directors’ report   Highlights Q2 2019

                              ”Q2 was a quarter of solid progress. EBITDA was up 17% and cash flow improved 86%
                               year on year, driven by continued recovery in Ocean.

                               The transformation progressed further with an improved cash return on invested
                               capital at 6.9% and synergies of USD 1bn realised earlier than expected. Growth in
                               revenue and gross profit in Logistics & Services still need to improve as we continue
                               to build capabilities within logistics and services.

                               We reaffirm our guidance for 2019, while the macro environment continues to be
                               subject to considerable uncertainties,”

                               says Søren Skou
                               CEO of A.P. Moller - Maersk
Interim Q2 2019 - Investor Relations
005   A.P. Moller - Maersk   Interim Report Q2 2019          Directors’ report   Highlights Q2 2019

Strong improvement in                                                                                                                                        which – combined with lower gross CAPEX of USD

     earnings and free cash flow
                                                                                                                                                             445m (USD 782m) – led to a free cash flow before
                                                                                                                                                             capitalised lease payments of positive USD 746m
                                                                                                                                                             (negative USD 251m).

   Highlights Q2 2019                                                                                                                                        CAPEX discipline remains a key focus area with no
                                                                                                                                                             new orders of large vessels or new major terminal
                                                                                                                                                             investments expected earlier than 2020 and with
                                                                                                                                                             long-term contractual commitments at an all-time
                                                                                                                                                             low of USD 1.9bn (USD 2.8bn).

                                               Progressing on the transformation                      Strong improvement                                     More than USD 600m
                                               As part of the strategic plan to transform the com-    in profitability continued                             in cash distributed to shareholders
                                               pany to become the global integrator of container      Revenue grew slightly by USD 59m to USD 9.6bn          In Q2, A.P. Moller - Maersk distributed USD 615m
                                               logistics and provide customers with end-to-end        (USD 9.6bn), and the continued focus on improv-        in cash to shareholders through an ordinary divi-
                                               solutions, connecting and simplifying their supply     ing profitability across the businesses resulted in    dend of USD 469m and USD 146m related to the
                                               chain, we are tracking key metrics on a quarterly      a 17% increase in EBITDA to USD 1.4bn (USD 1.2bn)      first phase of the share buy-back programme
                                               basis. The metrics track the progress related to       and a margin of 14.1% (12.1%). This was mainly         announced in May 2019 of DKK 10bn (around USD
                                               rebalancing the business between Ocean and non-        driven by strong operational performance in Ocean      1.5bn) over a period of up to 15 months.
                                               Ocean, creating synergies across our businesses        with an increase in average freight rates of 1.5%,
                                               as one company and generating free cash-flow to        a volume increase of 1.4% and unchanged total          Net interest-bearing debt of USD 12.9bn includ-
                                               ensure a strong balance sheet.                         costs. Unit cost improved by 3.5%, driven by net-      ing lease liabilities was slightly up from end of
                                                                                                      work improvements, leading to better schedule          Q1 2019, while Maersk remains investment grade
                                               We have continued the progress on generating           reliability and lower bunker consumption.              rated with a stable outlook from Moody’s and
                                               free cash flow with a cash return on invested                                                                 Standard & Poor’s.
                                               capital (CROIC) of 6.9% and realising synergies        Operating profit (EBIT) improved from USD 65m to
                                               of USD 0.1bn in Q2 2019. Total synergies accu-         USD 416m, reflecting an improvement in margin
                                               mulate to USD 1.0bn by the end of June, thereby        to 4.3% (0.7%) and leading to a higher return on       Guidance for 2019 maintained
                                               achieving the target earlier than expected.            invested capital (ROIC) of 3.1% (0.1%), while under-   While earnings before interest, tax, depreci-
                                                                                                      lying profit was positive by USD 134m (USD 15m).       ation and amortisation (EBITDA) for the first
                                               On the non-Ocean related metrics, we are still in a                                                           half-year improved by USD 500m to USD 2.6bn,
                                               build-up phase after reorganising and integrating                                                             A.P. Moller - Maersk reiterates it’s full-year guid-
                                               the Ocean and Logistics & Service businesses into      Free cash flow improved due to                         ance for 2019 of an EBITDA of around USD 5.0bn
                                               one commercial organisation in Q1. The non-Ocean       improved earnings and reduced CAPEX                    including effects from IFRS 16. The guidance con-
                                               revenue declined by 1.2%, but grew 2.1% when           Following the strong earnings development and          tinues to be subject to considerable uncertainties
                                               adjusted for the closure of production facilities in   lower net working capital, the cash conversion         due to the weaker macro-economic conditions and
                                               Maersk Container Industry, while gross profit in       ratio increased to 86% (54%) and a cash flow from      other external factors impacting container freight
                                               Logistics & Services improved by 4.9%.                 operating activities of USD 1.2bn (USD 630m),          rates, bunker prices and foreign exchange rates.
Interim Q2 2019 - Investor Relations
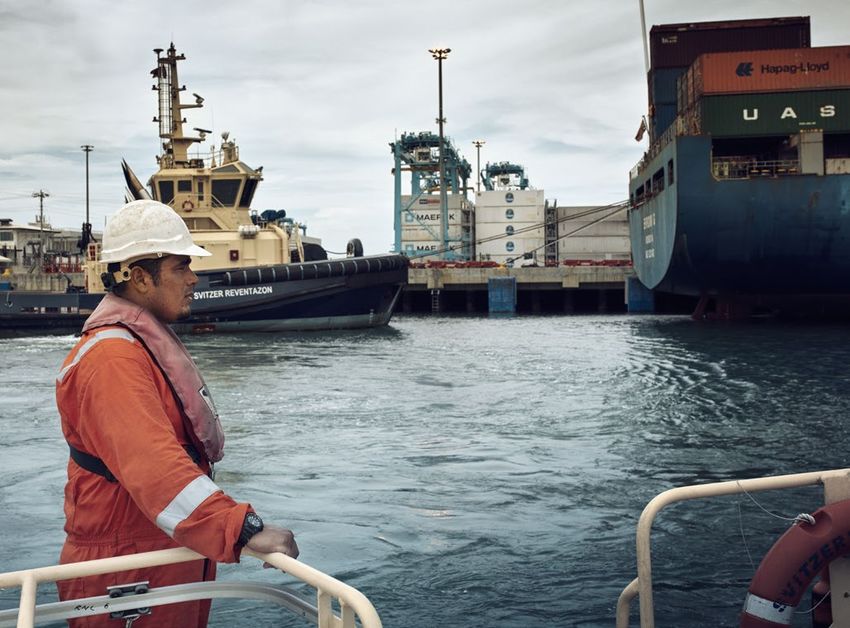
006     A.P. Moller - Maersk   Interim Report Q2 2019                Directors’ report    Summary financial information

                                                                                                                                                                                                                     Amounts in USD million

Summary financial information 1/2
                                                                                                                  Q2                                 6 months         Full year    1 Q2 and 6 months 2018 restated including Maersk
                                                                                                                                                                                     Supply Service as continuing operations as reported
                                                                                2019             2018           2018       2019            2018           2018             2018      in the financials pages 41-55.
                                                                                         incl. IFRS 16 incl. restated              incl. IFRS 16 incl. restated    incl. IFRS 16   2 Q2, 6 months and full year 2018 presented as if
Income statement                                                                             and MSS²            MSS ¹                 and MSS²            MSS ¹       and MSS²
                                                                                                                                                                                     IFRS 16 had been implemented in 2018, for com-
Revenue                                                                        9,627           9,568           9,577      19,167       18,873          18,889          39,257        parison purposes.
Profit before depreciation, amortisation and                                                                                                                                       3 Following the classification of Maersk Oil and Maersk
impairment losses, etc. (EBITDA)                                               1,357           1,162             880       2,593         2,093           1,552           4,998       Drilling as discontinued operations in 2017, the busi-
Depreciation, amortisation and impairment losses, net                          1,024           1,166             922       2,106         2,186           1,707           4,756       nesses are presented separately on an aggregated
Gain on sale of non-current assets, etc., net                                     16              13              13          34            46              46             166       level in the income statement, balance sheet and cash
Share of profit/loss in joint ventures                                            34              39              39          58            76              76             116       flow statement. The Maersk Oil transaction was closed
Share of profit/loss in associated companies                                      33              17              17          67            43              43            -115       on 8 March 2018. Maersk Drilling was demerged on
Profit/loss before financial items (EBIT)                                        416              65              27         646            72              10             409       2 April 2019.
Financial items, net                                                            -170            -154             -77        -398          -374            -197            -766     4 Underlying profit/loss is profit/loss for the period
Profit/loss before tax                                                           246             -89             -50         248          -302            -187            -357       from continuing operations adjusted for net gains/
Tax                                                                               92              64              64         198           162             162             398       losses from sale of non-current assets, etc. and net
Profit/loss for the period – continuing operations                               154            -153            -114          50          -464            -349            -755       impairment losses as well as transaction, restructuring
Profit/loss for the period – discontinued operations³                             -1             121             121        -553         3,102           3,102           3,787       and integration costs related to acquisitions/divest-
Profit/loss for the period                                                       153             -32               7        -503         2,638           2,753           3,032       ments. The adjustments are net of tax and include
A.P. Møller - Mærsk A/S’ share                                                   141             -41              -2        -518         2,615           2,728           2,985       A.P. Moller - Maersk’s share of mentioned items in
                                                                                                                                                                                     associates and joint ventures.
Adjustments to profit/loss for the period – continuing operations:
Profit/loss for the period – continuing operations                               154            -153            -114          50          -464            -349            -755
Gain/loss on sale of non-current assets, etc., net                               -16             -13             -13         -34           -46             -46            -166
Impairment losses, net                                                           -29             124             124          -8           123             123             757
Transaction and integration cost                                                  24              36              36          55            49              49              78
Tax on adjustments                                                                 1              21              21           2            24              24              25
Underlying profit/loss – continuing operations⁴                                  134              15              54          65          -314            -199             -61

Balance sheet
Total assets                                                                 56,555          67,157          61,166       56,555       67,157          61,166          62,690
Total equity                                                                 28,997          33,435          33,553       28,997       33,435          33,553          33,205
Invested capital                                                             41,910          53,854          47,891       41,910       53,854          47,891          49,255
Net interest-bearing debt                                                    12,910          20,517          14,438       12,910       20,517          14,438          14,953

Cash flow statement
Cash flow from operating activities                                            1,170             630             338       2,652         1,358             788           4,442
Gross capital expenditure, excl. acquisitions
and divestments (CAPEX)                                                          445             782             782       1,223         2,141           2,141           3,219
Cash flow from financing activities                                             -759            -661            -369      -2,071        -1,579          -1,009          -8,080
Net cash flow from discontinued operations                                      -419             175             175        -372         2,468           2,468           3,968
Interim Q2 2019 - Investor Relations
007    A.P. Moller - Maersk   Interim Report Q2 2019      Directors’ report    Summary financial information

                                                                                                                                                                                                         Amounts in USD million

Summary financial information 2/2
                                                                                                       Q2                                 6 months         Full year    1 Q2 and 6 months 2018 restated including Maersk
                                                                                                                                                                          Supply Service as continuing operations as reported
                                                                     2019             2018           2018       2019            2018           2018             2018      in the financials pages 41-55.
                                                                              incl. IFRS 16 incl. restated              incl. IFRS 16 incl. restated    incl. IFRS 16   2 Q2, 6 months and full year 2018 presented as if
Financial ratios                                                                  and MSS²            MSS ¹                 and MSS²            MSS ¹       and MSS²
                                                                                                                                                                          IFRS 16 had been implemented in 2018, for com-
Revenue growth                                                       0.6%          23.3%           23.4%        1.6%         26.6%           26.7%           25.9%        parison purposes.
Revenue growth excl. Hamburg Süd (2018)                                             4.1%            4.3%                      6.4%            6.5%            8.2%
EBITDA margin                                                       14.1%          12.1%            9.2%       13.5%         11.1%            8.2%           12.7%      Notes:
Cash conversion                                                       86%            54%             38%        102%           65%             51%             89%      The interim consolidated financial statements for the
Return on invested capital after tax                                                                                                                                    period 1 January - 30 June on pages 41-55 have been
– continuing operations (ROIC)                                       3.1%           0.1%           -0.3%        2.2%         -0.2%           -0.6%            0.2%      subject to review by the independent auditor, cf. page
Return on equity after tax, annualised                               2.0%          -0.4%            0.1%       -3.2%         16.3%           17.0%            9.3%      40 and are prepared in accordance with IAS 34 ‘Interim
Equity ratio                                                        51.3%          49.8%           54.9%       51.3%         49.8%           54.9%           53.0%      Financial Reporting’ as issued by the International
                                                                                                                                                                        Accounting Standards Board (IASB) and adopted by
Stock market ratios
                                                                                                                                                                        the EU and additional Danish disclosure requirements
Earnings per share – continuing operations, USD                        7              -7              -6            2          -23             -18             -37      for interim financial reporting of listed companies.
Diluted earnings per share – continuing operations, USD                7              -7              -6            2          -23             -18             -37
Cash flow from operating activities per share, USD                    57              31              16          128           66              38             214
Share price (B share), end of period, DKK                          8,142           7,948           7,948        8,142        7,948           7,948           8,184
Share price (B share), end of period, USD                          1,241           1,243           1,243        1,241        1,243           1,243           1,255
Total market capitalisation, end of period, USDm                  24,749          25,172          25,172       24,749       25,172          25,172          25,256

Ocean financial highlights
Revenue                                                             7,150           6,952           6,952      14,079       13,762          13,762          28,366
Profit/loss before depreciation, amortisation
and impairment losses, etc. (EBITDA)                                1,068            856              674      1,995         1,508            1,155          3,782
EBITDA margin                                                       14.9%          12.3%             9.7%      14.2%         11.0%             8.4%          13.3%

Logistics & Services financial highlights
Revenue                                                             1,484           1,489           1,489       2,932         2,944           2,944           6,082
Profit/loss before depreciation, amortisation
and impairment losses, etc. (EBITDA)                                   61              52              28        112             97              51             191
EBITDA margin                                                        4.1%            3.5%            1.9%       3.8%           3.3%            1.7%            3.1%

Terminals & Towage financial highlights
Revenue                                                               957             847             847       1,948         1,758           1,758           3,772
Profit/loss before depreciation, amortisation
and impairment losses, etc. (EBITDA)                                  226            226             178         493           470             374             998
EBITDA margin                                                       23.6%          26.7%           21.0%       25.3%         26.7%           21.3%           26.5%

Manufacturing & Others financial highlights
Revenue                                                               459             697             706       1,017         1,369           1,385           2,787
Profit/loss before depreciation, amortisation
and impairment losses, etc. (EBITDA)                                   36              33               5         57             81              36             163
EBITDA margin                                                        7.8%            4.7%            0.7%       5.6%           5.9%            2.6%            5.8%
Interim Q2 2019 - Investor Relations
008     A.P. Moller - Maersk   Interim Report Q2 2019       Directors’ report      Financial review Q2 2019

Financial review
Q2 2019
A.P. Moller - Maersk reported an increase in EBITDA of 17% mainly driven
by an improvement in Ocean, supported by higher freight rates, increased
volumes and strong operational execution leading to improved unit cost,
partly offset by a subdued macro environment.

Cash flow generation improved significantly with cash flow from operations
of USD 1.2bn based on a cash conversion ratio of 86%.

Highlights Q2
USD million                                                                     Revenue                       EBITDA           CAPEX    1 Q2 2018 presented as if IFRS 16
                                                                                                                                          had been implemented in 2018
                                                                  2019            2018 ¹       2019            2018 ¹   2019   2018 ¹     and adjusting for Maersk Supply
Ocean                                                            7,150           6,952        1,068             856     314     549       Service as continuing operations.

Logistics & Services                                             1,484           1,489            61             52      29      12

Terminals & Towage                                                 957             847          226             226      85     116

Manufacturing & Others                                             459             697            36             33      10      78

Unallocated activities, eliminations, etc.                        -423            -417           -34              -5      7      27

A.P. Moller - Maersk consolidated – continuing operations        9,627           9,568        1,357           1,162     445     782
Interim Q2 2019 - Investor Relations
009   A.P. Moller - Maersk   Interim Report Q2 2019   Directors’ report   Financial review Q2 2019

The financials are materially impacted by the
implementation of IFRS 16. Comparative figures
for 2018 have been restated in the Directors’
report to provide the reader with a relevant basis
for assessing the development in the financial                            ”EBITDA increased by 17% to USD 1.4bn (USD 1.2bn)
performance.
                                                                           primarily due to an increase in Ocean of USD 212m,
Revenue was on par with Q2 last year at USD                                driven by higher freight rates and volumes as well as
9.6bn (USD 9.6bn) with an increase of USD
198m in Ocean and USD 110m in Terminals &                                  strong operational efficiency.”
Towage, partly offset by revenue decrease in
Manufacturing & Others mainly due to the exit
from the dry container business and 30% lower
revenue in the reefer segment as well as the
divestment of bulk activities originally acquired
from Hamburg Süd.

EBITDA increased by 17% to USD 1.4bn (USD                                                            Cash flow from operating activities was USD           The contractual capital commitments totalled
1.2bn) primarily due to an increase in Ocean of                                                      1.2bn (USD 630m), positively impacted by an           USD 1.9bn end of Q2, of which USD 1.2bn related
USD 212m driven by higher freight rates and                                                          increase in EBITDA of USD 195m and improve-           to commitments towards terminal concession
volumes as well as strong operational efficiency.                                                    ment in changes in net working capital of USD         grantors and USD 0.3bn related mostly to invest-
The impact on EBITDA from development in                                                             308m, leading to an improvement in cash conver-       ments in scrubbers for vessels and retrofits. Con-
foreign exchange rates was insignificant.                                                            sion of 86% (54%).                                    tinued CAPEX discipline and focus on free cash
                                                                                                                                                           flow generation remains a key focus area with no
EBIT was USD 416m (USD 65m), positively                                                              Gross capital expenditure (CAPEX) was USD             new orders of large vessels or new major terminal
impacted by improved EBITDA, while Q2 2018                                                           445m (USD 782m), mainly related to the new-           investments expected earlier than 2020.
was negatively impacted by write-down of                                                             builds received in Ocean and terminal equipment
assets in Maersk Container Industry.                                                                 in gateway terminals.                                 Capital structure, issue of bonds and credit rating
                                                                                                                                                           Net interest-bearing debt decreased to USD
Financial expenses, net was USD 170m (USD                                                            Free cash flow before capitalised lease payments      12.9bn (USD 15.0bn at 31 December 2018), posi-
154m) positively impacted by the reduced inter-                                                      was USD 746m (USD 43m), positively impacted by        tively impacted by cash flow related to cash pro-
est expenses from lower debt in 2019 which was                                                       the increase in cash flow from operating activities   ceeds of USD 2.6bn from the sale of the remaining
more than offset by dividends from Total S.A. of                                                     and lower CAPEX. Adjusted for capitalised lease       part of shares in Total S.A. in Q1 2019 and positive
USD 0m (USD 72m), which reduced net financial                                                        payments related to IFRS 16, free cash flow was       operating cash flow of USD 2.7bn, partly offset by
expenses.                                                                                            USD 0.4bn.                                            the annual dividend, share buy-back, interest pay-
                                                                                                                                                           ments and additional capitalised lease liabilities
The underlying profit for continuing operations                                                      Net cash flow from discontinued operations            of USD 1.2bn. The additional capitalised lease liabil-
after financial items and tax was USD 134m                                                           was negative by USD 419m mainly related to            ities are primarily due to a new terminal concession
(USD 15m).                                                                                           cash and bank balances disposed to Maersk             with Tangier Med II, Morocco, going into operations
                                                                                                     Drilling at demerger.                                 in January 2019.
Interim Q2 2019 - Investor Relations
010   A.P. Moller - Maersk   Interim Report Q2 2019   Directors’ report   Financial review Q2 2019

                                                                                                     A.P. Moller - Maersk had net funding proceeds           In the first phase of the programme running
                                                                                                     of USD 65m (net repayments of USD 13m) in Q2,           from 4 June 2019 up to 1 November 2019,
                                                                                                     mainly driven by proceeds from a new USD 500m           A.P. Moller - Maersk will buy back A and B shares
                                                                                                     10-year bond issued by A.P. Moller - Maersk in the      for an amount of up to DKK 3.3bn. Up until 30 June
                                                                                                     US bond market in June, offset by repayments of         2019, a total of 25,736 A shares and 102,928
                                                                                                     leases of USD 415m (USD 345m).                          B shares have been repurchased with a value of
                                                                                                                                                             USD 146m. At 30 June, A.P. Moller - Maersk owns
                                                                                                     Maersk remains investment grade rated and               a total of 25,736 A shares and 153,734 B shares
                                                                                                     holds a Baa3 (stable) rating from Moody’s and           as treasury shares, corresponding to 0.86% of
                                                                                                     a BBB (stable) rating from Standard & Poor’s.           the share capital.

                                                                                                     Dividend                                                Discontinued operations
                                                                                                     The ordinary dividend of DKK 150 per                    On 2 April 2019, the Annual General Meeting
                                                                                                     A.P. Møller - Mærsk A/S share of nominally DKK          approved the Board of Directors’ proposal to com-
                                                                                                     1,000 (in total equal to USD 469m) declared at          plete the demerger of Maersk Drilling. The demerger
                                                                                                     the Annual General Meeting on 2 April 2019 was          resulted in a reduction of A.P. Moller - Maersk’s
                                                                                                     paid on 8 April 2019.                                   equity by USD 3.4bn.

                                                                                                     Share buy-back                                          Maersk Drilling was listed on Nasdaq Copenhagen
                                                                                                     In Q2, the Board of Directors decided to exercise       on 4 April 2019.
                                                                                                     the authority to buy back shares with a maxi-
                                                                                                     mum value of DKK 10bn (around USD 1.5bn) over           This concludes the separation of the energy-
                                                                                                     a period of up to 15 months. This is in line with       related businesses.
                                                                                                     the previously announced intention to distribute
                                                                                                     a material part of the proceeds from the sale of
                                                                                                     the shares received in Total S.A. as part of the sale
                                                                                                     of Maersk Oil.
011       A.P. Moller - Maersk   Interim Report Q2 2019   Directors’ report   Guidance for 2019

Guidance for 2019                                                                                                                  Webcast and dial-in information
(Based on IFRS 16)                                                                                                                 A webcast relating to the Q2 2019 Interim Report
                                                                                                                                   will be held on 15 August 2019 at 11.00 (CET).
                                                                                                                                   Dial-in infor­
                                                                                                                                           information
                                                                                                                                                mation on investor.maersk.com.
                                                                                                                                   Presentation material for the webcast will be
                                                                                                                                   available on the same page.

                                                                                                                                   Contacts for further information
                                                                                                                                   Søren Skou, CEO
A.P. Moller - Maersk reiterates its guidance still        (CAPEX) of around USD 2.2bn and a high cash con-                         Tel. +45 3363 1901
expecting earnings before interests, tax, depreci-        version (cash flow from operations compared
ation and amortisations (EBITDA) of around                with EBITDA).                                                            Carolina Dybeck Happe, CFO
                                                                                                                                   Tel. +45 3363 3106
USD 5.0bn.
                                                          The guidance continues to be subject to con-                             Investors
The organic volume growth in Ocean is still               siderable uncertainties due to the weaker macro-                         Stig Frederiksen, Head of Investor Relations
expected to be in line with the estimated aver-           economic conditions and other external factors                           Tel. +45 3363 3106
age market growth of 1-3% for 2019. Guidance              impacting container freight rates, bunker prices
                                                                                                                                   Media
is maintained on gross capital expenditures               and foreign exchange rates.
                                                                                                                                   Signe Wagner, Head of External Relations
                                                                                                                                   Tel. +45 3363 1901

                                                                                                                                   The Interim Report for Q3 2019 is expected to
                                                                                                                                   be announced on 15 November 2019.

Sensitivities on guidance for 2019
The guidance of A.P. Moller - Maersk for 2019 depends on several factors. Based on the expected earnings level and all else
being equal, the sensitivities for the rest of 2019 for four key assumptions are listed in the table below:

Factors                                                                                              Revenue   Effect on EBITDA
                                                                                                                    Rest of year

Container freight rate                                                                     +/- 100 USD/FFE       +/- USD 0.7bn

Container freight volume                                                                    +/- 100,000 FFE      +/- USD 0.1bn

Bunker price (net of expected BAF coverage)                                              +/- 100 USD/tonne       +/- USD 0.2bn

Foreign rate of exchange (net of hedges)                                              +/- 10% change in USD      +/- USD 0.1bn
012   A.P. Moller - Maersk   Interim Report Q2 2019    Directors’ report   Strategy update

Strategy update

A.P. Moller – Maersk is in the middle of a transformation to be
a focused and integrated global container logistics company.
The vision is to become the global integrator of container
logistics, connecting and simplifying our customers global
supply chains.

The strategy of A.P. Moller - Maersk                   manage their global supply chains in a better and
As the global integrator of container logistics, we    more efficient way, with higher visibility and abil-
aim to serve our customers´ global end-to-end          ity to affect outcomes.
logistics needs, with a competitive and global
portfolio of relevant products and services at sea     Technology is core to both our vision to become the
and on land.                                           global integrator of container logistics and a key
                                                       enabler to enhance our operating performance.
Our purpose is clear. We aim to enable our export-     Our technology strategy focuses on three areas.
ing customers to sell their products in all relevant
markets in the world. We aim to enable our import-     The first focus area is digitising customer trans-
ing customers to source goods and parts from the       actions, enabling Maersk.com to become our key
most competitive suppliers and vendors around          transaction platform for all products and services.
the world. We aim to provide access to the most        As part of this, and to address inefficiencies in
competitive global transport network to our freight    our industry, we are working on more digitalised
forwarding and logistics customers.                    products. Maersk Spot, our new product with fixed
                                                       price and load guarantee, is a good example of that.
Our vision to become the global integrator of con-
tainer logistics is based on a strong belief that      Since the launch of Maersk Spot in Q1 2019, we
our 70,000 Ocean customers both require and are        are now offering the product on all trade lanes,
interested in buying simpler, easier to use products   except in and out of US. By end of Q2 we are mov-
and services. This includes end-to-end solutions,      ing approximately 8,000 FFE (8% of spot volumes)
on land and at sea, that enable our customers to       per week on this new product. Customers have
013   A.P. Moller - Maersk   Interim Report Q2 2019   Directors’ report   Strategy update

                                                      generally responded positively to the product           shippers, that connect to, provide data to, and use     Hamburg Süd has now been fully integrated, and
                                                      addressing some of the current inefficiencies in        the platform. Ocean carriers representing approxi-      in Q2 we achieved our announced combined USD
                                                      ocean shipping, and efforts are being made to           mately 60% of global capacity have now signed up        1bn target for synergies from the Hamburg Süd
                                                      further expand adoption.                                to support TradeLens, which is an important step        acquisition and from the integration of our trans-
                                                                                                              for the platform to achieve critical mass to signifi-   port and logistics activities.
                                                      The second focus area is to improve operations          cantly change the way the industry operates.
                                                      and increase utilisation of ships, containers and                                                               Our transformation has now entered a new
                                                      terminals through digitisation and automation as        In the coming years we expect to invest in growing      phase, where we focus 100% on executing on the
                                                      well as to improve and automate core processes          the Logistics & Services segment, which involves        strategy to become the global integrator of con-
                                                      in the company. Recently, we have achieved              a pipeline of bolt-on acquisitions to build capa-       tainer logistics. The aim is to continue to improve
                                                      improved fuel efficiency for our vessels through        bilities needed in various parts of the Logistics &     our financial results across our business and grow
                                                      technology.                                             Services segment and harvesting synergies across        our Logistics & Services segment well above mar-
                                                                                                              the entire supply chain. An example of this is the      ket growth through organic and in-organic growth
                                                      Improved operations will also aim to improve            acquisition of Vandegrift, a US-based customs bro-      with the ambition in 2023 to achieve a more bal-
                                                      the service delivery towards our customers and          kerage and logistics business to strengthen and         anced operating profit (EBIT) between Ocean and
                                                      we have since Q1 2018 improved reliability from         broaden the service offering to customers.              non-Ocean and to improve the return on invested
                                                      70.4% to 85.5% in Q2 2019 (source: SeaIntel, excl.                                                              capital (ROIC) in line with the long-term objective
                                                      Hamburg Süd).                                           Two and a half years into the strategy execution,       of a ROIC above 7.5%.
                                                                                                              based on the feedback we have received from our
                                                      Thirdly, we want to create new revenue streams          customers, and based on what we have already            Transformation programme
                                                      from digital products, such as TradeLens. TradeLens     achieved in the technology space, we are convinced      To achieve our vision of becoming the global integra-
                                                      builds on an ecosystem of users such as ocean car-      that our vision holds true and we can build the         tor of container logistics, we are investing significant
                                                      riers, ports, terminals, 3PL, customs authorities and   digital future of our industry.                         sums in three areas; 1) improving the quality of our
                                                                                                                                                                      core products by improving reliability of the physical
                                                                                                              Progress on the transformation                          product and improving the customer experience,
                                                                                                              Our transformation was initiated in the summer of       making it digital, instant and 24/7, 2) development
                                                                                                              2016, when the Board of Directors commissioned          of new unique logistics products including digi-
                                                                                                              a fundamental strategy review. The separation of        tal products, and 3) large scale technology-trans-
      ”Our transformation has now entered a new                                                               our energy-related businesses to focus on con-          formation of A.P. Moller - Maersk, replacing legacy

       phase, where we focus 100% on executing on                                                             tainer shipping, ports and logistics was announced
                                                                                                              in September 2016, and our vision to become
                                                                                                                                                                      systems at the core and digitising at the edge.

       the strategy to become the global integrator                                                           the global integrator of container logistics was        In the coming years we furthermore expect to invest
                                                                                                              announced in December 2016.                             significantly in growing the Logistics & Services
       of container logistics.”                                                                                                                                       segment, including bolt-on acquisitions.
                                                                                                              Since then Maersk Oil and Maersk Tankers
                                                                                                              have been divested. In April, Maersk Drilling           Our transformation program consists of a signif-
                                                                                                              was demerged via a separate listing on Nasdaq           icant number of discrete initiatives, which we call
                                                                                                              Copenhagen and the shares distributed to our            value streams. Each value stream is anchored with
                                                                                                              shareholders, completing the separation of our          a senior business leader. The executive leadership
                                                                                                              energy-related businesses.                              reviews progress monthly.
014    A.P. Moller - Maersk   Interim Report Q2 2019      Directors’ report   Strategy update

To fund the transformation journey, we are doing          contractual capital commitments were USD 1.9bn                                                   Given the importance of technology for achieving
two things. We are working hard to take cost out          of which USD 1.2bn are commitments towards                                                       our vision, over the last three years, we have built
and improve margins in the existing business              terminal concession grantors. We have achieved                                                   a new technology team. We are growing our tech-
across Ocean, Terminals & Towage, Manufacturing           this reduction by abstaining from starting new                                                   nology team (designers, software developers, AI
& Others as well as Logistics & Services. In particu-     terminal projects and ordering new large vessels                                                 experts, automation engineers, analytics experts
lar Ocean and Terminals & Towage has significantly        and will not do so until 2020 at the earliest.                                                   etc.) rapidly, to ensure we have the expertise and
improved results over the past two years, even if                                                                                                          talent to build solutions ourselves at speed. We
it is clear that the absolute level of profitability is   The organisation is changing                                                                     now employ almost 3,000 people in our tech-
still low. Our transformation program includes fur-       Effective January 2019, we completed a reorgan-                                                  nology team.
ther cost reduction initiatives for the coming years.     isation of A.P. Moller - Maersk. We are now organ-
                                                          ised as one company, with one global salesforce,                                                 Keeping track of progress
We are working equally hard to strengthen our             customer service team and delivery organisation                                                  To measure our strategic transformation towards
balance sheet, to enable acquisitions in Logistics        across Ocean and Logistics & Services. Corporate                                                 becoming a more balanced company between
& Services in the coming years. We have sharply           functions such as Finance, HR, Communications                                                    Ocean and non-Ocean, we are tracking four metrics
reduced new commitments to capital expendi-               and Legal operate company-wide. We are no                                                        besides our overall ROIC target (see table).
tures. At the end of 2016 we had committed                longer organised as a conglomerate with a corpo-
capital expenditures totalling more than USD              rate layer and stand-alone divisions, that operate                                               ROIC of 3.1% in Q2 2019 (0.1%) improved due to
5bn. At the end of the second quarter this year,          independently with own professional functions.                                                   higher earnings.

                                                                                                                                                           Non-Ocean revenue increased by 2.1% in Q2 2019,
                                                                                                                                                           adjusted for the closure of production facilities
                                                                                                                                                           in Maersk Container Industry. The closure of pro-
                                                                                                                                                           duction facilities in Maersk Container Industry
                                                                                                                                                           accounted for USD 88m of revenue in Q2 2018.

Tracking the transformation                                                                                                                                Logistics & Services improved gross profit by 4.9% to
                                                                                                                                                           USD 298m, reflecting a gross profit margin of 20%.
Transformation metrics                                              Q2           H1         Full year   Full year   1 Non-Ocean revenue declined by
                                                                                                                      1.2% in Q2 2019 and by 1.5% in H1
                                                                                                                                                           Combined synergies from the Hamburg Süd acqui-
                                                                 2019         2019              2018       2017       2019 before adjusting for the clo-
                                                                                                                                                           sition and from the integration of our transport and
Non-Ocean revenue growth                                         2.1% ¹        2.6% ¹           6.3%       5.6%       sure of the production capacity in
                                                                                                                      Maersk Container Industry.           logistics activities increased by USD 0.1bn in Q2 to
Logistics & Services, gross profit growth                        4.9%          3.6%             7.9%        N/A                                            USD 1.0bn by end of June 2019, thereby achieving
                                                                                                                                                           the target earlier than expected.
Realisation of annual synergies worth approx.
USD 1.0bn in total by 2019, USDbn (accumulated)                    1.0          1.0              0.7         0.1
                                                                                                                                                           Cash return on invested capital (CROIC) increased
Cash return on invested capital (CROIC)                          6.9%          6.8%             2.8%      -2.8%                                            to 6.9% in Q2 2019 due to strong free cash flow.

Long-term target

Return on invested capital after tax (ROIC)                      3.1%          2.2%             0.2%        N/A
015   A.P. Moller - Maersk   Interim Report Q2 2019   Directors’ report   Market update

Market update
                                                                                                             Chart 1: Global, East-West and North-South container imports
                                                                                                             Container demand volumes, y/y growth (%)                                   Global
                                                                                                                                                                                        North-South
                                                                                                                                                                                        Intra-regional
Global container trade grew by around 2.0% in Q2 2019 compared to Q2                                                                                                             8
                                                                                                                                                                                        East-West
                                                                                                                                                                                                     Global
2018, in line with our expected full year 2019 growth of 1-3%. The soft
                                                                                                                                                                                 6    Source: Internal Maersk
momentum hence continued from Q1 (chart 1), reflecting a broad-based                                                                                                                  Note: ContainerNorth-South
                                                                                                                                                                                                       demand
slowdown in all the main economies. Negative effects from escalating                                                                                                             4
                                                                                                                                                                                      growth weakened further
                                                                                                                                                                                                      Intra Regional
                                                                                                                                                                                      in Q2 2019 compared to
trade restrictions also weighed on trade growth.
                                                                                                                                                                                      last year.      East-West
                                                                                                                                                                                 2

                                                                                                                                                                                 0

                                                                                                                                                                               -2

                                                                                                                  2015           2016          2017       2018          2019
Market developments                                   1.3%, mainly into the East Coast of South America           Q2             Q2            Q2          Q2            Q2
East-West container trade volumes strengthened        as container demand has aligned more closely
in Q2 and grew by 3.2% compared to Q2 2018.           with weakening domestic demand developments.
European imports from Asia again grew strongly        Import growth in the Middle East and Indian sub-
by 5.8%, reflecting solid European retail sales and   continent grew by 2.4%, while African imports          Chart 2: Global export orders and container demand
despite the manufacturing slowdown in Europe,         increased by 2.3%. Intra-Regional trades posted
                                                                                                             y/y growth (3mma)                             Confidence index (3mma)      Global container demand
uncertainty about Brexit negotiations and a severe    growth of 1.8%, mainly driven by Intra Europe.
                                                                                                                                                                                        (left-hand side)
growth decline in Turkey. North American con-                                                                                                                                           Manufacturing export
tainer imports increased by 0.4% in Q2, as imports    In April 2019, the US increased tariffs on Chinese     8                                                                   54
                                                                                                                                                                                        orders (right-hand side)
from Asia declined by negative 0.6%, reflecting       imports from 10% to 25% on goods with value                                                                                                    Manufacturing
                                                                                                                                                                                                     Global containerexport
                                                                                                                                                                                                                      demandor
                                                                                                                                                                                 53
the US-China trade restrictions. Moreover, the        equivalent to 2-3% of globally traded goods.           6                                                                        3mma: 3 months moving
                                                                                                                                                                                      average.
modest growth in US capital expenditures weighed      Later, in early August, US tariffs of 10% on addi-                                                                         52
                                                                                                                                                                                      Source: Demand is internal
on US imports in Q2. Meanwhile, East-West back-       tional USD 300bn was announced to take effect          4
                                                                                                                                                                                      Maersk and Manufacturing
haul increased by 4.6% in Q2 2019. While exports      by 1 September 2019. The previous trade restric-                                                                           51
                                                                                                                                                                                      export orders is IHS Market.
from North America grew by 1.3%, exports from         tions, imposed during 2018 and mainly led by           2                                                                        Note: Global export orders
                                                                                                                                                                                 50
Europe grew strongly by 7.9%, possibly due to a       the US and China, have reduced bilateral trade                                                                                  (March at 49) continue to
                                                                                                             0                                                                        indicate weaker container
change of some Chinese import sourcing from           between the two countries, and it also led to shifts                                                                       49
                                                                                                                                                                                      demand growth.
Europe instead of from the US as US-China trade       in trade structures. So far, US importers have
                                                                                                             -2                                                                  48
restrictions escalated. North-South container         shifted imports away from China to other coun-
trades increased by 1.3% in Q2. Latin American        tries such as Vietnam, Korea, Thailand, India and                2013   2014      2015     2016    2017    2018      2019
import growth remained very weak by negative          Mexico. The impact of the newly imposed tariff                     Q2   Q2        Q2          Q2   Q2       Q2        Q2
016    A.P. Moller - Maersk   Interim Report Q2 2019          Directors’ report     Market update

                                                              hike is expected to be significant for the US-China    the Trade Facilitation Agreement of 2017 and the        Aside from the cyclical slowing of the global
                                                              bilateral trade and could in isolation remove up       Pacific Trade Agreement are now largely ratified,       economy, the main risks to global container
                                                              to 0.5% of global container demand in 2019 and         increasing the amount of trade flows covered by         demand relate to the US-China trade negotiations,
                                                              2020, and when US tariffs on additional USD            liberalised measures.                                   and if these setbacks materialise it could take
                                                              300bn is implemented later in the year, it could                                                               global container trade growth to the lower end of
                                                              result in a reduction of up to 1% in 2020. While       For the full year of 2019, global container trade       the 1-3% interval. Other risks to the outlook relate
                                                              China has retaliated several times against the US      is projected to increase by 1-3%. The moderation        to the effectiveness of fiscal and monetary stim-
                                                              actions, India also recently decided to impose tar-    of container demand growth compared to 2018             uli in major economies, such as the US and China.
                                                              iffs on US imports, although at a small scale com-     mirrors the continued slowdown in global manu-          Finally, the outcome of the Brexit negotiations
                                                              pared to global volumes. Meanwhile, trade liberal-     facturing and global export orders (chart 2). The       poses a risk to UK and European container trade.
                                                              isation is on the rise elsewhere according to WTO,     recent softening of global sentiment, above all in
                                                              partially outweighing the negative trade impact        the manufacturing sector, reduces the likelihood        The global container fleet stood at 22.7m TEU at
                                                              from the US-China trade tensions. In particular,       of a growth pick-up in the second half of 2019.         the end of Q2 2019, 3.7% higher than in Q2 2018
                                                                                                                                                                             (chart 3). Deliveries amounted to 260k TEU (34 ves-
                                                                                                                                                                             sels) during Q2 and were again dominated by ves-
                                                                                                                                                                             sels larger than 10k TEU. 44k TEU (30 vessels) were
                                                                                                                                                                             scrapped in Q2, which is significantly less than in Q1
                                                                                                                                                                             when 93k TEU were scrapped. Idling totalled 1.6%
                                                                                                                                                                             (363k TEU) of the fleet at the end of Q2. The idle
                                                                                                                                                                             fleet had increased to 4% of the fleet in the middle
                                                                                                                                                                             of Q1 but has steadily declined since then, reflecting
                                                                                                                                                                             the beginning of the peak season and as some ves-
                                                                                                                                                                             sels, primarily in the +10k TEU segment, were taken
Chart 3: Global container demand and nominal supply growth                                                                                                                   out of the fleet for scrubber retrofitting. Only two
                                                                                                                                                                             new vessels (4k TEU) were ordered in Q2, and the
y/y growth, (%)                                                                                                        Global container demand
                                                                                                                                                                             orderbook-to-fleet ratio dropped to 11%. According
                                                                                                                       Nominal supply growth
                                                                                                                                                                             to Alphaliner, the nominal global container fleet
                                                                                                                10                                                           will grow by 3.1% in 2019 and 3.5% in 2020.
                                                                                                                     Source: Demand is internal Maersk
                                                                                                                     and supply is Alphaliner.     Global container
                                                                                                                                                   Nominal  capacitydemand
                                                                                                                 8
                                                                                                                     Note: Supply growth continue to                         Freight rates, as measured by the China Com-
                                                                                                                     outgrow demand growth in Q2 2019.
                                                                                                                 6                                                           posite Freight Index (CCFI), were 3.3% higher in
                                                                                                                                                                             Q2 2019 compared to Q2 2018 despite modest
                                                                                                                 4                                                           demand, but partially supported by more idled
                                                                                                                                                                             vessels and a decline in the average number of
                                                                                                                 2
                                                                                                                                                                             voyages (chart 4). Freight rates declined on the
                                                                                                                 0                                                           Asia to North Europe route by 3.3% but strength-
                                                                                                                                                                             ened slightly by 1.3% from Asia to Mediterranean
                                                                                                                -2                                                           Europe. While demand growth was strong from
      2012           2013            2014              2015      2016             2017         2018      2019                                                                Asia to Europe, weekly vessel capacity grew even
      Q2              Q2              Q2               Q2         Q2              Q2                Q2    Q2                                                                 more, by 5.3% in Q2 compared to Q2 2018. Asia to
017    A.P. Moller - Maersk   Interim Report Q2 2019           Directors’ report   Market update

west coast US freight rates increased substan-                 Rotterdam bunker prices rose 2.3% in Q2 com-             Chart 5: USD-EUR exchange rate
tially by 8.8%, while Asia to the US East Coast rose           pared to Q1 2019 but declined 4% compared to
                                                                                                                                                                                                        2019
4.5%. Unlike Asia to Europe, weekly vessel capacity            Q2 2018. The prompt months have experienced
                                                                                                                                                                                                        2018
declined by 0.3% from Asia to North America, sup-              some price strength with destocking of fuel oil                                                                                          2017
porting rates. Uncertainties relating to the strength          inventories as well as global cuts in high sulphur                                                                          1.30

of container demand in 2019 pose a downside risk               crudes from Iran and Venezuela. The bunker                                                                                                          år 2019
                                                                                                                                                                                                     Source: Thomson/
                                                                                                                                                                                           1.25
to freight rates in general.                                   industry is preparing for the IMO 2020 specifica-                                                                                     Reuters.
                                                                                                                                                                                           1.20                    år 2018
                                                                                                                                                                                                     Note: The USD/EUR
                                                               tion shift to fuels with lower sulphur concentra-
                                                                                                                                                                                                     FX remained stable
Time charter rates declined by 18% in Q2 com-                  tion. This leaves the higher sulphur Rotterdam                                                                              1.15                    år 2017
                                                                                                                                                                                                     during Q2 2019.
pared to Q2 2018 but rebounded from Q1 2019 by                 bunker fuel price lower ahead of the adjustment
                                                                                                                                                                                           1.10
7.6%. Rates might rebound further in coming quar-              1 January 2020. In this respect, Q3 2019 Rotter-
ters as the 0.50% sulphur cap on marine fuel from              dam bunker forward prices are 15% lower com-                                                                                1.05
2020 will lead to retrofitting of a significant part           pared to Q2 2019, and the market is pointing to                                                                             1.00
of the global fleet and weighs on the availability             another 13% drop in Q4 over Q3. As demand and
of vessels of +8,000 TEU capacity.                             price are expected to drop for the non-compliant                                                                            0.95

                                                                                                                        Jan   Feb   Mar Apr May Jun   Jul   Aug    Sep   Oct   Nov Dec

Chart 4: Freight rates
                                                                                                                                                                  high sulphur fuel price, the price for lower sul-
Index 1998 = 100                                                                     CCFI 2019
                                                                                                                                                                  phur fuel is, on the other hand, expected to
                                                                                     CCFI 2018
                                                                                     CCFI 2017                                                                    increase, led by higher demand. However, trading
                                                                        1,000                                                                                     of the low sulphur fuel has hardly begun, and it
                                                                                                  CCFI 2019Shipping
                                                                                   Source: CCFI, Shanghai                                                         remains very uncertain how bunker prices for the
                                                                                   Exchange.                                                                      compliant and non-compliant fuels develop in
                                                                           900                    CCFI entered
                                                                                                        2018
                                                                                   Note: Freight rates          2019
                                                                                                                                                                  coming months.
                                                                                   at a higher level than in 2018 but
                                                                                                  CCFI 2017
                                                                                   declined subsequently.
                                                                           800                                                                                    The US dollar appreciated 1.1% against the euro in
                                                                                                                                                                  Q2 2019 compared to Q1 (chart 5). Compared to
                                                                           700                                                                                    Q2 2018, the dollar appreciated by 5.7%, largely
                                                                                                                                                                  reflecting the lift of US interest rates in the first
                                                                                                                                                                  part of 2018.
                                                                           600

Jan   Feb   Mar Apr May Jun           Jul   Aug   Sep   Oct   Nov Dec
018   A.P. Moller - Maersk   Interim Report Q2 2019   Directors’ report   Segment review

             Segment
                 review
              Ocean

              Logistics & Services

              Terminals & Towage

              Manufacturing & Others
019   A.P. Moller - Maersk   Interim Report Q2 2019   Directors’ report   Segment review   Ocean

                                                                                                   Ocean
                                                                                                      Ocean EBITDA increased by 25% to USD 1.1bn
                                                                                                      (USD 856m) with an EBITDA margin of 14.9%
                                                                                                      (12.3%). Revenue increased by 2.9% to USD 7.2bn
                                                                                                      (USD 7.0bn) on the back of a volume increase of
                                                                                                      1.4% to 3,447k FFE (3,399k FFE) along with an
                                                                                                      increase in the average loaded freight rate of
                                                                                                      1.5% to 1,868 USD/FFE (1,840 USD/FFE). Total
                                                                                                      operating costs were largely unchanged as the
                                                                                                      impact from the higher volumes were partly off-
                                                                                                      set by network improvements, including higher
                                                                                                      bunker efficiency, which resulted in a 3.5%
                                                                                                      decrease in the unit cost at fixed bunker. Devel-
                                                                                                      opments in foreign exchange rate impacted the
                                                                                                      revenue negatively and the cost base positively.

                                                                                                      Increases in the freight rates along with matu-
                                                                                                      rity of the network enhancements implemented
                                                                                                      amongst other in connection with the integration
                                                                                                      of Hamburg Süd drove the improvement in the
              Providing customers with an efficient and reliable                                      Ocean profitability. Material improvements in bun-
              experience is essential for Maersk’s growth. Maersk Spot                                ker efficiency impacted the bunker costs positively,
                                                                                                      although partly offset by additional increases in
              is offering transparent prices and loading guarantee while
                                                                                                      the bunker prices versus Q1 2019 as well as Q2
              ensuring higher operational predictability and stronger                                 2018. The total volume growth was below the
              commitments from customers.                                                             market growth, and the weak demand on the Latin
                                                                                                      America, Oceania and North America trades con-
                                                                                                      tinued from Q1 2019. The average loaded freight
                                                                                                      rates increased particularly on Latin America and
                                                                                                      North America trades.
020    A.P. Moller - Maersk   Interim Report Q2 2019     Directors’ report   Segment review     Ocean

                                                                                                                                                                                        Q2
Financial and operational                                volume growth of 0.5%, while North-South was
performance                                              on par with Q2 2018. The intra-Asia trades saw
Revenue increased by 2.9% to USD 7.2bn (USD              increased demand with a growth rate of 14%,
7.0bn), driven by a 2.7% increase in freight revenue     which drove the Intra-regional volume growth
and a 3.8% increase in other revenue mainly due          of 5.4%, as both intra-Americas and intra-Europe
                                                                                                                                                            Key initiatives
to increased slot sales.                                 trades delivered volumes on par with Q2 2018.
                                                         The East-West volume increase was driven by
Volumes increased by 1.4%, mainly driven by Intra-       Europe, impacted by higher demand for refriger-                                                    Maersk launched a new carbon neutral product
regional trades increasing 5.4% and East-West            ated goods in China, while North America trades                                                    with selected Maersk customers, who are highly
                                                                                                                                                            engaged in sustainable solutions for their sup-
                                                                                                                                                            ply chains. The biofuel trial that took place on
                                                                                                                                                            board the Triple-E vessel Mette Maersk during
                                                                                                                                                            Q2 2019 has proven that decarbonised shipping
Ocean highlights                                                                                                                                            solutions can be utilised today. Therefore, the
                                                                                                                                                            carbon-neutral product will be tested in a trial
USD million                                                                       Q2                    6 months    Full year   1 Q2, first six months      with one of Maersk’s customers, the H&M Group.
                                                                                                                                  and full year 2018 are    This will provide the H&M Group with the ability
                                                                  2019          2018¹          2019       2018 ¹       2018¹      presented as if IFRS 16   to reduce their transport and logistics emissions.
Freight revenue                                                  6,336         6,168          12,351     12,148     24,925        had been implemented      Overall, the aim of the project is to unlock the
Other revenue, including hubs                                      814           784           1,728      1,614      3,441        in 2018, for comparison   potential of sustainable fuels to become a com-
Revenue                                                          7,150         6,952          14,079     13,762     28,366        purposes, unaudited.      mercial reality. The learnings will be used to sup-
                                                                                                                                                            port a broader product offering for cost-efficient
Container handling costs                                         2,408         2,440           4,720        4,855     9,481                                 carbon-neutral options for transportation.
Bunker costs                                                     1,210         1,205           2,352        2,399     5,042
Network costs, excluding bunker costs                            1,753         1,729           3,539        3,565     7,053                                 The buying process for the ocean products got
Selling, General & Administrative (SG&A)                                                                                                                    simpler during Q2 for customers with the new
and other costs, etc.                                              730           713           1,463      1,415      3,038                                  Maersk Spot, which allows customers to move
Total operating costs                                            6,101         6,087          12,074     12,234     24,614                                  their cargo in a much simpler and more relia-
Other income/costs, net                                             19            -9             -10        -20         30                                  ble way providing increased sailing visibility and
Profit/loss before depreciation, amortisation                                                                                                               loading guarantee at a fixed price upfront.
and impairment losses, etc. (EBITDA)                             1,068           856          1,995       1,508       3,782
EBITDA margin                                                    14.9%         12.3%          14.2%       11.0%       13.3%                                 The preparation for the new low-sulphur fuel
                                                                                                                                                            regulations starting 1 January 2020 (IMO 2020)
Gross capital expenditure, excl. acquisitions                                                                                                               continues, and the first vessel is currently testing
and divestments (CAPEX)                                            314           549            783         1,623     2,279
                                                                                                                                                            the scrubber solution to prepare for more retro-
                                                                                                                                                            fitting of vessels in the coming quarters.
Operational and financial metrics
Loaded volumes (FFE in ’000)                                     3,447         3,399           6,597        6,619   13,306
Loaded freight rate (USD per FFE)                                1,868         1,840           1,885        1,836    1,879
Unit cost, fixed bunker (USD per FFE incl. VSA income)           1,713         1,776           1,794        1,831    1,808
Hub productivity (PMPH)                                           90.7          78.6            89.2         77.5     80.6
Bunker price, average (USD per tonne)                              436           401             426          391      424
Bunker consumption (tonne in ’000)                               2,777         3,002           5,516        6,131   11,894
Average nominal fleet capacity (TEU in ’000)                     4,110         4,154           4,079        4,192    4,115
Fleet owned (end of period)                                        307           298             307          298      303
Fleet chartered (end of period)                                    409           444             409          444      407
021    A.P. Moller - Maersk   Interim Report Q2 2019      Directors’ report         Segment review   Ocean

were impacted negatively by the trade restric-            The average loaded freight rate increased by            adjusted for this, the average loaded freight rate
tions with China and modest growth in US. The             1.5% to 1,868 USD/FFE (1,840 USD/FFE), driven           increased by 2.8% or 51 USD/FFE.
North-South increase was driven by Africa and             by a 3.5% increase on East-West, driven by North
West and Central Asia trades, partly offset by Latin      America trades mainly on the back of higher             Other revenue increased by 3.8% to USD 814m
America and Oceania declines. The weak demand             freight rates on the Asia-US East Coast trade due       (USD 784m), mainly due to increased number of
seen in Q1 2019 on Latin America trades contin-           to better supply and demand balance and capac-          slot sales, which also increased network costs.
ued into Q2 2019 due to amongst other inventory           ity discipline. This was partly offset by lower rates   Demurrage and detention decreased compared
build-up in previous periods negatively affecting         on Europe trades impacted by increased imbalance        to Q2 2018 and to a more moderate level than
the imports. The Oceania trades were impacted by          between supply and demand, while the North-             previous quarters that was affected by temporary
a slowdown in the Australian economy. Total back-         South increase of 1.3% was driven by headhaul           circumstances from amongst other congestions
haul increased 3.0% mainly on Europe and West             rates on Latin America and Africa trades. The           and front loadings in Q4 2018.
and Central Asia trades, while headhaul increased         loaded freight rates were negatively impacted by
by 0.6%.                                                  the developments in foreign exchange rates and          Total operating costs were unchanged at USD
                                                                                                                  6.1bn (USD 6.1bn), as higher network costs from
                                                                                                                  higher slot charter expenses were partly offset
                                                                                                                  by lower container handling costs and favourable
                                                                                                                  impact on the cost base from the development in
                                                                                                                  foreign exchange rates. Container handling costs
                                                                                                                  decreased by 1.4%, mainly driven by lower empty
                                                                                                                  container positioning costs on the back of fewer
                                                                                                                  empty container moves due to the increased back-
                                                                                                                  haul volumes and more efficient operational exe-
                                                                                                                  cutions. Network costs excluding bunker costs
Loaded volumes                                                                                                    increased by 1.4% due to the higher expenses from
                                                                                                                  an increased number of slots bought from VSA
FFE (’000)                                  Q2 2019    Q2 2018            Change         Change %
                                                                                                                  partners in connection to the optimisation of the
East-West                                    1,093     1,088                   5              0.5%                ocean network. The network optimisation, includ-
North-South                                  1,638     1,632                   6              0.1%                ing increased productivity in the strategic hubs,
Intra-regional                                 716       679                  37              5.4%                resulted in lower hub and transhipment costs and
Total                                        3,447     3,399                  48              1.4%                lower port costs due to a reduced number of calls
                                                                                                                  impacted by the combined network with Hamburg
                                                                                                                  Süd, including improved network utilisation.

Average freight rates                                                                                             The bunker cost was unchanged at USD 1.2bn (USD
                                                                                                                  1.2bn) despite an increase in the average bunker
USD/FFE                                     Q2 2019    Q2 2018            Change         Change %
                                                                                                                  price of 8.5% to 436 USD/tonne (401 USD/tonne),
East-West                                    1,845     1,782                   63             3.5%                as the bunker consumption declined 7.5% mainly
North-South                                  2,092     2,065                   27             1.3%                due to efficiency initiatives, the more efficient
Intra-regional                               1,461     1,485                  -24            -1.6%                newbuild vessels delivered in the past year as
Total                                        1,868     1,840                   28             1.5%                well as from a stable network in Q2 that also
022    A.P. Moller - Maersk   Interim Report Q2 2019        Directors’ report         Segment review   Ocean

impacted schedule reliability positively. Bunker            to Q2 2018 and 3.3% versus Q1 2019. The produc-                                          Average nominal capacity
efficiency improved by 8.1% to 41.7 g/TEU*NM                tivity improved significantly in all hubs compared
                                                                                                                                                                                                                         ’000 TEU
(45.4 g/TEU*NM). Adjusting for the favourable               to last year.
impact from the developments in foreign exchange                                                                                                                                                             4,500
                                                                                                                                                                                                                                       Average n
rates, the operating costs increased by approx.             The unit cost at fixed bunker decreased by 3.5%
                                                                                                                                                                                                             4,250
2.2% on the back of the higher volumes and                  to 1,713 USD/FFE (1,776 USD/FFE) mainly due to
increased number of purchased slots.                        higher volumes, rate of exchange and network                                                                                                     4,000
                                                            improvements including higher bunker efficiency.
Hub productivity continued to improve on the                Adjusting for the developments in foreign exchange,                                                                                              3,750
back of maturity of joint operational initiatives           the unit cost at fixed bunker decreased by 1.6%.
between the terminal and liner operations to                The unit cost at floating bunker was 1,903 USD/                                                                                                  3,500

90.7, equal to an improvement of 15% compared               FFE (1,954 USD/FFE).                                                                       2018     2018    2018    2018      2019        2019
                                                                                                                                                        Q1      Q2       Q3      Q4        Q1          Q2

Fleet overview, end Q2 2019
                                                                                                                                                                                EBITDA improved by 25% to USD 1.1bn (USD 856m),
                                                            TEU                  Number of vessels     Prior to the implementation of IFRS 16,
                                                                                                                                                                                driven by higher revenue and margins. Revenue
                                                                                                       only operating leased vessels were in-
                                            Q2 2019     Q4 2018          Q2 2019            Q4 2018    cluded in the chartered container vessel                                 increased mainly from a mix of higher volumes
Own container vessels                                                                                  section while finance leased vessels were                                and freight rates. The EBITDA margin increased by
                                                                                                       presented together with owned to match                                   2.6 percentage points to 14.9% (12.3%) due to bet-
0 – 2,999 TEU                               116,165      116,287                 58               60
                                                                                                       the classification on the balance sheet.                                 ter rates and volumes on an unchanged cost base
3,000 – 4,699 TEU                           365,351      365,811                 90               90
                                                                                                       With IFRS 16, all leased vessels are gener-
4,700 – 7,999 TEU                           315,164      315,164                 51               51                                                                            but improved by 1.5 percentage points versus Q1
                                                                                                       ally recognised as a right-of-use asset on
8,000 – 11,499 TEU                          463,454      445,754                 52               50                                                                            2019 partly due to normal seasonality between the
                                                                                                       the balance sheet. All leased vessels are
11,500 – 14,999 TEU                          69,018       69,018                  6                6                                                                            quarters and more efficient network.
                                                                                                       included in the table within the chartered
15,000 – 17,499 TEU                         292,282      246,496                 19               16
                                                                                                       container vessel section. Q4 2018 figures
> 17,500 TEU                                593,048      572,480                 31               30
                                                                                                       have been restated.                                                      The average nominal capacity increased to 4,110k
Total                                     2,214,482    2,131,010                307              303
                                                                                                                                                                                TEU in Q2 2019 mainly due to the newbuild deliv-
Chartered container vessels
                                                                                                                                                                                eries from Q1 being fully incorporated into the
0 – 2,999 TEU                               407,973      396,938                193              193
                                                                                                                                                                                fleet. During Q2, two 14k TEU vessels were deliv-
3,000 – 4,699 TEU                           283,189      290,950                 71               74
4,700 – 7,999 TEU                           375,833      326,301                 64               55
                                                                                                                                                                                ered to the fleet, which marks the end of the new-
8,000 – 11,499 TEU                          580,960      615,695                 62               66                                                                            building programme. It is still expected that no
11,500 – 14,999 TEU                         247,644      247,644                 19               19                                                                            new orders of large vessels will take place until
Total                                     1,895,599    1,877,528                409              407                                                                            2020 at the earliest. At the end of Q2 2019, the
Total fleet                               4,110,081    4,008,538                716              710
                                                                                                                                                                                fleet consisted of 307 owned and 409 chartered
Newbuilding programme (own vessels)                                                                                                                                             vessels, and 52k TEU were idle (5 vessels). The idle
3,000 – 4,699 TEU                                  0      7,192                   0                2                                                                            capacity corresponded to 14% of the total idle
> 8,000 TEU                                        0     66,246                   0                4                                                                            capacity in the market.
Total                                              0     73,438                   0                6
023   A.P. Moller - Maersk   Interim Report Q2 2019   Directors’ report   Segment review   Logistics & Services

                                                                                                                  Logistics
                                                                                                                  & Services
                                                                                                                      Logistics & Services reported a revenue of USD
                                                                                                                      1.5bn (USD 1.5bn). Revenue for supply chain man-
                                                                                                                      agement increased while sea and air freight for-
                                                                                                                      warding revenue declined. Gross profit increased
                                                                                                                      by 4.9% to USD 298m (USD 285m), positively
                                                                                                                      impacted by growth in focus areas for intermodal,
                                                                                                                      new warehouse facilities becoming operational
                                                                                                                      during H2 2018 as well as positive contributions
                                                                                                                      from customs house brokerage activity. This was
                                                                                                                      partly offset by lower volumes and margins in sea
                                                                                                                      and air freight forwarding. EBITDA increased to
                                                                                                                      USD 61m (USD 52m).

                Customers want digital, end-to-end
                solutions and the latest commitments                                                                  Intermodal volumes grew slightly, supported
                                                                                                                      by growth in focus markets in Africa and West
                from carriers and port authorities
                                                                                                                      Central Asia regions while supply chain manage-
                to join TradeLens will help Maersk                                                                    ment reported a small volume improvement.
                deliver these.                                                                                        Sea freight decreased due to a decline in overall
                                                                                                                      volumes among some larger customers, while air
                                                                                                                      freight decreased due to soft market in China and
                                                                                                                      reduced volumes for customers within fashion
                                                                                                                      and retail industry.
024    A.P. Moller - Maersk   Interim Report Q2 2019   Directors’ report   Segment review      Logistics & Services

                                                                                                                                                                                          Q2
Financial and operational                              profitable areas as well as positive contributions
performance                                            from customs house brokerage from the Vandegrift
Revenue was unchanged at USD 1.5bn (USD 1.5bn),        acquisition. This was partly offset by lower margins
positively impacted by increasing revenue in sup-      and volumes in sea and air freight forwarding.
ply chain management, offset by declining reve-
                                                                                                                                                               Key initiatives
nue in sea and air freight forwarding. Gross profit    EBITDA increased by USD 9m to USD 61m (USD
increased to USD 298m (USD 285m) supported by          52m), mainly driven by the increase in gross profit
new warehouse facilities becoming operational          and less maintenance cost in Star Air, partly offset                                                    In June, Maersk launched the construction of
during H2 2018, higher intermodal volume in prof-      by cost to integrate Inland services within the                                                         its new cold store facility in St. Petersburg to
itable geographical areas and optimisation of less     logistics and services organisation.                                                                    address the needs of a high-demand Russian
                                                                                                                                                               market. The 3-chamber warehouse will offer
                                                                                                                                                               specialised solutions extending the life cycle
                                                                                                                                                               of perishable goods. The new cold store will
                                                                                                                                                               enable Maersk to offer end-to-end solutions
                                                                                                                                                               to Russian customers. Additionally, automation
                                                                                                                                                               investments are implemented in several ware-
                                                                                                                                                               house facilities to optimise and streamline sort-
                                                                                                                                                               ing processes.
Logistics & Services highlights
                                                                                                                                                               Within the Inland Services portfolio, additional
USD million                                                                     Q2                        6 months     Full year   1 Q2, first six months      capacity was added in Ecuador at the end of Q2
                                                                                                                                     and full year 2018 are    to meet demands from customers in line with
                                                                2019          2018 ¹          2019            2018¹      2018¹       presented as if IFRS 16   service and safety standards. Inland Services
Revenue                                                        1,484         1,489            2,932           2,944      6,082       had been implemented      ceased operations in Antwerp, Belgium, due to
Direct cost                                                    1,186         1,204            2,360           2,391      4,961       in 2018, for comparison   strategic considerations.
Gross profit                                                     298           285              572             553      1,121       purposes, unaudited.
Selling, General & Administration (SG&A)                                                                                                                       The merger of the commercial organisations
and other costs, etc.                                            237           233             460              456        930                                 of Logistics & Services and Ocean progressed
Profit/loss before depreciation, amortisation                                                                                                                  according to plan during Q2 and is on track.
and impairment losses, etc. (EBITDA)                              61            52              112              97        191
EBITDA margin                                                   4.1%          3.5%             3.8%            3.3%       3.1%                                 The integration of Vandegrift Inc., the US-based
                                                                                                                                                               customs brokerage and logistics business
Gross capital expenditure, excl. acquisitions                                                                                                                  acquired to strengthen and broaden the com-
and divestments (CAPEX)                                            29           12              38                20         47
                                                                                                                                                               pany’s service offering to customers, progressed
                                                                                                                                                               according to plan.
Operational and financial metrics, USD million

EBIT conversion (EBIT/gross profit - %)                         9.3            9.4              8.1            8.2         6.8                                 APM Terminals Inland Services was operation-
Supply chain management volumes (’000 cbm)                   17,723         17,672           34,878         34,647      75,309                                 ally integrated into Logistics & Services from
Supply chain management revenue                                 210            194              411            400         867                                 1 August 2019, from previously being in APM
Intermodal revenue                                              647            648            1,280          1,271       2,569                                 Terminals. This will ensure that customers have
Inland services revenue                                         143            154              286            298         595                                 a seamless access to a wider range of logistics
Sea freight volumes (TEU)                                   146,039        156,388          290,956        302,075     639,132                                 and service offerings, enabling reduced com-
Sea freight revenue                                             131            148              277            295         646                                 plexity and service overlaps. Financial reporting
Air freight volumes (tonne)                                  40,136         44,218           72,222         84,377     175,502                                 will not be affected because of this.
Air freight revenue                                             119            147              220            288         608
Other services revenue                                          234            198              458            392         797
You can also read