2019 State of the Forest Report - saskatchewan.ca/environment - Publications Saskatchewan

Page created by Ian Washington
 
CONTINUE READING
2019 State of the Forest Report - saskatchewan.ca/environment - Publications Saskatchewan
State of the Forest Report

2019
saskatchewan.ca/environment
2019 State of the Forest Report - saskatchewan.ca/environment - Publications Saskatchewan
Table of Contents
                    State of the Environment 2019: A Focus on Forests

                    Executive Summary                                                    2

                    Productivity and Resilience
                    Managed forests and greenhouse gas emissions                         9
                    Natural forest disturbance                                          11
                    Deforestation in Saskatchewan                                       14
                    Watershed health within the greater commercial forest               16
                    Cumulative impacts from linear features                             18
                    Regeneration of timber harvest area                                 20
                    Mountain pine beetle detection and prevention                       22

                    Economic and Social Benefits
                    Annual timber harvest                                               24
                    Indigenous involvement in the forest sector                         25
                    Forest sector contributions to the provincial economy               27
                    Economic value of select non-timber forest uses                     29

                    Conserving Biological Diversity
                    Forest type and age                                                 31
                    Protected areas                                                     34
                    Woodland caribou habitat                                            37
                    Genetic conservation of native commercial tree species              39
                    Species at risk in the commercial forest                            41
                    Moose in the provincial forest                                      43
                    Marten populations in the provincial forest                         45

                    Sustainable Forest Management
                    Compliance collection of royalties and forest management fees       47
                    Compliance and enforcement of the forest industry                   48
                    Client services available online and in person                      50
                    Opportunity for stakeholder engagement in forest management planning 51
                    Research and education                                              52
                    Forest licence allocation                                           53
2019 State of the Forest Report - saskatchewan.ca/environment - Publications Saskatchewan
Productivity and resilience
                                                              Measure                                                                     Related 2009 report             Period of assessment
  Indicator          State         Trend      Information      extent      Measure                        Current status                  indicators/measures             and trend measure

  Managed                                                                  Accumulated forest carbon      2016                            Net change in forest            2005-2016
  forests and                                                              stocks by type                 total carbon all types 1,777    ecosystem carbon
  greenhouse gas    mixed/fair     mixed/           partial   provincial                                  mega tonnes                                                     decreasing
  emissions                       no change                     forest

                                                                           Greenhouse gas net             2016                            no                              1990-2016
                                                                           emissions                      0.5 mega tonnes net
                                                              commercial                                  carabon sink                                                    mixed
                                                                forest

  Watershed                                                                Per cent of watershed areas    2017                            Stress rating of watersheds     1987-2017
  health                                                                   in a recently disturbed        equivalent clearcut area        within the provincial forest
                                                              commercial   (harvest or burned) state      averages 17 per cent            associated with regulated       deteriorating
                    mixed/fair     mixed/           partial
                                  no change                     forest                                    (wildfire and harvest)          forestry activities; has been
                                                                                                                                          revised in 2019

  Natural forest                                                           Defoliation from spruce        2017                            Annual area disturbed by        1977-2017
  disturbances                                                             budworm and jack pine          10,189 ha of jack pine          forest pests
                      good         mixed/           partial   commercial   budworm                        budworm                                                         cyclical at low level
                                  no change                     forest

                                                                           Defoliation from forest tent   2017                            Annual area disturbed by        1977-2017
                                                                           caterpillar and large aspen    609,103 ha of forest tent       forest pests
                                                              commercial   tortrix                        caterpillar                                                     cyclical but increasing
                                                                forest

                                                                           Area of abiotic forest         2017                            Annual area disturbed by        2011-2017
                                                                           disturbances                   19,359 ha total flood and       forest pests; has been
                                                              commercial                                  wind damage                     expanded in 2019                mixed
                                                                forest

                                                                           Provincial area burned by      2017                            Annual area burned in the       1999-2017
                                                                           wildfire                       398,997 ha                      commercial forest zone
                                                               province                                                                   relative to the 10 year         mixed
                                                                                                                                          average

  Deforestation                                                            Deforestation by industry      2016                            no                              1970-2016
  in                                                                       type                           1,661 ha provincial total all
  Saskatchewan      mixed/         mixed/           partial    province                                   sources                                                         stable
                     fair         no change

State of the Environment 2019: A Focus on Forests                                  April 2019                                                                                                       2
2019 State of the Forest Report - saskatchewan.ca/environment - Publications Saskatchewan
Measure                                                                        Related 2009 report           Period of assessment
Indicator           State          Trend       Information     extent          Measure                         Current status                indicators/measures           and trend measure

Cumulative                                                                     Kilometers of forest            2017                          no                            benchmark assessment
impacts from
                      ?               ?
                                                                               resource roads constructed      28,257.3 km (all road
linear features    unknown        unknown          partial    commercial       or reclaimed                    classes)                                                    unknown
                                                                forest

                                                                               Kilometers of linear features   ranges from 0 to 36.9         no                            benchmark assessment
                                                                                                               km/km
                                                               provincial                                                                                                  unknown
                                                                 forest

Regeneration                                                                   Early regeneration stocking:    harvest year 2008/09 98 per   Harvest area that has been    2004-05 to 2008-09
of timber                                                                      sufficiently regenerated        cent sufficiently             surveyed and found to be
harvest area         good         improving        partial    commercial       area at establishment           regenerated                   sufficiently regenerated      improving
                                                                forest         survey

                                                                               Free-to-grow assessment:        harvest year 2007/08          Harvest area that meets the   2004-05 to 2008-09
                                                                               sufficiently regenerated        2,391 ha early free-to-grow   sufficiently regenerated
                                                               provincial      area at free-to-grow survey                                   free-to grow standard; but    unknown
                                                                 forest                                                                      nothing to report

Mountain pine                                                                  Monitoring of MPB in the        2018                          no                            2011-2018
beetle                                                                         provincial forest               no presence of MPB in the
detection and        good         improving        partial     provincial                                      provincial forest                                           improving
prevention                                                       forest

                                                                               Number of MPB infested          2018                          no                            2006-2018
                                                              Cypress Hills    trees removed from the          200 trees removed
                                                             Interprovincial                                                                                               mixed
                                                                  Park         Cypress Hills Interprovincial
                                                                               Park

    State of the Environment 2019: A Focus on Forests                                  April 2019                                                                                               3
2019 State of the Forest Report - saskatchewan.ca/environment - Publications Saskatchewan
Economic and social benefits
                                                              Measure                                                                 Related 2009 report           Period of assessment
Indicator           State           Trend       Information    extent      Measure                     Current status                 indicators/measures           and trend measure

Annual timber                                                              Actual annual harvest       2016-17                        Actual volume of timber       1999-2017
harvest                                                                    compared to harvest         3.9 million cubic meters (47   harvested compared to the
                   mixed/fair      improving       adequate   commercial   volume schedule             per cent of provincial         annual allowable cut          mixed
                                                                forest                                 annual allowable cut

Indigenous                                                                 Annual allowable cut        2018-19                        Volume in cubic meters of     2000-01 to 2018-19
involvement in                                                             allocated to Indigenous     28 per cent of provincial      softwood/ hardwood under
the forest                                                    province     businesses                  annual allowable cut           licence to aboriginal owned   improving
                     good          improving        partial
sector                                                                                                                                and/ or partnered forest
                                                                                                                                      industry businesses

                                                                           Indigenous employment in    2017                           no                            2005-2017
                                                                           the forest sector           31 per cent of total
                                                                                                       employment                                                   mixed
                                                              province

Forest sector                                                              Forest products sales and   2017                           no                            1999-2017
contributions                                                              exports                     total sales $1.143 billion
to the               good          improving       adequate   province                                 exports $619 million                                         mixed
provincial
economy
                                                                           Forest sector direct        2017                           Forest sector employment      1999-2017
                                                                           employment                  4,395                          trend since 1999
                                                                                                                                                                    decreased
                                                              province

Economic value                                                             Hunting and fur licence     2017                           Value of non-timber forest-   2008-2017
of select non-                                                             sales                       127,882 all licence types      based services to the
timber forest        good           mixed/         adequate    province                                                               provincial economy            stable
uses                               no change

                                                                           Fishing licence sales       2017                           Value of non-timber forest-   2008-2017
                                                                                                       190,194 all licence types      based services to the
                                                                                                                                      provincial economy            stable
                                                              province

      State of the Environment 2019: A Focus on Forests                            April 2019                                                                                       4
2019 State of the Forest Report - saskatchewan.ca/environment - Publications Saskatchewan
Conserving biological diversity
                                                              Measure                                                                    Related 2009 report             Period of assessment
  Indicator          State         Trend      Information      extent      Measure                         Current status                indicators/measures             and trend measure

  Forest type and                                                          Forest and non-forest land      2019                          Distribution and abundance      2009-2019
  age                                                                      cover types of the provincial   41 per cent softwood forest   of forest types, seral stages
                    mixed/fair     mixed/           partial   provincial   forest                          8 per cent mixedwood          of forest types and wetland     mixed/ no change
                                  no change                     forest                                       forest                      types
                                                                                                           7 per cent hardwood forest
                                                                                                           8 per cent open productive
                                                                                                             forest/shrub
                                                                                                           17 per cent wetland
                                                                                                           17 per cent water
                                                                                                           2 per cent other

                                                                           Forest and non-forest land      2019                          Distribution and abundance      2009-2019
                                                                           cover types of the greater      27 per cent softwood forest   of forest types, seral stages
                                                              commercial                                                                                                 mixed/ no change
                                                                forest     commercial forest zone          10 per cent mixedwood         of forest types and wetland
                                                                                                              forest                     types
                                                                                                           14 per cent hardwood forest
                                                                                                           2 per cent open productive
                                                                                                              forest/shrub
                                                                                                           30 per cent wetland
                                                                                                           14 per cent water
                                                                                                           3 per cent other

                                                                           Forest area in the greater      2019                          Distribution and abundance      2009-2019
                                                                           commercial forest zone by       total forest:                 of forest types, seral stages
                                                              commercial                                                                                                 mixed/ no change
                                                                forest     forest age and type             24 per cent young             of forest types and wetland
                                                                                                           39 per cent immature          types
                                                                                                           15 per cent mature
                                                                                                           10 per cent old
                                                                                                           12 per cent very old

  Protected areas                                                          Per cent of province under      2019                          no                              1919-2019
                                                                           ecological protection           9 per cent                                                    increasing
                    mixed/fair    improving         partial   province

                                                                           Per cent of provincial forest   2019                          Area of the entire provincial   1919-2019
                                                                           under ecological protection     9 per cent                    forest in protected areas by
                                                                                                                                         ecoregion                       increasing
                                                              provincial
                                                                forest

                                                                           Per cent of greater             2019                          Area of commercial forest       1919-2019
                                                                           commercial forest zone          12 per cent                   zone in protected areas for
                                                              commercial                                                                                                 increasing
                                                                forest     under ecological protection                                   each ecoregion, by forest
                                                                                                                                         and wetland types and by
                                                                                                                                         seral stage

State of the Environment 2019: A Focus on Forests                                  April 2019                                                                                                   5
2019 State of the Forest Report - saskatchewan.ca/environment - Publications Saskatchewan
Measure                                                                     Related 2009 report         Period of assessment
Indicator          State           Trend         Information    extent        Measure                       Current status                 indicators/measures         and trend measure

Woodland                                                                      Per cent disturbed            2015                           no                          2010 vs 2015
caribou habitat
                                      ?
                                                                              woodland caribou habitat in   sk2 west: 57 per cent
                  mixed/fair      unknown           partial    boreal plain   the SK2 caribou               sk2 central: 40 per cent                                   establishing benchmark
                                                                exozone       administrative units          sk2 east: 23 per cent

Species at risk
in the
                                      ?                                       Number and status of          2019                           Species classified as       2009-2019
                                                                              species at risk in the        22 federally listed species    endangered, threatened or
commercial        mixed/fair      unknown           partial    commercial     commercial forest                                            special concern that are    unknown due to
forest                                                           forest                                                                    found in saskatchewan's     assessment backlog
                                                                                                                                           commercial forest

Genetic                                                                       Improved and wild seed        2006-2015                      Genetic diversity of        2006-2015
conservation of                                                               planted                       36 per cent of trees planted   reforestation seedlots
native              good          mixed/           adequate    commercial                                   during this period were                                    stable
commercial                       no change                       forest
                                                                                                            from improved seed
tree species

Marten                                                                        Number of marten pelts        2016                           no                          1996-2016
populations in                                                                marketed                      4,165 pelts marketed
the provincial                                                                                                                                                         mixed/stable
                    good       mixed/no change     adequate     provincial
forest                                                            forest

Moose in the                                                                  Moose hunt success in         2017                           no                          2011-2017
provincial                                                                    select wildlife management    moose populations
forest                                                                        zones                         declining in three of six                                  deteriorating
                  mixed/fair    deteriorating       partial    commercial
                                                                 forest                                     WMZs
2019 State of the Forest Report - saskatchewan.ca/environment - Publications Saskatchewan
Sustainable forest management
                                                                  Measure                                                                 Related 2009 report               Period of assessment
  Indicator           State           Trend         Information    extent      Measure                      Current status                indicators/measures               and trend measure

  Compliance                                                                   Forest harvest scaling and   2017-18                       no                                2014-15 to 2017-18
  collection of                                                                dues submission              100 per cent after
  royalties and                                                   provincial   compliance rate              government review                                               stable
                       good          improving        adequate
  forest                                                            forest
  management
  fees

  Compliance                                                                   Number of inspections,       2016-17                       Forest contraventions in the      2009-10 to 2016-17
  and                                                                          number of inspection items   96 per cent compliance rate   last few years, relative to the
  enforcement of     mixed/fair      mixed/            partial    commercial   and compliance rate                                        size of the operations and        stable
  the forest                        no change                       forest                                                                rate of compliance
  industry
                                                                               Number of inspection items   2016-17                       no                                2009-10 to 2016-17
                                                                               and number of observations   186 observations out of
                                                                  commercial                                2,301 items inspected                                           stable
                                                                    forest

                                                                               Number of voluntary          2017-18                       no                                2009-10 to 2017-18
                                                                               compliance opportunities     51 vco's;
                                                                               offered and number of        72 enforcement actions                                          increasing
                                                                  commercial
                                                                    forest     enforcement actions taken

  Client services                                                              Number and type of online    2018                          no                                1999-2018
  available online                                                             tools                        three online tools
  and in person                                                    province                                                                                                 increasing
                       good          improving        adequate

                                                                               Forest related inquires to   2017-18                       no                                2013-14 to 2017-18
                                                                               general inquiry phone line   225 inquiries
                                                                                                                                                                            stable
                                                                   province

  Opportunities                                                                Number of opportunities      2017                          Participation in public           2009-2017
  for stakeholder                                                              provided for public and      167 opportunities             involvement processes
  engagement in        good       mixed/no change     adequate    commercial   stakeholder engagement                                     associated with forest            increasing
  forest                                                            forest                                                                management
  management
  planning

State of the Environment 2019: A Focus on Forests                                     April 2019                                                                                                   7
2019 State of the Forest Report - saskatchewan.ca/environment - Publications Saskatchewan
Measure                                                    Related 2009 report            Period of assessment
Indicator           State           Trend         Information    extent      Measure                      Current status   indicators/measures            and trend measure
Research and                                                                 Annual ministry forest       2017-18          Investment in forest           2013-14 to 2017-18
education                                                                    education expenditures       $78,275          research and forest
                     good          improving         partial                                                               education                      mixed
                                                                 province

                                                                             Annual ministry forest       2017-18          Investment in forest           2013-14 to 2017-18
                                                                             research expenditures        $679,129         research and forest
                                                                 province                                                  education                      improving

Forest licence                                                               Per cent of the commercial   2018             Area and percentage of the     2016
allocation                                                                   forest under long term       61 per cent      commercial provincial forest
                   mixed/fair   mixed/no change     adequate    commercial   tenure                                        under long-term tenure         mixed
                                                                  forest

                                                                             Per cent of the commercial   2018             Area and percentage of the     2016
                                                                             forest under short term      39 per cent      commercial provincial forest
                                                                commercial   tenure                                        under short-term tenure        mixed
                                                                  forest

    State of the Environment 2019: A Focus on Forests                                April 2019                                                                                8
2019 State of the Forest Report - saskatchewan.ca/environment - Publications Saskatchewan
Managed forests and greenhouse gas emissions

                                                                                                                                    ·   Saskatchewan's forests
                                                                                                                                        contribute to climate
                                                                                                                                        change mitigation and
                                                                                                                                        resilience, through
                                                                                                                                        sustainable harvest
                                                                                                                                        practices and management
                                                                                                                                        of fire, insects and disease.

 Greenhouse gas (GHG) emissions are a measure of forest health and its relationship to climate change.
 Positive emission scores indicate the forest is a source of GHGs and negative emission scores indicate
 that the forest is a sink for GHGs. If the forest acts as a GHG sink, it is healthy and growing. If the forest is
 acting as a source of GHG emissions, it may be over-mature, dying and in decay.

 What’s happening

                             State                          Trend                   Information                       Extent

                           mixed/fair                  mixed/no change                     partial              commercial forest

 What we are doing
 The National Forest Carbon Monitoring System estimates forest carbon stocks, changes in carbon
 stocks and emissions of greenhouse gases in managed land and forests. These estimates are based on
 data from Saskatchewan's forest inventories, growth and yield tables, disturbance monitoring and
 management activities. The ministry monitors the rate of change in carbon stock and emissions in the
 forest ecosystem using the federal carbon budget model.

 The forest ecosystem contains carbon stock which includes above-ground biomass (i.e. trees), below-
 ground biomass (i.e. live roots), deadwood, litter and organic soil matter. Carbon quantities change
 over time due to tree growth, which adds to the carbon stock. Losses from the carbon stock occur
 through decomposition, natural disturbances (e.g. wildfire and insects) and forest harvesting. Forest
 carbon storage is the total amount of carbon contained in all the components of the forest ecosystem
 at a given time. This analysis is only representative of the managed forests in Saskatchewan and does
 not include the far northern part of the provincial forest. There are few human activities in the far north
 and a general lack of information on forest carbon in this part of the province.

Accumulated forest carbon stocks by type

                    2,000
                    1,800
                                                                                                                    2005
megatonnes carbon

                    1,600
                    1,400                                                                                           2010
                    1,200
                                                                                                                    2016
                    1,000
                     800
                     600
                     400
                     200
                      0
                             above ground   below ground   deadwood        litter   soil         total carbon

                                                            carbon stock

The net carbon stock in the managed forest declined by 37 megatonnes (Mt) of carbon, or two per cent,
between 2005 to 2016. The difference is a relatively small reduction in Saskatchewan's total forest
carbon stocks and is primarily the result of forest fires. The carbon losses from fire include the
consumption of trees and dead organic matter. Insect damage and an increase in the annual forest
harvest also contributed to losses of carbon stock.

                    State of the Environment 2019: A Focus on Forests                                  April 2019                                               9
Saskatchewan greenhouse gas emissions and carbon sinks related to land use,
land-use changes and the forestry sector                                    -

                  4

                  3

                  2
megatonnes CO₂e

                  1

                  0

                  -1

                  -2

                  -3

                  -4

                  -5
                       1990          1995               2000                 2005                 2010         2015

                                 ecological and anthropogenic processes            harvested wood products
                                                            net emissions (sink)

 Saskatchewan's managed forests have been a relatively small greenhouse gas sink, averaging net
 stocks of 0.50 megatonnes annually. Forest greenhouse gas emissions come from physical disturbances
 which include harvesting and land use changes (not a significant factor in Saskatchewan), as well as
 natural processes such as growth and decay. Significant natural disturbances such as wildfire, insects
 and disease are not included in this analysis of greenhouse gas emissions. As indicated in two graphs
 above, depending on the accounting system used, Saskatchewan's forests could be considered a small
 source or a small sink.

 Harvested wood products, including the use and disposal of products (e.g. paper, lumber, etc.), and
 forest conversion activities are considered a source of emissions. This is consistent with the reporting
 criteria established by the United Nations Framework Convention on Climate Change. For more
 information on how greenhouse gas sources and carbon sinks are calculated for forests in Canada, visit
 the Government of Canada.

Why it matters
A forest is considered to be a carbon sink if it absorbs more carbon from the atmosphere than it
releases. The forest stores a significant amount of greenhouse gases in the form of carbon, the building
blocks of plants and trees. An increase in stored, or sequestered, forest carbon can indicate a healthy
forest in which the growth exceeds the loss of carbon to human and natural disturbances. Over-mature
forests become sources of emissions as they start to die and decay. Managing forest age through
sustainable planning and harvest practices is an important part of emissions management.

Carbon in the form of trees provides the raw material for the forest industry. Healthy forests that
sequester carbon also provide a sustainable supply for the forest industry. In Saskatchewan, timber
harvest levels are well below the sustainable limit, which means that carbon stocks are not impacted by
this type of disturbance.

Managing the provincial forest to balance growth while maximizing a sustainable harvest is an
important part of mitigating climate change. Death and decay can reach the point where wood
supplies and the quality of trees begin to decline, making harvest and commercial utilization
unsustainable. Low timber harvest levels can also contribute to aging forests.

Underutilized, aging forests are vulnerable to fire, insects and disease. Across Canada, the area burned
by forest fires is expected to double by the end of the century, releasing large quantities of carbon.
Changes to temperature and moisture can contribute to damage from insect and disease and impact
forest growth rates. These variables all impact the forest’s ability to be a significant carbon sink over
time. Visit Natural Resources Canada for more information.

                                                                                                                      Last updated: January 2019 (data lags two years due to
                                                                                                                      availability)
                                                                                                                      Update frequency: every two years
                                                                                                                      Source: Forest Service Branch, Ministry of Environment
                                                                                                                      Keywords: carbon, climate change, sink, greenhouse
                                                                                                                      gas, emission
                                                                                                                      References:
                                                                                                                      Canadian Council of Forest Ministers. 2006. Criteria and
                                                                                                                         indicators of sustainable forest management in
                                                                                                                         Canada, national status 2005. Ottawa, Ontario. 154
                                                                                                                         pp.
                                                                                                                      Canadian Forest Service. 2018. Unpublished data –
                                                                                                                         Carbon Budget Model (CBM-CFS) results from
                                                                                                                         Canadian Forest Service 2018 national inventory
                                                                                                                         report (NIR) databases.
                                                                                                                      Environment and Climate Change Canada. 2018.
                                                                                                                         National Inventory Report 1990-2016: Greenhouse
                                                                                                                         Gas Sources and Sinks in Canada. Ottawa, Ontario.
                                                                                                                         228 pp. https://unfccc.int/documents/65715
                                                                                                                      Kurz, W.A., Dymond, C.C., White, T.M., Stinson, G., Shaw,
                                                                                                                         C.H., Rampley, G.J., Smyth, C., Simpson, B.N., Neilson,
                                                                                                                         E.T., Trofymow, J.A., Metsaranta, J., Apps, M.J., 2009.
                                                                                                                         CBM-CFS3: a model of carbon-dynamics in forestry
                                                                                                                         and land-use change implementing IPCC standards,
                                                                                                                         Ecological Modelling 220: 480-504.
                                                                                                                      Kurz, W.A., G. Stinson, G.J. Rampley, C.C. Dymond and
                                                                                                                         E.T. Neilson, 2008, Risk of natural disturbances makes
                                                                                                                         future contribution of Canada's forests to the global
                                                                                                                         carbon cycle highly uncertain. Proceedings of the
                                                                                                                         National Academy of Sciences, 105: 1551-1555.

                      State of the Environment 2019: A Focus on Forests                           April 2019                                                               10
Natural forest disturbance

                                                                                                                                                 ·   Compared to natural
                                                                                                                                                     disturbances such as
                                                                                                                                                     wildfire and insect damage,
                                                                                                                                                     forest harvesting is a
                                                                                                                                                     relatively small landscape
                                                                                                                                                     disturbance within
                                                                                                                                                     Saskatchewan's
                                                                                                                                                     commercial forest zone.
                                                                                                                                                 ·   The largest disturbance
                                                                                                                                                     type in the commercial
                                                                                                                                                     forest zone is from native
                                                                                                                                                     insects and diseases.
                                                                                                                                                 ·   A 10,000-hectare wildfire in
                                                                                                                                                     the commercial forest
Natural disturbances such as fire, wind, flood, insects and disease outbreaks are an important part of                                               burns roughly enough
the natural life cycle of forests, especially the boreal forest. These disturbances change the environment                                           wood to build almost
by changing the amount and distribution of forest stand types across the landscape, diversify the age                                                10,000 homes.
class distribution of forest stands and facilitate the renewal of the forest.                                                                    ·   Large wildfires have been
                                                                                                                                                     the norm in the boreal
                                                                                                                                                     forest for thousands of
What’s happening                                                                                                                                     years. On average, a given
                                                                                                                                                     area of forest will burn
              State                               Trend                           Information                             Extent                     every 70 years in natural
                                                                                                                                                     boreal systems.
                                                                                                                                                 ·   Every year, about half of
                                                                                                                                                     Saskatchewan wildfires are
                                                                                                                                                     started by human activity.
                                                                                                                                                     These include campfires,
                                                                                                                                                     industrial activity, clean-up
              good                        mixed/no change                             partial                      entire province*                  projects that get away,
                                                                                                                                                     vehicle and ATV exhaust
                                                                                                                                                     and arson.
What we are doing
Disturbances influence forest structure, composition and function and are important in maintaining
biological diversity, forest dynamics and regeneration. Sustainable forest management is successful
when management strategies emulate natural processes. The ministry conducts annual aerial surveys
to monitor insects, diseases and weather events that cause major forest disturbances to assess the
health of Saskatchewan's forest.

The three main natural native insect disturbance agents tracked by aerial survey across the commercial
forest and select provincial parks* are spruce budworm, jack pine budworm and forest tent caterpillar.
Other damaging agents monitored during the annual aerial surveys include:

·     eastern larch beetle;
·     spruce beetle;
·     aspen leaf spot disease;
·     large aspen tortrix
·     spruce needle rust; and
·     abiotic damage from wind, floods and drought.

Survey extent for insect and abiotic disturbances

                                                 commercial forest
                                                 select provincial and national parks

*The survey extent for insects, diseases and abiotic disturbances includes the commercial forest, Prince Albert National Park, Lac La Ronge
Provincial Park, Meadow Lake Provincial Park, Great Blue Heron Provincial Park, Narrow Hills Provincial Park, Greenwater Lake Provincial Park,
Duck Mountain Provincial Park and Cypress Hills Provincial Park.

Spruce budworm, jack pine budworm, forest tent caterpillar and large aspen tortrix are all cyclic in their
outbreak behaviour. Generally, populations of these insects increase and reach outbreak levels within
expected and predictable timeframes. These pests feed on tree foliage and may cause tree mortality
after repeated annual attacks during outbreaks.

The spruce budworm cycle is relatively long, and peak outbreaks are expected to occur roughly 35
years apart. A spruce budworm outbreak that peaked in 2002 poses no current threat to sustainable
forest management.
Defoliation from spruce budworm and jack pine budworm 1977 to 2019

                           1.00

                           0.75
Millions of Hectares

                           0.50

                           0.25

                             -

                                                      Spruce budworm             Jack pine budworm

     Hardwood defoliation is primarily caused by forest tent caterpillar cycles approximately every 10 to 12
     years, with outbreaks lasting three to five years. The pattern has been quite regular with outbreaks
     occurring in 2001 to 2007 and again from 2013 to 2017. The outbreak in the early 2000s was not aerially
     mapped (and does not appear on the graph below); however, disturbed areas are documented in a
     separate report produced by BioForest Technologies in 2015. The current outbreak that reached a peak
     in 2017 has now generally collapsed throughout the province.

    Defoliation from forest tent caterpillar and large aspen tortrix 1977 to 2019

                           1.00
    Millions of hectares

                           0.75

                           0.50

                           0.25

                             -                                                          n/a n/a

                                                            forest tent caterpillar       large aspen tortrix

     Along with fire, insect and disease disturbances, physical (abiotic) disturbances including drought,
     flooding and extreme wind events result in tree mortality which leads to stand-level and landscape-
     level changes in the forest ecosystem. Abiotic disturbances shape forest structure, composition and
     function and also contribute to maintaining a biologically diverse and healthy forest. It is only more
     recently that abiotic disturbances are being monitored at the same time as the insect and disease aerial
     survey. Although more recently, areas have been affected by drought, events such as blowdown and
     flooding are the more prevalent cause of abiotic disturbances.

    Area of abiotic forest disturbances 2011 to 2019

                           25000

                           20000

                           15000
hectares

                           10000

                            5000

                                                                       No data
                                  0
                                      2011   2012   2013      2014      2015     2016   2017      2018   2019

                                                    Flood       Wind       Drought

     The boreal forest ecosystem is driven by natural disturbances. Boreal species have evolved over time to
     cope with, and even require, periodic disturbance as part of their natural life cycles. Forest fires are a
     natural part of the forest ecosystem. The area burned from year to year varies and is significantly
     affected by weather. Autumn and spring rains and winter snowfall will significantly reduce wildfires and
     limit their spread.

     While the number and size of catastrophic wildfires in some North American jurisdictions has increased
     over the last five years, 20 years of available data do not show any statistically significant increasing
     trend in Saskatchewan.

     The Saskatchewan Government uses modern systems and has dedicated resources to help promote
     FireSmart principles, monitoring fire starts and the suppression of wildfires. Wildfires that threaten
     human life and communities are always the government's top priority, followed by protection of critical
     public infrastructure, major industrial infrastructure, commercial timber, remote structures and natural
     resources. Wildfires in low-value timber areas and non-commercial northern forests are considered for
     initial attack and sustained action based on an assessment of values and estimated financial cost, with
     the intent to allow some wildfires to act as a necessary and natural process on the landscape.
Saskatchewan area burned by wildfire 1999 to 2008

                                 2,000,000
                                 1,800,000
                                 1,600,000
                                 1,400,000
                                 1,200,000
hectares

                                 1,000,000
                                  800,000
                                  600,000
                                  400,000
                                  200,000
                                         0
                                               1999    2000    2001       2002   2003    2004       2005   2006   2007       2008
                                                      Total area burned           10-year average

 Saskatchewan area burned by wildfire 2009-2018

                                 2,000,000
                                 1,800,000
                                 1,600,000
                                 1,400,000
                                 1,200,000
hectares

                                 1,000,000
                                   800,000
                                   600,000
                                   400,000
                                   200,000
                                         0
                                              2009    2010    2011     2012      2013   2014    2015       2016   2017   2018

                                                      Total area burned           10-year average

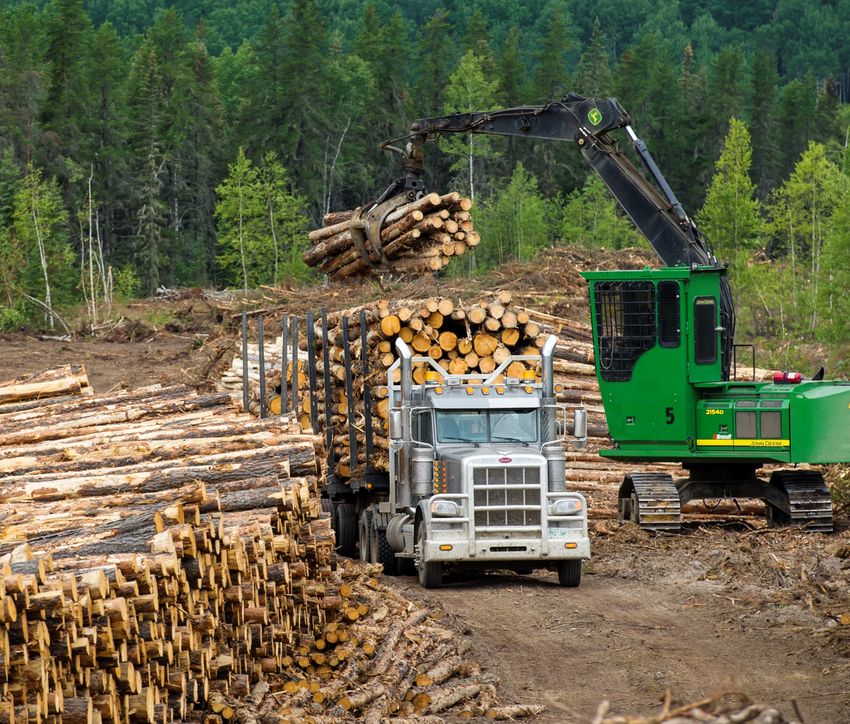
  Forest harvesting for commercial use of timber products is a human disturbance impacting an average
  of 16,330 hectares per year between 2009 and 2018. On average, less than a quarter of one percent
  (0.21 per cent) of forested lands within Saskatchewan's commercial forest zone are harvested each year.
  Forest managers work to ensure timber harvesting resembles natural forest disturbance patterns. In the
  commercial forest zone, wildfires are the second largest disturbance type, with approximately 128,370
  hectares burned per year on average between 2009-2018. The largest disturbance type in the
  commercial forest zone was from insects at 253,739 hectares per year on average during the same
  period.

   Area harvested (commercial forest)

                                   35
Area harvested (thousand ha)

                                   30

                                   25

                                   20

                                   15

                                   10

                                    5

                                    0
                                        1999 2000 2001 2002 2003 2004 2005 2006 2007 2008 2009 2010 2011 2012 2013 2014 2015 2016 2017 2018

                                                        Total area harvested       10-year average

 Commercial forest zone disturbance by harvest, wildfire and insects 1999 to 2018
                                 1.0
 Disturbance area (million ha)

                                 0.8

                                 0.6

                                 0.4

                                 0.2

                                 0.0
                                    1999 2000 2001 2002 2003 2004 2005 2006 2007 2008 2009 2010 2011 2012 2013 2014 2015 2016 2017 2018

                                                   timber harvest           wildfire (commercial forest)           insects

   The stress on forest ecosystems caused by natural disturbances such as wildfire and native insects and
   diseases are still within the range of what can be considered normal. The level of abiotic disturbance is
   not a concern at this time. The area of forest being harvested is well within sustainable limits.
Why it matters
All natural disturbance types are unpredictable and can have a significant effect on sustainable forest     Last updated: February 2020
management. While natural disturbances are essential to forest health and renewal, they can have a          Update frequency: annually
negative impact on communities and businesses that reside in or rely on forests. Wildfires threaten         Source: Forest Service Branch, Ministry of Environment
human safety, property and infrastructure, and smoke often becomes a public health concern. All             Keywords: disturbance, insect, disease, wildfire, wind,
natural disturbances can damage and reduce the supply of timber and impact the socio-economic               frost, flood, harvest
well-being of communities and citizens.                                                                     References:
                                                                                                            BioForest Technologies, 2015. Services to aid in
Although these disturbances are natural forces shaping the boreal forest, there is a need to maintain       monitoring and assessing forest health in Crown forests
and protect forests and other values found within the forest. There is a cost to deploying resources to     in Saskatchewan - 2015 Final Report. Consultant's report
protect the forest from wildfire and insects and diseases, and there is a cost to lost timber for forest    to Saskatchewan Ministry of Environment Forest Service
products. Unpredictable disturbances create uncertainties in terms of forest product availability, and      Branch. 95 pp.
can have a significant effect on sustainable forest management.
                                                                                                            2008 Wildfire Statistics (internal report). Saskatchewan
The provincial forest management planning standard requires the owner of a forest management plan           Ministry of Environment
to describe how the risks of natural disturbances including fire, insects, diseases and wind could affect
the timber supply. Forest management plans must be revisited when the projected sustainable timber          2018 Wildfire Statistics (internal report). Saskatchewan
targets and other management objectives over the planning period are no longer achievable due to            Ministry of Environment
natural disturbance.
                                                                                                            Natural Resources Canada. 'The State of Canadas Forests
                                                                                                            Annual Report 2017.

                                                                                                            Wildfires in Saskatchewan infographic
Deforestation in Saskatchewan

                                                                                                              ·   Canada's deforestation rate
                                                                                                                  is among the lowest in the
                                                                                                                  world. Canada's 348 million
                                                                                                                  hectares of forest
                                                                                                                  represents nine per cent of
                                                                                                                  the world's forest cover but
                                                                                                                  accounts for only 0.3 per
                                                                                                                  cent of global
                                                                                                                  deforestation.
                                                                                                              ·   Over the last 10 years, the
                                                                                                                  provincial rate of
                                                                                                                  deforestation has remained
                                                                                                                  fairly constant at 1,700
                                                                                                                  hectares per year.

Deforestation is the permanent conversion of forests to other land uses through human activity. The
loss of forest area through deforestation reduces biodiversity, decreases wildlife habitat and impacts
soil and water quality. Increasing forest area through afforestation helps to offset these losses. Canada's
deforestation rate is among the lowest in the world.

What’s happening
          State                      Trend                      Information                     Extent

        mixed/fair             mixed/no change                     partial                 entire province

What we are doing
Monitoring deforestation provides a means of tracking land conversion, trends and assessing human
impacts on ecosystem health. Understanding the rate of deforestation also supports the federal target
to cut forest loss in half by 2020, and reduce net deforestation to zero by 2030.

Afforestation was not measured during this reporting period. However, afforestation activities in
Saskatchewan include planting agriculture lands with trees for shelterbelts and agroforestry purposes.

Deforestation in Saskatchewan is primarily calculated by extracting provincial data from summaries
supplied by the National Deforestation Monitoring System (NDMS) of Natural Resources Canada.
Supplemental information about larger disturbances in the north was incorporated to calculate the
total provincial deforested area.

Deforestation by industry type                             Deforestation by all other industries (detail)

                                                                             oil and gas peat
                                                                                  0.6%   0.2%
                                                          hydroelectric
                                                              0.7%
                                            all other
                                           industries
                                              7%
                                                                                                   forestry
      agriculture                                                                                   2.1%
         93%                                         built-up
                                                       0.9%

                                                                mining
                                                                 1.1%
                                                                                       transportation
                                                                                            1.5%

   Natural disturbances such as wildfire, and human-caused disturbances such as harvesting, do
            not result in deforestation because a new forest will grow back in its place.
Deforestation by industry type

           16,000

           14,000

           12,000

           10,000
hectares

            8,000

            6,000

            4,000

            2,000

               0
                1970         1975       1980       1985          1990    1995       2000   2005   2010   2015

                    agriculture        forestry         transportation   built-up

                       hydroelectric      oil and gas          mining     peat

Most of the deforestation in Saskatchewan between 1970 and 2016, about 314,495 hectares (94 per
cent), can be attributed to agricultural practices. This deforestation occurrs within the Prairie and the
Boreal Plain ecozones. Agriculture-related deforestation in these ecozones has decreased significantly
since 1970, to 1,299 hectares per year in 2016.

The greatest amount of deforestation in a single ecozone has occurred in the Boreal Plain. While most
commercial forest activities occur within this ecozone, agriculture has been the primary cause of
deforestation. Since 1970, an estimated 213,544 hectares have been deforested within this ecozone,
accounting for 63 per cent of the overall area deforested in Saskatchewan. Deforestation rates in the
Boreal Plain have significantly declined in the past decade, down to 1,246 hectares per year in 2016,
and are expected to continue on a downward trend.

Urban and industrial development make up 17,122 hectares (3.5 per cent) of deforestation in the
province. This includes: transportation, hydroelectric infrastructure and reservoirs; oil and gas; mining;
and recreational, industrial, institutional and commercial development.

The forestry sector's contribution to deforestation is limited to the construction of permanent access
roads. All area harvested is required to be reforested, and is surveyed to confirm that regrowth is
occurring at the rate expected. The majority of forest access roads are temporary and are reclaimed
(brought back to forest). The remaining permanent access roads account for two per cent of the overall
deforestation in Saskatchewan between 1970 and 2016.

Peat harvesting represents a small fraction of deforestation in Saskatchewan, with typical levels of less
than 30 hectares per year. Recent environmental impact assessments indicate a renewed interest in
peat mining projects within the provincial forest. The annual deforestation levels expected from these
new developments are not likely to exceed normal amounts.

Why it matters
The annual rate of deforestation across the entire province has drastically declined since the 1970s and
has remained fairly constant in the last 10 years at 1,721 hectares per year. It is important that
deforestation is limited in the provincial forest to ensure a sustainable forest industry with wildlife
habitat protection, ecosystem stability and carbon storage.

Forests in Saskatchewan are important for recreation and tourism opportunities, provide raw materials
to the forest industry and host mining and oil and gas industries, all of which are important
contributors to the provincial economy. The conversion of forested land for agriculture, mining, forest
roads and other industrial use provides economic opportunities for residents of Saskatchewan, but
must be managed in a sound and sustainable manner to help ensure the long-term use and function of
the provincial forest.
                                                                                                                Last updated: January 2019
                                                                                                                Update frequency: every five or 10 years
                                                                                                                Source: Forest Service Branch, Ministry of Environment
                                                                                                                Keywords: deforestation, industry, reclaim,
                                                                                                                afforestation
                                                                                                                References:
                                                                                                                Dyk, Andrew. 2018. Deforestation Mapping in
                                                                                                                Saskatchewan.

                                                                                                                National Forest Inventory (NFI). 2016.
                                                                                                                https://nfi.nfis.org/en/.

                                                                                                                Natural Resources Canada. 2017. The State of Canada's
                                                                                                                Forests: Annual Report 2017.

                                                                                                                United Nations. 2014. Forests Action Statements and
                                                                                                                Action Plans.

                                                                                                                United Nations Framework Convention on Climate
                                                                                                                Change. 2013. Afforestation and Reforestation Projects
                                                                                                                under the Clean Development Mechanism: A Reference
                                                                                                                Manual.

                                                                                                                World Resources Institute. Global Forest Watch.
                                                                                                                https://www.globalforestwatch.org.
Watershed health within the greater commercial forest

                                                                                                                                               ·   On average, the impacts of
                                                                                                                                                   harvest and wildfire in the
                                                                                                                                                   greater commercial forest
                                                                                                                                                   account for an annual
                                                                                                                                                   clearcut equivalent of 17
                                                                                                                                                   per cent.

Forest disturbance from timber harvesting or wildfire may impact aquatic environments by increasing
soil erosion, stream flow and nutrient loading through watershed systems.

What’s happening

             State                               Trend                                  Information                   Extent

                                                                                                              greater commercial
          mixed/fair                     mixed/no change                                  partial                forest zone*

*The greater commercial forest zone includes the commercial forest zone, Cold Lake Air Weapons Range and federal and provincial parks within
and adjacent to the commercial forest zone.

What we are doing
Equivalent clearcut area (ECA) is a measure of the relative loss and recovery of hydrologic function for a
forest canopy. Hydrologic function concerns the condition of water, including the quality, the quantity,
when and how quickly water moves through a watershed. Typically, the greater the ECA, the greater
the potential for changes to the natural hydrology of an area.

Experimental watershed studies indicate that flow increases are minimized when the equivalent
clearcut area is limited to no more than 20 to 25 per cent in aspen-dominated watersheds, and 30 per
cent in coniferous dominated watersheds. Hardwood forest stands can take up to 15 years, and
softwood forests 35 years, to regain full evapo-transpiration and interception capacity following the
harvest of cutblock.

Of the 29 watersheds in Saskatchewan, nine are found within Saskatchewan's greater commercial
forest zone. Within those nine watersheds, 36 sub-watersheds intersect the commercial forest zone.

Saskatchewan watersheds

                                                 Tazin River
                                                 Kasba Lake
                                                 Lake Athabasca
                                                 Black Lake
                                                 Athabasca River
                                                 Reindeer River / Wollaston Lake
                                                 Churchill River
                                                 Beaver River
                                                 North Saskatchewan River
                                                 Saskatchewan River
                                                 Battle River
                                                 Carrot River
                                                 Lake Winnipegosis
                                                 Eagle Creek
                                                 Quill Lakes
                                                 Upper Qu'Appelle River
                                                 South Saskatchewan River
                                                 Moose Jaw River
                                                 Wascana Creek
                                                 Lower Qu'Appelle River
                                                 Assiniboine River
                                                 Cypress Hills North Slope
                                                 Swift Current Creek
                                                 Old Wives Lake
                                                 Milk River
                                                 Poplar River
                                                 Big Muddy Creek
                                                 Upper Souris River
                                                 Lower Souris River
                                                 watershed
                                                 sub-watershed
                                                 greater commercial forest zone*

                                              *includes Cold Lake Air Weapons Range
                                                and adjacent provincial/federal parks

         State of the Environment 2019: A Focus on Forests                                            April 2019                                                     16
As of 2017, the equivalent clearcut area across the greater commercial forest zone averaged 17 per cent
when wildfire and harvest area were considered. For the three preceding 10-year periods (2007, 1997
and 1987), equivalent clearcut area averaged 12 per cent, 12 per cent, and 5 per cent, respectively.

As of 2017, of the 36 sub-watersheds in the greater commercial forest zone, all but eight were below
the 20 per cent equivalent clearcut area threshold for flow increases. Five of these eight sub-
watersheds had the majority of their area outside of the commercial forest zone. In these cases, it is
difficult to assess the true equivalent clearcut area because data for the majority of these sub-
watersheds is incomplete.

The three remaining sub-watersheds had equivalent clearcut areas above the 20 per cent threshold
and may actually see increases in flows. These three sub-watersheds are found within the Churchill
River watershed and the Saskatchewan River watershed. In all of these cases, wildfire was the greatest
contributor to equivalent clearcut areas. Harvesting contributed one per cent or less to the overall
equivalent clearcut area.

The equivalent clearcut area in the greater commercial
forest zone: harvested and wildfire areas

             Athabasca
             River
                                                               2017

                                    Churchill River
         1

                                                                                          Equivalent clearcut area
                                                                                          (wildfire and harvest combined)
                                                                                               < 1%
         Beaver River
                                                                                               1% - 5%
                                                              Saskatchewan River
                                                                                               6% - 10%
                                                                                               11% - 15%
                                                                                               16% - 20%
                                North
                         Saskatchewan River            Carrot River
                                                                        Lake                   21% - 25%
                                                                        Winnipegosis
                                            South                                              > 25%
                                        Saskatchewan
                                            River                                              watershed
                                                                      Assiniboine River
                                                                                               sub-watershed

        2007                                                   1997                                    1987

When forest harvest disturbances are considered on their own, equivalent clearcut area is considerably
less. As of 2017, the equivalent clearcut area within the greater commercial forest zone averaged two
per cent when the harvest area alone was considered. For the three preceding 10-year periods (2007,
1997, and 1987), equivalent clearcut area averaged two per cent, two per cent and one per cent,
respectively. Of the 36 sub-watershed within the commercial forest zone, none exceeded a 10 per cent
equivalent clearcut area.

Roads and water crossings were not considered in this analysis, though they are an important forest
disturbance. Currently, year of construction and year of reclamation data for roads within the
commercial forest zone is incomplete.

Why it matters
The impacts of wildfire suppression strategies and the occurrence of large and frequent wildfires in
recent years are apparent in the northern reaches of the commercial forest zone. For the 10-year period
ending in 2017, sub-watershed equivalent clearcut areas show an increasing trend as one moves
northward towards the commercial forest zone's northern boundary. This trend is less pronounced
when the equivalent clearcut area is considered for 10-year periods ending in 2007, 1997, and 1987.

When wildfire and harvest areas are combined, the watershed health trend appears to be deteriorating
based on an equivalent clearcut area analysis. As of 2017, the equivalent clearcut area within
Saskatchewan's greater commercial forest zone averaged 17 per cent when wildfire-burned and
harvested areas were considered. However, when harvest areas alone are considered, the watershed
health trend appears to be more stable based on this equivalent clearcut area analysis. As of 2017, the
equivalent clearcut area within Saskatchewan's greater commercial forest zone averaged two per cent
when harvested areas alone were considered. This indicates that forest harvest practice, in the greater
commercial forest zone, is consistently below the industry threshold of 20 per cent equivalent clearcut
area. This implies that forestry harvest practices are a low threat to the natural flow within these
watersheds.

                                                                                                                              Last updated: January 2019
                                                                                                                              Update frequency: every 10 years
                                                                                                                              Source: Forest Service Branch, Ministry of Environment
                                                                                                                              Keywords: hydrology, equivalent clearcut area,
                                                                                                                              nutrients, erosion, stream flow
                                                                                                                              References:

                                                                                                                              SMLP (Saskfor MacMillian Limited Partnership). 1997.
                                                                                                                              Twenty-year Forest Management Plan and
                                                                                                                              Environmental Impact Statement for the Pasquia-
                                                                                                                              Porcupine Forest Management Area.

   State of the Environment 2019: A Focus on Forests                                                             April 2019                                            17
Cumulative impacts from linear features

                                                                                                                ·   There are 28,257 km of class
                                                                                                                    1, 2 and 3 forest roads
                                                                                                                    identified within the
                                                                                                                    commercial forest. That's
                                                                                                                    three times the length of
                                                                                                                    the Canada-United States
                                                                                                                    border, the longest
                                                                                                                    international border in the
                                                                                                                    world.

Understanding current disturbance levels within the provincial forest is important for assessing the
cumulative impacts of human-caused disturbances. The ministry is establishing a baseline
measurement of non-permanent and permanent linear features such as roads, transmission lines,
railways, seismic lines, cut-lines and firebreaks in the provincial forest.

What’s happening
          State                       Trend                    Information                    Extent

            ?                           ?
     new indicator -             new indicator -                                          provincial and
      no baseline                  no trend                       partial               commercial forest

What we are doing
Cumulative impacts are changes in an environment caused by multiple human activities and natural
processes across space and over time. In addition to documenting linear features in an area, it is
important to track road construction and reclamation by forestry licence holders. More stringent
management of construction and reclamation activities will reduce the disturbance footprint of non-
permanent and permanent roads associated with a variety of developments.

High levels of linear features in an area may require higher levels of mitigation to manage new
development, and a greater need to reclaim features to maintain landscape integrity. The ministry is
currently working on a mitigation framework that will determine how to reduce cumulative impacts in
Saskatchewan. The economic impact to industry development in regions with a high linear density
needs to be evaluated.

As a condition of their operating plans, forest licensees are required to reclaim forestry road access
associated with forest harvest activities. The kilometres of forestry road access (class 1, 2 and 3 roads)
constructed and reclaimed annually is used as base information for future road construction and
reclamation activity reporting.

 Forest resource roads constructed or reclaimed up to March 31, 2017, in the commercial forest
                       Road Class                                 Length (km)
                       Class 1: forest resource road                   872
                       Class 2: improved bush road                   3,496
                       Class 3: bush road                           23,890

Linear feature density in the provincial forest
Linear feature density in the provincial forest is the total length of line features per square kilometre.
Linear features include roads, trails, transmission lines, railways, seismic lines, cut-lines and firebreaks.

       State of the Environment 2019: A Focus on Forests                      April 2019                                             18
Linear feature density in the provincial forest (km/km )

                                                                                0 - 0.43
                                                                                0.43 - 1.74
                                                                                1.74 - 3.91
                                                                                3.91 - 16.93
                                                                                16.93 - 36.91

Why it matters
Disturbances within the forest may have an impact on timber and non-timber values. Increased road
and trail access can increase recreational opportunities for the community, but also increase access to
the forested areas for other users. Disturbance levels can indicate levels of commercial or non-
commercial forest use as well as indicate an amount of disturbance within ecosystems. Disturbances
affect the amount and quality of habitat available for different forest species.

Measuring linear feature density on a landscape is important because linear features can result in forest
loss, fragmentation and degradation. Linear density is a common measurement of cumulative impacts
across different ecosystems and jurisdictions, and is tracked over time.

Anecdotal evidence suggests that recreational use of Saskatchewan forests increases where roads are
available. Forest users have reported reduced wildlife sightings in areas where they also reported
increased numbers of hunters using forest access roads.

                                                                                                            Last updated: March 31, 2017
                                                                                                            Update frequency: every five years
                                                                                                            Source: Cumulative Impacts Branch, Ministry of
                                                                                                            Environment
                                                                                                            Keywords: linear, cumulative, corridor, density,
                                                                                                            reclamation
                                                                                                            References:
                                                                                                            Environment Canada. 2012. Recovery strategy for the
                                                                                                            woodland caribou, boreal population (Rangifer tarandus
                                                                                                            caribou) in Canada. Species at Risk Act Recovery Strategy
                                                                                                            Series. Environment Canada, Ottawa, ON. xi+138 pp.

                                                                                                            Learner, J. 2018. Review of cumulative effects
                                                                                                            management concepts and international frameworks.
                                                                                                            Prepared for Government of Canada, Ottawa, ON.
                                                                                                            http://www.tc.gc.ca/eng/review-cumulative-effects-
                                                                                                            management-concepts-international-frameworks.html

     State of the Environment 2019: A Focus on Forests                     April 2019                                                                    19
Regeneration of timber harvest area

                                                                                                                     ·   Ninety-five per cent of the
                                                                                                                         area harvested from
                                                                                                                         2004-05 to 2008-09 is
                                                                                                                         sufficiently re-stocked with
                                                                                                                         healthy growing trees.

 An important indicator of long-term forest productivity and sustainable forest management practices is
 the area of harvested forest land that is sufficiently regenerated according to a measurable standard.
 Forests that are regenerated successfully are essential to a long-term sustainable flow of wood
 products and ecosystem productivity.

 What’s happening

                     State                   Trend                      Information                     Extent

                     good                  improved                       partial                commercial forest

 What we are doing
 Every major licensee (forest management agreement and area-based term supply licence holders) that
 harvests forest products in the province has a legal obligation to ensure that the licence area has also
 been renewed.

 Regeneration assessments provide assurance that the achievement of the desired forest condition is
 likely. There are two timeframes when regeneration is assessed:

 1.           Establishment: four to seven years post-harvest; and

 2.           Free-to-grow: eight to 14 years post-harvest.

 The area harvested does not always match the area surveyed by year of harvest because of the
 changing sources of the harvest and survey data. The area harvested is reported by industry within 18
 months of the harvest activity being completed. While every effort is made to ensure the data sets are
 correct at time of reporting, there can be discrepancies. The reporting time period includes harvest
 years 2004-05 to 2008-09 because this is the most complete data available from industry.

Sufficiently regenerated area at establishment survey
(four to seven years post-harvest)

            30,000

            25,000

            20,000
area (ha)

            15,000

            10,000

             5,000

                0
                      2004-05           2005-06               2006-07               2007-08             2008-09
                       harvested        sufficiently regenerated         not sufficiently regenerated

 The establishment surveys show that the forest industry is on track to maintain a sustainable forest
 industry based on the results of the establishment surveys. The amount of area reported as not
 sufficiently regenerated (NSR) at establishment for the reported time period is five per cent.

 Forest companies are required to re-treat any NSR areas that they report, and it is expected that the
 NSR reported at establishment would be sufficiently regenerated (SR) by the free-to-grow (FTG) survey.
 It is also expected that if a block is SR at establishment it will continue to be SR at FTG. There are a
 number of reasons why this may not be the case. A block that was SR at establishment may experience
 an insect infestation that can cause a plantation failure, a fire may destroy a regenerating area, ungulate
 browsing can damage recent growth on trees and cause them to be under-height at FTG, and excessive
 drought or flooding can lead to plantation failure.

            State of the Environment 2019: A Focus on Forests                          April 2019                                               20
Sufficiently regenerated area at free-to-grow survey
(eight to14 years post-harvest)

            30000

            25000

            20000
area (ha)

            15000

            10000

            5000

              0
                     2004-05       2005-06       2006-07             2007-08   2008-09
                                 harvested      early free-to-grow

 The forest regeneration assessment standard applies to blocks harvested after 2004 and the first free-
 to-grow surveys were completed by industry in 2018. These datasets will be submitted to government
 for review and audit and presented for this indicator in the future. The blocks that have met the free-
 to-grow stocking and height requirements at the establishment survey stage (four to seven years post-
 harvest) are presented above.

 Why it matters
 Successful regeneration of harvested areas is an important indicator of anticipated long-term forest
 productivity and sustainable forest management practices.

                                                                                                           Last updated: November 2018
                                                                                                           Update frequency: annually
                                                                                                           Source: Forest Service Branch, Ministry of Environment
                                                                                                           Keywords: regenerated, not sufficiently regenerated,
                                                                                                           planting, free-to-grow,
                                                                                                           References:
                                                                                                           http://publications.gov.sk.ca/documents/66/86809-
                                                                                                           Forestper cent20Regenerationper
                                                                                                           cent20Assessmentper cent20Chapter.pdf
                                                                                                           http://publications.gov.sk.ca/documents/66/86845-
                                                                                                           Forestper cent20Regenerationper
                                                                                                           cent20Assessmentper cent20Standard.pdf

                   State of the Environment 2019: A Focus on Forests            April 2019                                                             21
Mountain pine beetle detection and prevention

                                                                                                              ·   Mountain pine beetles
                                                                                                                  prefer lodgepole pine but
                                                                                                                  can attack and kill all the
                                                                                                                  pine species found in
                                                                                                                  Canada.
                                                                                                              ·   Mountain pine beetles
                                                                                                                  affect pine trees by laying
                                                                                                                  eggs under the bark. The
                                                                                                                  beetles introduce a blue
                                                                                                                  stain fungus into the
                                                                                                                  sapwood that prevents the
                                                                                                                  tree from repelling and
                                                                                                                  killing the attacking
                                                                                                                  beetles. If you see lumber
The mountain pine beetle (MPB) is the most significant pest of pine forests in North America. MPB can             with blue stains, it may
colonize and kill jack pine trees, posing a threat to pine forest ecosystems and sustainable                      have been salvaged from
development of the forest industry in Saskatchewan and across Canada.                                             an MPB infested stand.
                                                                                                              ·   Mountain pine beetles can
                                                                                                                  survive very cold
What’s happening                                                                                                  temperatures, down to -
                                                                                                                  40°C. Mild winters and
          State                      Trend                   Information                   Extent                 warm summers contribute
                                                                                                                  to the spread of mountain
                                                                                                                  pine beetle.

          good                     improving                    partial                entire province

What we are doing
Since crossing the Rocky Mountains in two mass dispersal events in 2006 and 2009, MPB has spread
into lodgepole pine/jack pine forest ecosystems in central and eastern Alberta where the beetle had
not been found before. Monitoring and early detection of the presence and severity of insect and
disease conditions in the forest helps ensure timely detection and response.

It is anticipated that eastward spread rates could increase significantly in the near future due to recent
policy changes in Alberta. Alberta announced in 2018-19 that protecting key watersheds along the
eastern stages of the Rockies and protecting endangered species would take priority over slowing the
eastern spread of MPB. This could allow spot infestations along the eastern edge of Alberta to establish
and spread, leaving boreal jack pine forests in Saskatchewan and the rest of Canada vulnerable to
invasion by MPB.

Large populations of MPB that have been building in western Alberta (Jasper and Hinton) may spread
east, increasing the possibility that large populations could build in the Swan Hills area of Alberta. That
would mean mountain pine beetle could easily spread into east-central Alberta and Saskatchewan's
northwest boreal forest.

MPB surveillance is conducted in the boreal northwest and in Cypress Hills Interprovincial Park. The
ministry conducts ground-based monitoring in highly susceptible jack pine forests in the northwest
boreal forest. Between 2011 and 2017, the ministry established a network of helicopter landing and
tree baiting sites to improve access and capacity to detect the leading edge of MPB infestation in the
boreal forest. Tree-bait sites are established in 57 areas where highly susceptible pine exists, north and
south of the Cold Lake Air Weapons Range in northwest Saskatchewan.

       Survey and monitoring data support a framework that is crucial to the integrity of a long-
      term forest health management plan for Saskatchewan. The measure for MPB in the boreal
         forest is currently its presence or absence. Currently, no MPB have been detected in the
                                           boreal monitoring area.

Mountain pine beetle is a natural component of the lodgepole pine forest ecosystem in Cypress Hills
Interprovincial Park, and is being actively managed through aerial and ground surveys. All lodgepole
pine stands within Cypress Hills Park (Centre Block and West Block), and adjacent forested non-Crown
lands which border the park (excluding the jurisdiction of Alberta) are surveyed. If beetles are found,
surveyors expand their search area in a circle around infested trees, to locate all the trees attacked in
the current year.

Once infested trees are found and marked, the next step is a quick and aggressive response. The most
effective control method is to find the beetle-infested trees in fall and winter months, then cut them
down and burn them before the beetles can leave and spread into the forest in the late spring.
Number of MPB trees controlled in Cypress Hills Provincial Park, 2006-2019

600

500

400

300

200

100

  0

                     West block      Centre block        ag-lease land

Why it matters
Forestry is the second largest industry in Saskatchewan's north. The forest industry depends on a
sustainable supply of forest products. On average, one third to one half of all softwood manufactured
in Saskatchewan annually is jack pine. In 2017, Saskatchewan's Ministry of Energy and Resources
reported more than $1 billion in forest products sales, with the industry supporting nearly 8,000 direct
and indirect jobs. Losses of pine inventory will interrupt long-term sustainable wood supply to mills,
resulting in reduced mill productivity, manufacturing and ultimately job loss.

The MPB outbreak in British Columbia infested over 18 million hectares and killed 731 million cubic
metres, or 54 per cent, of the province's merchantable lodgepole pine. Those losses impacted forest-
dependent communities.

Many of Saskatchewan's most visited provincial parks (Cypress Hills, Meadow Lake, La Ronge, Narrow
Hills, Candle Lake and Makwa Lake) have large pine forests that, if killed by the beetle, would have
serious implications on visitation, experience and public safety from increased fire risk and unsafe forest
conditions (i.e. dead and falling trees).

The beetle has been designated under The Forest Resources Management Act, which makes the import,
transportation and storage of pine logs and pine forest products with bark attached originating from
British Columbia, Alberta and the United States illegal.

                                                                                                              Last updated: February 2020
                                                                                                              Update frequency: annually
                                                                                                              Source: Forest Services Branch, Ministry of Environment
                                                                                                              Keywords: mountain pine beetle, lodgepole, jack pine,
                                                                                                              invasive
                                                                                                              References:
                                                                                                              The Mountain Pine Beetle: A synthesis of Biology,
                                                                                                              Management, Impacts on lodgepole pine. 2006. Safranyik
                                                                                                              and Wilson
                                                                                                              Eds.https://www.for.gov.bc.ca/hfd/library/documents/bib
                                                                                                              96122.pdf
                                                                                                              Natural Resources Canada. Mountain pine beetle (Fact
                                                                                                              sheet) https://www.nrcan.gc.ca/forests/fire-insects-
                                                                                                              disturbances/top-insects/13397.
                                                                                                              Nelson, M.F., Ciochina, M. and Bone, C. 2016. Assessing
                                                                                                              spatiotemporal relationships between wildfire and
                                                                                                              mountain pine beetle disturbances across multiple time
                                                                                                              lags. Ecosphere. Vol 7 (10) 2016.
                                                                                                              https://doi.org/10.1002/ecs2.1482
You can also read