Mapping Economic, Behavioural and Social Factors within the Plastic Value Chain that lead to Marine Litter in Scotland - Commercial fishing gear ...
←
→
Page content transcription
If your browser does not render page correctly, please read the page content below
Mapping Economic, Behavioural and
Social Factors within the Plastic Value
Chain that lead to Marine Litter in
Scotland
Commercial fishing gear report

The Scottish Government
September 2019
Document prepared for
Client               The Scottish Government

Document prepared by:
Consultant name      George Cole
Job Title            Senior Consultant

Co-authors           Bernie Thomas, Bethan Jones, Sarah Hargreaves, Kate Chambers, Katie Powell, Howard Walker

Document checked by:
Name                 Bernie Thomas
Title                Principal Consultant
Signed

Acknowledgments
Our thanks to all the organisations and individuals that contributed to the research via interviews, workshops and
ongoing conversations. Special thanks to The Scottish Government project team and the project steering group for
their support and guidance in this research.

Commercial confidentiality
This report has been produced by Resource Futures Ltd on behalf of Marine Scotland in accordance with the terms
and conditions of appointment dated 19th February 2019. Whilst Resource Futures Ltd has taken all due care to
interpret and collate the information presented within the report, any third party relying on the results of the analysis
shall do so at their own risk and neither Resource Futures or Marine Scotland shall be liable for any loss or damages
arising there from.

Factors within the Plastic Value Chain that lead to Marine Litter | Commercial fishing gear report

Executive Summary
Aims and approach
In the context of growing public concern around marine litter and a fast moving policy landscape of
measures to address marine litter and plastic waste, this research sought to understand opportunities
within the plastic value chain to help tackle marine litter. The factors and decisions that lead to marine
litter in Scotland were researched with a focus on four products that are not fully addressed by current or
planned marine litter and plastics waste policy measures. These four product categories were:
    1.   Commercial fishing gear
    2.   Crisps, snack and sweet wrappers
    3.   Artificial grass pitch
    4.   Menstrual products

The research findings are presented in six documents as follows:
    1.   Summary report
    2.   Commercial fishing gear
    3.   Crisps, snack and sweet wrappers
    4.   Artificial grass pitch
    5.   Menstrual products
    6.   Literature review
This document is the Commercial fishing gear report. Key findings for are introduced below.
Recommendations are presented for the Scottish Government. The recommendations presented have
different potential efficacy, costs and timescales, and to some degree the likely impact is related to the
resources and support invested in any single measure.

Commercial fishing gear
The first product group, commercial fishing gear, was researched in detail. It is commonly found in marine
litter surveys and is particularly harmful in entangling wildlife. It can be lost accidentally or intentionally
dumped at sea, although some stakeholders dispute whether the latter is widespread practice or happens
at all in Scotland. The marine litter pathways and key decision points in the value chain to help tackle
marine litter are illustrated in Figure E1. The findings are mapped against stages in the product life cycle,
shown as grey boxes and described down the left hand side of the figure. Key decision points explored in
this research are highlighted in yellow. Respective business models were also identified as potential key
decision points, e.g. adopting reuse and circular economy business models. However, these are not
highlighted and explored in detail in this research due to a lack of examples to draw upon.

Resource Futures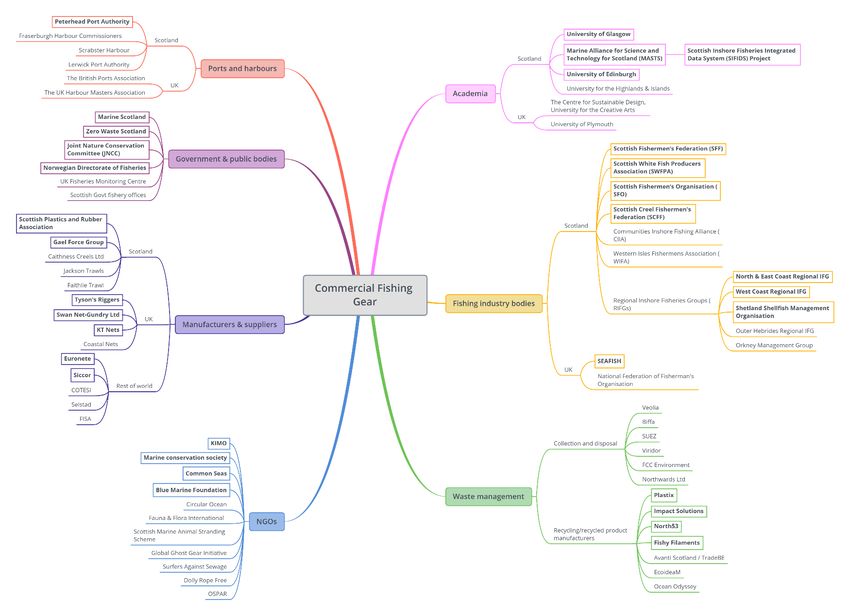
Factors within the Plastic Value Chain that lead to Marine Litter | Commercial fishing gear report

Figure E1: Commercial fishing gear - Marine litter pathways and key decision points

A driver commonly raised by commercial fishing gear stakeholders is the effort required and cost of waste
management, especially since other than nylon nets they have little or no recoverable value at present.
Potential solutions focussed largely on communications and awareness raising across the supply chain and
ensuring the waste retains some value or otherwise an incentive to manage it responsibly is provided. The
quantity and type of gear purchased and the waste generated is a major knowledge gap, and mandatory
reporting on this would be a valuable first step in implementing extended producer responsibility (EPR), as
required by EU legislation in the Single-Use Plastics Directive. This information would help direct further
measures to address marine litter. Supporting best-practice behaviours and new technology can also help
reduce losses. Wider opportunities may be brought about by systems thinking and business model
development, including design for end of life and even recovery of lost gear, or product service system
innovation to address marine litter issues.
Table E1 presents an analysis of where potential solutions may have the most influence in relation to key
decision points shown in Figure E1. Solutions will have varying degrees of impact, which will also be
affected by their design and implementation. Recycling would aim to reduce the cost and effort to fishers in
handling waste gear. Similarly, the 100% indirect fee would mean that waste costs are covered by harbour
fees paid at a flat rate irrespective of the quantity of waste delivered. Gear marking and tagging can help in
tracking and recovering lost gear and inform enforcement should this be progressed. Several forms of EPR
are assessed.

Resource Futures
Factors within the Plastic Value Chain that lead to Marine Litter | Commercial fishing gear report

Table E1: Commercial fishing gear - where solutions can most influence key decision points

                                                                                                                                  modulated fee

                                                                                                                                                  return scheme
                                         Education and

                                                                     100% indirect

                                                                                     Gear marking

                                                                                                    EPR takeback

                                                                                                                   EPR advance
                                          engagement

                                                                                                                   disposal fee

                                                                                                                                                   EPR deposit
                                                                                      and tagging
                                                         Recycling

                                                                                                      scheme
 Life cycle         Key decision

                                                                                                                                      EPR
                                                                         fee
 stage              point

 Production         Bespoke
 and                product
 Retail &           design and           ✔               ✖           ✖               ✖              ✔              ✖              ✔               ✖
 distribution       purchase

                    Recovery
 Use                effort for lost      ✔               ?           ✔               ✔              ✔              ✔              ✔               ✔
                    gear

                    Waste
 End of             management
 life/Recovery      of large             ✔               ?           ✔               ✖              ✔              ✔              ✔               ✔
                    items

✔ = Yes, ✖ = No, ✔ = Yes - if solution designed with this in mind, ? = Unknown

On the basis of the research findings, the following recommendations are made for the Scottish
Government and the private sector to tackle marine litter from commercial fishing gear:
    1. Support education and engagement measures. Priority areas are engaging fishers on waste
       management options and the impacts of marine litter. Also advice on life cycle costs of more
       durable, repairable equipment to influence their procurement and design.
    2. Evaluate feasibility and efficacy of EPR, recycling, and other waste management options
           a. Mandate reporting of products placed on market, and data on the collection and treatment
               of waste
           b. Understand current (baseline) waste management costs to fishers
           c. Evaluate EPR options for fishing gear
           d. Research recycling enablers and conduct cost-benefit analysis
           e. Gather industry views on 100% indirect fee, EPR and recycling measures in a combined
               consultation
    3. Support best-practice and new technology
Recommendation 2 suggests evaluating the feasibility and effectiveness of EPR, recycling, and other waste
management options as further work is needed to understand if they will be effective, how best to design
to prevent marine litter and, in the case of recycling, how it will be funded.

Resource Futures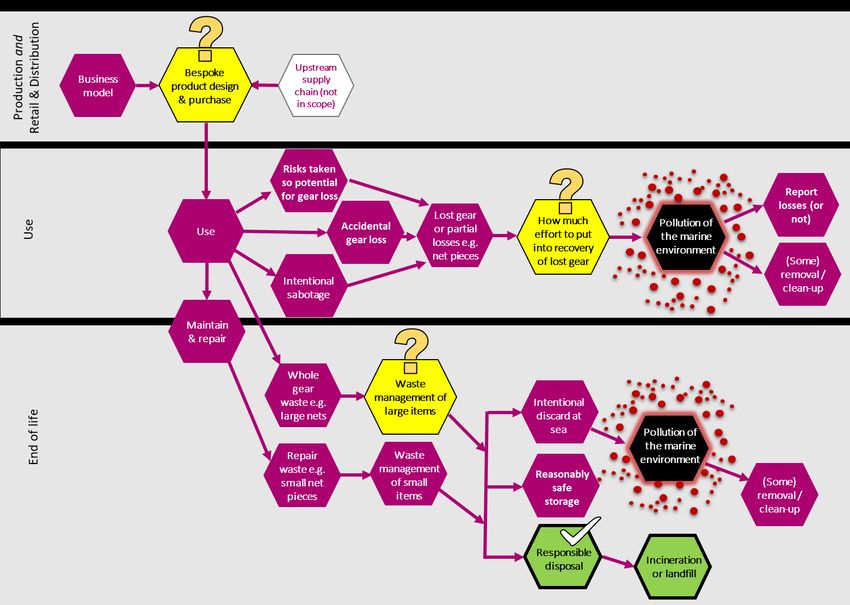
Factors within the Plastic Value Chain that lead to Marine Litter | Commercial fishing gear report
Contents
1 Introduction .................................................................................................................................... 1
2 Methodology................................................................................................................................... 1
3 Introduction to product and marine litter issue ............................................................................... 3
4 Value chain and stakeholder engagement ....................................................................................... 3
4.1 Value chain ............................................................................................................................................... 3
4.2 Stakeholder engagement ......................................................................................................................... 7
5 Marine litter pathways and key decision points ............................................................................... 9
6 Drivers and barriers ....................................................................................................................... 10
6.1 Bespoke product design and purchase decision ....................................................................................11
6.2 Waste management of large items ........................................................................................................14
6.3 Recovery effort for lost gear ..................................................................................................................17
7 Potential solutions ........................................................................................................................ 20
7.1 Education and engagement ...................................................................................................................22
7.2 Waste management ...............................................................................................................................25
7.2.1 Recycling ....................................................................................................................................... 25
7.2.2 100% indirect fee ......................................................................................................................... 28
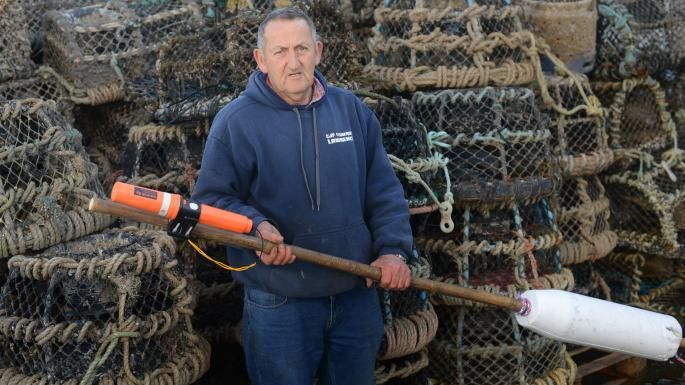
7.3 Gear marking and tagging ......................................................................................................................28
7.4 Extended producer responsibility ..........................................................................................................31
7.5 Other measures ......................................................................................................................................37
8 Recommendations ........................................................................................................................ 40
9 Comparable products .................................................................................................................... 42
Key organisations in the value chain for Scotland ............................................................. 44
Workshop activities .......................................................................................................... 45
Commercial fishing gear public survey results ................................................................... 47
Tables
Table 1: Commercial fishing gear - Mapping actors within the value chain onto life cycle stages ................... 4
Table 2: Commercial fishing gear - where solutions can most influence key decision points ........................ 21
Table 3: Desired effect of education and engagement on key decision points .............................................. 24
Table 4: Desired effect of recycling on key decision points ............................................................................ 27
Table 5: Desired effect of 100% indirect fee on key decision points .............................................................. 28
Table 6: Desired effect of promoting gear marking and tagging on key decision points ................................ 31
Table 7: Desired effect of an advance disposal fee on key decision points .................................................... 32
Table 8: Desired effect of a takeback scheme on key decision points ............................................................ 33
Resource Futures
Factors within the Plastic Value Chain that lead to Marine Litter | Commercial fishing gear report

Table 9: Desired effect of EPR modulated fee on key decision points ............................................................ 34
Table 10: Desired effect of DRS on key decision points .................................................................................. 34
Table 11: Recommendations to address marine litter from commercial fishing gear .................................... 41
Table 12: Commercial fishing gear - Key organisations in manufacturing and supply .................................... 44
Table 13: Commercial fishing gear workshop attendees ................................................................................ 46

Figures
Figure 1: Outline of research framework                                                                                                   2
Figure 2: Example of creel pot                                                                                                            5
Figure 3: Examples of commercial fishing gear used in Scotland                                                                            6
Figure 4: Commercial fishing gear – Stakeholder mapping                                                                                   8
Figure 5: Commercial fishing gear - Marine litter pathways and key decision points                                                      10
Figure 6: Decision point - bespoke product design and purchase decision                                                                 11
Figure 7: Drivers and barriers in bespoke product design and purchase decision                                                          12
Figure 8: Decision point - waste management of large items                                                                              15
Figure 9: Drivers and barriers in waste management of large items                                                                       15
Figure 10: Decision point - recovery effort for lost gear                                                                               18
Figure 11: Drivers and barriers in recovery effort for lost gear                                                                        19
Figure 12: Recovered Fishing Gear                                                                                                       23
Figure 13: SAFEGEAR electronic fishing gear marker                                                                                      30
Figure 14: Survey Q9- Before this survey, were you aware of the issues of lost fishing gear/marine plastics
linked to the fishing industry? (n=521)                                                                     39
Figure 15: Facebook advert publicising the ghost fishing gear survey                                                                    47
Figure 16: Fish Q1- How often do you eat fish? (n=942)                                                                                  49
Figure 17: Fish Q3- Please rank the following decision drivers in order of importance when purchasing fish
(1 being the lowest importance, 6 being the highest importance) (n=558)                                   50
Figure 18: Fish Q5- Please rank these sustainability factors in order of how important you think they are
when purchasing fish (1 being the lowest importance, 6 being the highest importance) (n=558)              50
Figure 19: Fish Q7- Which of the following issues do you think are currently included in these sustainability
accreditations for fish? (Please tick all that apply) (n=558)                                               51
Figure 20: Fish Q8- If the risk of lost and discarded fishing gear from fishing activities is not already included
in sustainability standards and accreditations, how important would it be to include it?                        51
Figure 21: Fish Q9- Before this survey, were you aware of the issues of lost fishing gear/marine plastics
linked to the fishing industry? (n=521)                                                                                                 52
Figure 22: Fish Q10- What percentage more would you be willing to pay for your fish to ensure the fishing
methods didn’t contribute to marine plastics? (n=521)                                                    52

Resource Futures
Factors within the Plastic Value Chain that lead to Marine Litter | Commercial fishing gear report

Figure 23: Demographics of fish survey respondents Q1-What is your age? (n=521)                          53
Figure 24: Demographics of fish survey respondents Q2- What gender do you identify with? (n=486)         53
Figure 25: Demographics of fish survey respondents Q3- What is your current employment status? (n=486)
                                                                                                     54
Figure 26: Demographics of fish survey respondents Q4- How many dependants do you have? (n=486)          54
Figure 27: Demographics of fish survey respondents Q5- How far away from the coast do you live to the
nearest mile? (n=486)                                                                                 55
Figure 28: Demographics of fish survey respondents Q6- Thinking about recycling household waste, which
of these statements best describes how important recycling is to you personally? (n=486)              55
Figure 29: Demographics of fish survey respondents Q7- Which of these statements best describes your
attitude to recycling? (n=486)                                                                       56
Figure 30: Demographics of fish survey respondents Q8- Which of these statements best describes how
much you recycle? (n=486)                                                                           56
Figure 31: Fish Q5- Please rank these sustainability factors in order of how important you think they are
when purchasing fish (1 being the lowest importance, 6 being the highest importance) (n=558)              57

Resource Futures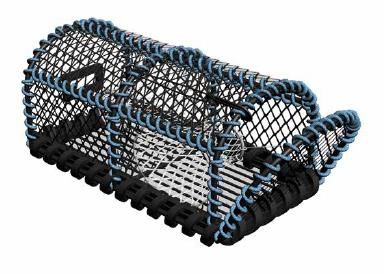
Factors within the Plastic Value Chain that lead to Marine Litter | Commercial fishing gear report

1         Introduction
Whilst there is significant activity on reducing marine litter in Scotland, there are some products
which cause marine litter that are not fully addressed by current activities. The aim of this research
study was to identify these problem products and investigate opportunities throughout the value
chain to tackle marine litter issues, with Government support or interventions where necessary.
The research findings are presented in six documents: an overarching summary and discussion, a
separate report for each of the marine litter product groups researched in detail, and a literature
review. The list of six report documents is as follows:
     1.    Summary report
     2.    Commercial fishing gear
     3.    Crisps, snack and sweet wrappers
     4.    Artificial grass pitch
     5.    Menstrual products
     6.    Literature review
This document is the Commercial fishing gear report and is structured as follows:
     •     Methodology - section 2
     •     Introduction to product and marine litter issue - section 3
     •     Value chain and stakeholder engagement - section 4
     •     Marine litter pathways and key decision points - section 5
     •     Drivers and barriers - section 6
     •     Potential solutions - section 7
     •     Recommendations - section 8
     •     Comparable products - section 9

2         Methodology
Over the product life cycle, materials and products pass through multiple actors in the Scottish
economy, from raw materials extraction and product manufacturing to the point when products are
discarded and recycled or disposed of. The pathways a specific product takes are dictated by
decisions taken by the actors in the value chain. This raises an important question: why do some
products become marine litter, i.e. what decisions have been made and by whom, throughout the
product’s value chain, that result in ‘leakage’ into the marine environment? To answer this question,
it is necessary to understand decision making in the value chain. Whilst actors may already be aware
of marine litter issues and may want to address them, there may be barriers or more dominant
drivers that dictate how key decisions are currently made. With an understanding of key decision
points in the value chain it is possible to consider how potential solutions can affect decision making
to help tackle marine litter. This is the basis of the research framework used in this study, as
summarised in Figure 1. The research framework is reflected in the structure of this report and
referred to throughout.

Resource Futures | Page 1
Factors within the Plastic Value Chain that lead to Marine Litter | Commercial fishing gear report

Figure 1: Outline of research framework

The framework above outlines the approach taken within the research. To gather this information to
inform the study, research activities were conducted in four stages:
     1.   Scoping study
     2.   Literature review
     3.   Interviews and workshops
     4.   Public survey
Products made from bioplastics were considered out of scope in this research. Research and
innovation in material science is leading to the development of many new polymers marketed as
biodegradable plastics. However, there is ongoing debate over the efficacy of these polymers to
biodegrade in the marine environment over short enough timescales to reduce the impacts of
marine litter. This is a complicated subject worthy of a dedicated research project, and so was
considered outside the scope of this study to assess. Instead, the research scope starts after
polymerisation at the point in the value chain where plastic products, or semi-finished products, are
manufactured.
The main product life cycle stages are used as the structure for value chain analysis, to represent and
understand the sources of marine litter, marine litter pathways and key decision points within the
value chain. This enables a clear and consistent structure for analysis and comparison between
products that have different value chains and marine litter pathways. The stages in the product life
cycle described in this research are:
    • Raw materials
    • Production
    • Retail & distribution
    • Use
    • End of life/recovery
Further details on the methodology and engagement approach are given in the Summary report
document for the study as a whole.

Resource Futures | Page 2
Factors within the Plastic Value Chain that lead to Marine Litter | Commercial fishing gear report 3 Introduction to product and marine litter issue Fishing is an important industry in Scotland, with around 4,800 fishers employed on 2,065 active Scottish-based fishing vessels in 2017, landing 466,000 tonnes of catch worth £560 million1. Marine litter directly impacts upon the fishing industry when litter gets caught in propellers and nets affecting fishing operations and potentially endangering lives. Public and scientific concerns around microplastics entering the food web also risks damage to the confidence in fish products. Many actors in the fishing industry are active in tackling marine litter. For example, KIMO’s fishing for litter scheme engages fishers in bringing to shore any litter found at sea and caught in nets.2 However, the fishing industry is also a contributor to marine litter. Statistics vary, but fishing gear is consistently one of the main categories identified in marine litter surveys. The subsequent sections analyse the issue and potential solutions, following the research framework set out in Figure 1. 4 Value chain and stakeholder engagement The following sections discuss the value chain and the specific stakeholders engaged within this study. This relates to the starting point of the research framework, shown below. 4.1 Value chain The value chain for commercial fishing gear starts with producers of raw materials, mostly plastics and metals. Fishing gear components, such as ropes and nets are then constructed. There is a market for selling components directly to fishers who then assemble the final fishing gear themselves, or use the components to replace or repair parts of other gear. Other fishers purchase fully assembled fishing gear directly from manufacturers and suppliers, and are often involved in the gear design and specification. At end of life the waste management activities are initiated by fishers and their agents and managed by ports and waste management companies. These actors are mapped on to the product life cycle stages in Table 1. 1 Marine Scotland (2017), Scottish Sea Fisheries Statistics 2017, https://www.gov.scot/publications/scottish- sea-fisheries-statistics-2017/ 2 KIMO (Kommunenes Internasjonale Miljøorganisasjon). KIMO is an NGO whose mission is the development of sustainable coastal communities, and has worked extensively with fishing communities on the topic of marine litter. Resource Futures | Page 3
Factors within the Plastic Value Chain that lead to Marine Litter | Commercial fishing gear report
Table 1: Commercial fishing gear - Mapping actors within the value chain onto life cycle stages
Life cycle stage Value chain actors
Producers of plastic pellets, metals and
Raw materials
other raw materials
Production Commercial fishing
gear & component
Retail & distribution manufacturers Suppliers
Use Fishers & fishing industry
Port authorities
End of life/recovery
Waste management companies
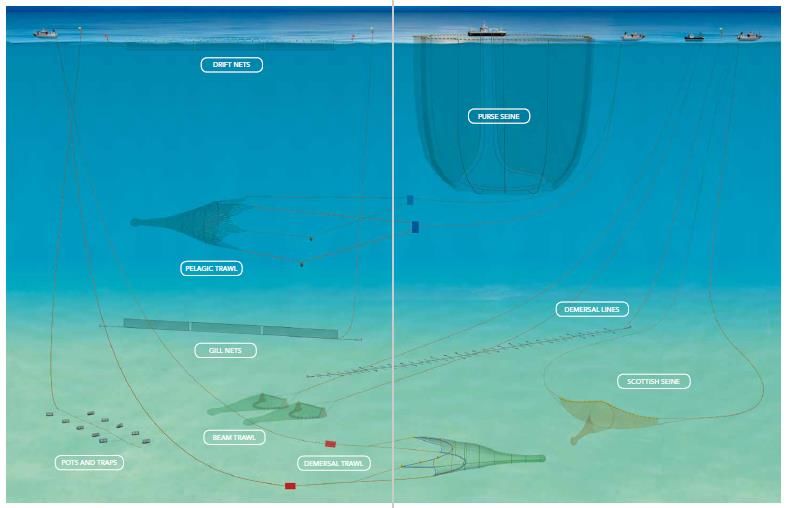
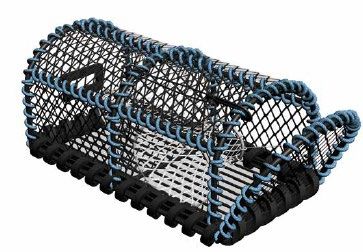
A list of manufacturers and suppliers relevant for Scotland is provided in Appendix A.1. This research
focusses on creels and trawl nets as marine litter items, and a major supplier for each was
interviewed. A creel is used to target shellfish species, and example is shown in Figure 2. Type of
fishing nets commonly used in Scotland are illustrated in Figure 3.
Most creels are manufactured overseas, predominantly sourced from China due to competitive
pricing, lack of UK manufacturers and high labour costs in the UK.3 However, at least one company is
manufacturing creels in Scotland, and their locally manufactured creels account for roughly half their
sales despite being more expensive as customers perceive them to be better quality.4 The most
commercially active vessels typically purchase between 50 and 300 creels a year, weighing 20kg to
30kg each. Creels cost £50 to £100 new and there is an established second-hand market. Plastics
used on the netting, rope, hoops and frame coating account for 30-35% of the total creel weight, the
rest is steel.5 PVC and PP are the main polymers used, chosen as strong long lasting materials. Most
creels are sold assembled but some fishers prefer to assemble them themselves. A fishing industry
representative indicated creels are typically deployed in strings of 10 to 30, 8 fathoms apart and last
five to ten years in use.
3
Interview with Scottish creel supplier
4
Interview with Scottish creel supplier
5
Interview with Scottish creel supplier
Resource Futures | Page 4Factors within the Plastic Value Chain that lead to Marine Litter | Commercial fishing gear report Figure 2: Example of creel pot6 A common supply chain for nets was illustrated in interviews with one of the largest suppliers of fishing gear components, employing around 1,000 staff.7 The supplier makes the components (netting, ropes etc). These are then typically assembled into the finished product, such as a bespoke trawl net, by other companies, and sold onto the end user (fishers). The company sells to Jacksons Trawl (Peterhead), Caley Fisheries (Peterhead), Brixham Trawl Makers (Devon), Coastal Nets (Bridport, Dorset) and others. These companies assemble the final fishing nets and sell them on. The supplier estimates that a skipper may typically invest £2,000 - £20,000 per annum on components alone, not accounting for the mark-up for assembling components into finished products.8 Fishing nets are built for catch efficiency, strength and durability, and some can last up to two to three years heavy use.9 On the other hand nets can be lost on their first use. Taking this into account, the manufacturer reports that on average nets last one or two years. A Cornish recycler reports that nylon monofilament nets typically last 3-6 months, but this type of net is not used in Scotland.10 11 6 Seafish (2015) Basic Fishing Methods 7 Interview with a major supplier of fishing gear components 8 Interview with a major supplier of fishing gear components 9 Interview with a major supplier of fishing gear components 10 Interview with a major supplier of fishing gear components 11 https://fishyfilaments.com/our-filament/ Resource Futures | Page 5
Factors within the Plastic Value Chain that lead to Marine Litter | Commercial fishing gear report

Figure 3: Examples of commercial fishing gear used in Scotland12

Note: drift nets and monofilament gill nets are illegal in Scotland and so have been ‘struck through’ to remove
them from the figure. There are no Scottish longline fisheries and so they have also been struck through,
although some foreign fishing vessels do use longline gear in Scottish waters.
It was noted that fishing gear manufacturers and suppliers are competing in a global marketplace
and any marine litter solutions must consider the global supply chain.13 Products manufactured on a
production line are often sold in multiple countries. Setting country-specific requirements will
diversify the product range and possibly require new production lines increasing costs. However,
solutions developed for one market could be used elsewhere to the manufacturers advantage,
potentially giving them first mover advantage.
Public data was not available to estimate the quantity of fishing gear sold in Scotland and
stakeholders were unable to provide an estimate. One manufacturer reported that there are around
300 producers in Europe, with roughly 50,000 tonnes of European-made fishing gear sold annually in
Europe and around 15,000 tonnes imported from manufacturers outside Europe.14 However, they
were unable to estimate what proportion of this gear is used in Scotland, and previous research to
determine tonnages was unsuccessful.

12
   Seafish (2015) Basic fishing methods, p. 96-97
13
   Interview with Scottish creel supplier
14
   Interview with a major supplier of fishing gear components

Resource Futures | Page 6
Factors within the Plastic Value Chain that lead to Marine Litter | Commercial fishing gear report

4.2        Stakeholder engagement
Many stakeholders outside of the value chain for commercial fishing gear are engaged or affected by
fishing gear as a marine litter issue. This includes Government and public bodies, academia, NGOs,
coastal communities and the wider fish product industry. A mapping of the wider stakeholder groups
relevant for Scotland is shown in Figure 4.

Resource Futures | Page 7
Factors within the Plastic Value Chain that lead to Marine Litter | Commercial fishing gear report

Figure 4: Commercial fishing gear – Stakeholder mapping

                                                                                                     Note: Organisations that engaged
                                                                                                     in the research activities are
                                                                                                     denoted with a square surrounding
                                                                                                     box and bold text

Resource Futures | Page 8
Factors within the Plastic Value Chain that lead to Marine Litter | Commercial fishing gear report Figure 4 shows the organisations that engaged with the research activities in this study, denoted with a square surrounding box and bold text. A high level of awareness and interest in the issue was found across all stakeholder groups. Common themes raised by stakeholders focussed on waste management at end of life. Views differed amongst some stakeholders over the cause of the issue and the solutions needed, in part reflecting some of the major knowledge gaps. These themes are explored in later sections. 5 Marine litter pathways and key decision points The following section discusses the marine litter pathways and key decision points, as per the second stage in the research framework, shown below. The marine litter pathways for commercial fishing gear were investigated in the literature and stakeholder engagement. Figure 5 shows how these pathways stem from key decision points where one choice results in marine litter and another does not. For example, when whole gear reaches end of life a fisher must decide how to manage that waste. In simple terms, they can either store the waste, arrange to dispose of it responsibly or dump it at sea. Several pathways are shown in the product use phase. For example, taking risks such as trawling close to sea floor features where nets can become snagged or working in very poor weather conditions, other forms of accidental loss without risk taking, and intentional sabotage. This can lead to losses of whole gear items or partial losses such as net pieces. It is recognised that there will also be losses through deterioration, e.g. microplastic losses through abrasion from gear in use. This study focusses on macro-plastic losses, although some solutions such as improving durability will also address losses from deterioration. Other key decision points are found further up the value chain. For example, the product design and business model of manufacturers and suppliers could help tackle marine litter. It is recognised that certain business models have the potential to help tackle marine litter. However due to the lack of relevant examples found it was not possible to explore this in detail. It will be important to consider how best to support beneficial new business models as they emerge in this context. The drivers and barriers at key decision points are explored in the next section. Resource Futures | Page 9
Factors within the Plastic Value Chain that lead to Marine Litter | Commercial fishing gear report

Figure 5: Commercial fishing gear - Marine litter pathways and key decision points

6      Drivers and barriers
The following section discusses the drivers and barriers at key decision points, as per the third stage
in the research framework, shown below.

Stakeholder engagement highlighted three key decision points as the most important for
commercial fishing gear, and are as follows:
   1. Bespoke product design and purchase decision
   2. Waste management of large items
   3. Recovery effort for lost gear
These key decision points are discussed in the sections below, drawing upon stakeholder
engagement in the workshop and interviews.

Resource Futures | Page 10
Factors within the Plastic Value Chain that lead to Marine Litter | Commercial fishing gear report

6.1        Bespoke product design and purchase decision
In this specific value chain, the fisher is typically involved in the product design when purchasing a
new net to create a bespoke product that suits their needs, working closely with the manufacturer
or net maker or assembling the net themselves. For example, fishers specify the target species (and
therefore mesh size), overall size of net and opening, size of cod end, etc. informed by regulation on
technical conservation measures designed to protect sustainable fisheries management. Creel pots
are purchased whole from suppliers or assembled by fishers, but tend to be less bespoke in design.
The key actors at this decision point are manufacturers, suppliers and fishers. The point of bespoke
product design and purchase is illustrated in Figure 6 as an extract from the full mapping of marine
litter pathways and key decision points in Section 5.
Figure 6: Decision point - bespoke product design and purchase decision

Figure 7 shows drivers and barriers identified in bespoke product design and purchase decision. The
information is largely derived from stakeholder interviews.15 Primary and secondary factors are
distinguished based on an overall assessment of stakeholder engagement on the topic. On the left of
the figure, the awareness of marine litter and the desire to act is represented for both
manufacturers and consumers. On the right, it is acknowledged that this may make gear more
expensive, and that plastics offer many practical benefits that will be difficult to match when looking
for alternative materials.

15
   The topic was not discussed at the workshop as fishing gear manufacturers and suppliers were not present,
although they were invited and were later consulted individually.

Resource Futures | Page 11
Factors within the Plastic Value Chain that lead to Marine Litter | Commercial fishing gear report

Figure 7: Drivers and barriers in bespoke product design and purchase decision

A small number of products that reduce the risk of marine litter are readily available on the market
and in widespread use. Rock hoppers reduce the risk of trawl gear snagging on the sea floor16,
although these products can become sources of marine litter themselves. Nets and pots with
biodegradable escape hatches are also readily available, in which a small area of the gear will
eventually biodegrade and create an opening so that trapped animals can escape from lost gear,
although timescales of biodegradability are important.
Systems thinking
In most cases, manufacturers and net makers are not currently connected or responsible for end of
life impacts. Some companies do organise recycling for high value pelagic nylon nets but these
appear to be the exception, and other products and polymers are the responsibility of the waste
producer (the fisher). There is an opportunity for systems thinking – not just upstream and
consumer experience, but designs for safe and resource efficient downstream end of life or recovery
options. However, this would require much greater stakeholder communication and collaboration
across the value chain, or policy interventions for shared responsibility at end of life.
Durability
The overall quality of the gear was cited as a factor in marine litter. Using better quality gear
increases performance and reduces storm damage and breakages.17 High-end gear is expensive but
well-designed, durable, less likely to be lost or damaged, and because it is often more repairable it

16
     https://seafish.org/gear/gear/profile/demersal-trawl-rockhopper-trawl
17
     Interview with a major supplier of fishing gear components

Resource Futures | Page 12
Factors within the Plastic Value Chain that lead to Marine Litter | Commercial fishing gear report less likely to be abandoned.18 Using new engineering polymers is one way to increase strength and durability, and subsequently incentivise recycling as the polymer is more valuable.19 Minimum product standards are set, for example in ISO 1805 and ISO 1806 (fishing net determination of break force), ISO 16663 (mesh dimensions), EU REACH20 regulations. One manufacturer commented that cheap gear often does not meet these standards, particularly imports from outside the EU, although the particular example given was for gill nets which are not used in Scotland.21 It is clearly important that standards are applied to all gear, whether produced inside or outside the EU, to avoid a market distortion for manufacturers bearing the cost of complying with the standards. Material choice The choice of material in fishing gear is important. The products are technical in design and the fishing industry reported that the gear needs cleaning and careful handling to ensure that it retains optimal performance. Plastics are generally preferred for their strength to weight ratio, and properties that can be controlled through polymer choice and use of additives such as resistance to abrasion, buoyancy, and the ability to stretch and absorb shocks.22 Netting is typically made of polyethylene (PE) or nylon (polyamide, PA). Nylon is used for pelagic trawl nets, which targets fish in the mid water column and surface water.23 It is chosen for its elasticity, which is important as pelagic nets are not towed in a straight line and need to manoeuvre, turn and recover, and because nylon sinks which helps keep the net open. Polyethylene is typically used for bottom trawling. The material floats and does not give much stretch, properties which help keep the net open and remain taught24. Polyethylene is stronger than nylon and is therefore preferred for bottom trawling nets because it is better able to resist snagging and physical knocks sustained from being dragged along the seabed. A manufacturer reported that nylon would not be appropriate for bottom trawl nets as nylon shrinks when dry and this property could risk illegally small mesh size at times. Polypropylene (PP) and high-density polyethylene (HDPE) are also used in some gear, and new polymers such as ultra-high molecular weight polyethylene (UHMwPE) are starting to be adopted. Natural fibres are rare and less durable than plastic polymers.25 For example, a 5mm diameter plastic cable is comparable to a 20mm diameter cable of natural material in strength and reliability.26 This is important when considering the difficulty and health and safety implications of handling much heavier gear, and the storage space requirements for bulkier products. Furthermore, natural fibres are likely to need coating to stop them rotting, and can lose strength in use. 27 18 Interview with a major supplier of fishing gear components 19 Interview with DSM, manufacturer. Dyneema fiber is reported to be 15 times stronger than steel on a weight-for-weight basis, https://www.dsm.com/corporate/about/business-entities/dsm-dyneema.html 20 EU regulation on Registration, Evaluation, Authorisation and Restriction of Chemicals 21 Interview with a major supplier of fishing gear components 22 Interview with a major supplier of fishing gear components 23 Interview with a major supplier of fishing gear components 24 Personal communication with fishing gear manufacturer 25 Interview with a major supplier of fishing gear components 26 Interview with a major supplier of fishing gear components 27 Interview with a major supplier of fishing gear components Resource Futures | Page 13
Factors within the Plastic Value Chain that lead to Marine Litter | Commercial fishing gear report

Biodegradable plastics
There is ongoing debate around whether material science can be used to tackle the issue and there
have been trials of biodegradable gear.28 29 The design challenge is a difficult one: design a material
that is strong and durable, resistant to microbial attack, and resistant to degradation from sun, wind
and sea while in use, but that will fully biodegrade in a short time period if lost and leave no harmful
residue.
Product design and material choice can play a part and manufacturers reported ongoing research
and development in this area.30 Research includes biodegradable and bio-based polymers
polybutylene succinate (PBS), which has similar properties to polypropylene (PP), and
polyhydroxyalkanoates (PHA), which is produced in nature by numerous microorganisms. One
manufacturer commented that use of biodegradable materials is three to five years away from a
marketable product.
Fishing nets and creel pots are particularly harmful as they are designed to entangle and trap marine
life when in use and continue to do so when they become litter. Timescales are especially critical for
fishing net as lost nets are most effective at trapping animals when still ‘open’, i.e. similar in shape
and arrangement as when the net is in use, but the weight of trapped animals then collapses the net
and the entanglement rate drops.31 32 Biodegradable materials are unlikely to act in this crucial
window when the lost net is still open, suggesting that other solutions are needed.

6.2        Waste management of large items
When a large piece of fishing gear reaches end of life the fisher must decide how to manage that
waste. The decision making, and the pressures on the fisher, are thought to be quite different when
handling large items of waste as opposed to, for example, small pieces of repair waste. Large items
of fishing gear are either stored at harbours, intentionally discarded at sea (resulting in marine litter)
or undergo collection and responsible waste management, typically landfill or incineration. The key
actors at this decision point are fishers, their agents, ports and waste management companies.
Waste management and end of life impacts are not currently high priority in product design but this
will change in the future, particularly through some of the EPR measures discussed in section 7, in
which case manufacturers would become an important actor too. This decision point is illustrated in
Figure 8, as an extract from the full mapping of marine litter pathways and key decision points in
Section 5.

28
   Norwegian Directorate of Fisheries is engaged in long-term R&D with fishing gear manufacturers and
academic institutes.
29
   https://www.lifegate.com/people/news/biodegradable-nets-tackling-ghost-fishing
30
   Interview with a major supplier of fishing gear components
31
   http://www.fao.org/3/i0620e/i0620e03.pdf
32
   https://ieep.eu/uploads/articles/attachments/4a24b509-013d-44ca-b26e-
47c8f52e29c4/ghostfishing.pdf?v=63664509699

Resource Futures | Page 14
Factors within the Plastic Value Chain that lead to Marine Litter | Commercial fishing gear report

Figure 8: Decision point - waste management of large items

Figure 9 presents drivers and barriers for waste management of large items, as raised by
stakeholders in the workshop and interviews. Primary and secondary factors are distinguished based
on an overall assessment of stakeholder engagement on the topic. However, it is extremely difficult
to find a fisher who freely admits to dumping waste at sea. The drivers and barriers presented here
are the opinions of the stakeholders engaged in the research, rather than primary data collected
from fishers dumping waste at sea. However, these stakeholders are well-informed on the issue and
the pressures on fishers, which adds weight to the opinions expressed.
Figure 9: Drivers and barriers in waste management of large items

Resource Futures | Page 15
Factors within the Plastic Value Chain that lead to Marine Litter | Commercial fishing gear report

Differing views amongst stakeholders
Intentionally discarding, or dumping, fishing gear into the ocean is commonly discussed in the
literature as a source of marine litter. However, some stakeholders dispute whether fishers in the
Scottish fishing industry are intentionally discarding waste gear into the ocean. Representatives of
fishing industry bodies argue that no Scottish fisher would intentionally dump waste where it can
later cause problems for themselves and other fishers, entangling their nets, propellers and other
gear if at all avoidable. Furthermore, they would not cause harm to the environment which they
respect and supports their livelihood. This view was also supported by a representative of an NGO
who has worked closely with the fishing industry. Some argued that it is not Scottish fishers but
foreign fleets that are causing the problem in Scottish waters. Unfortunately, no data or studies
were found that could clarify this key point with empirical evidence. On the weight of other
stakeholder opinion this has been identified as a key point for the research, but also one that has the
greatest uncertainty.
Key drivers – time and cost to fishers
Representatives from NGOs, government departments, ports and other groups highlighted the
considerable cost and difficulty in handling waste gear as a factor that might lead to dumping waste
at sea, with the exception of nylon nets that retain sufficient material value to incentivise recycling
and can be sent abroad for processing. The nets have no perceived value at end of life and are costly
to manage as waste. There are currently no recycling facilities for waste nets in Scotland and
typically the only viable waste destination is landfill. Even so, landfill operators are reportedly not
keen to accept nets as they get caught in the machinery used to move and compact the landfill
waste. 33 This is cited as a significant disincentive to manage waste responsibly and a dominant driver
in marine litter. Furthermore, limited information on waste management options was highlighted as
a barrier at workshop. A representative of the creel fishing industry reported a market for waste
creels with local individuals who take the waste for free and sell to a scrap merchant. Where this
exists it would remove the waste management cost to fishers but raises concern around the fate of
materials in a creel that are less valuable, such as plastic netting and hoops.
A key knowledge gap needs to be addressed in understanding the cost of managing different types
of waste gear in more detail: which actors bear the direct costs of waste management and indirect
costs such as time spent handling the waste and arranging for storage, collection and treatment.
Many of the solutions proposed aim to address this point and so it is of utmost importance to gain
better understanding of the current situation. It is recommended this research be undertaken by
engaging ports, harbours, fishing vessels and their agents.
Other drivers
Other drivers and barriers were discussed. A ‘double hit’ of costs in a short period of time,
purchasing new gear and waste management of old gear, could put financial strain on fishers and
influence decision making for the worse. However, fishing industry representatives pointed out that
fishers know when they’re going to buy new gear and plan accordingly to manage finance and also
logistics for managing the old gear.

33
     Comments provided by two recycling industry stakeholders

Resource Futures | Page 16
Factors within the Plastic Value Chain that lead to Marine Litter | Commercial fishing gear report Anecdotally, stakeholders reported that a great quantity of old nets are stored in ports and harbours. Stakeholders did not consider this a marine litter risk, and reported that they were typically safely stored in containers. It is not clear whether the cost of waste management is a contributing factor to storing old nets rather than sending for treatment. The limitation of available space at ports and harbours, particularly if already full of old nets, was raised in the workshop as a factor in the decision to discard nets at sea. The low risk of being caught and penalised does not help. Fishers can easily avoid observation if they wish to discard of waste gear, and it is practically impossible to trace litter back to a vessel and prove it was intentionally discarded. There was even an anecdote of ‘tidy littering’, dumping nets on a wreck where they would be ‘out of the way’ and not cause problems for fishers. However, professionalism was raised by representatives of the fishing industry. This included taking care of equipment and work environment, taking pride in the work, wanting to set a good example to others, and supporting a good industry reputation. Pro-environmental behaviour was often discussed, in reference to the Blue Planet II ‘Attenborough’ effect, and the need to preserve the natural environment for future generations (i.e. bequest value). Younger generations of fishers were highlighted as particularly conscientious and environmentally aware, and a potential driver of behaviour change. Many stakeholders recognised the historic culture of discarding waste at sea but commented that it has improved significantly. The literature review identified economic hardship in some fishing communities, which can exacerbate other economic drivers.34 A lack of awareness of environmental consequences will also be a limiting factor for some fishers. 6.3 Recovery effort for lost gear Fishing gear is accidentally lost for a wide range of reasons. For example, static gear can be moved by bad weather or other vessels, and fishers sometimes cut gear free if snagged on sea floor features or bad weather makes conditions dangerous. When fishing gear is lost the fisher must decide how much effort to put into attempting to recover it, a commercial time cost-benefit decision complicated by the risk of health and safety to crew as well as potentially not recovering fishing gear even if attempts are made. Currently fishers are the main actor involved in this decision point, although there is scope to involve other organisations, such as Government. This decision point is illustrated in Figure 10, as an extract from the full mapping of marine litter pathways and key decision points in Section 5. 34 Fishers experience considerable financial pressure due to the unpredictable nature of their earnings and 61% of port neighbourhoods are classed as deprived, as measured by the Index of Multiple Deprivation. Seafarers UK (2018) ‘Fishing for a Future’, p. 1 https://www.seafarers.uk/wp- content/uploads/2018/01/Fishing-for-a-Future.pdf Resource Futures | Page 17
Factors within the Plastic Value Chain that lead to Marine Litter | Commercial fishing gear report

Figure 10: Decision point - recovery effort for lost gear

Bad weather is typically cited as the main cause of accidental gear loss. 35 Static gear such as creel
pots can be moved by bad weather and become lost or entangled in other gear and sea floor
features. Static gear can also be accidentally caught and moved by other vessels, e.g. by trawl gear
or boat propellers. Trawl gear may need to be cut loose from a vessel in bad weather if the
conditions are considered dangerous to the vessel and its crew.
Workshop participants highlighted that a lack in information and communication can also contribute
to accidental losses. Fleets may not know the location of static gear when communication is ad hoc
and gear is not clearly marked.
Once gear is accidentally lost the skipper must decide how much effort to put into recovery. The
drivers and barriers at this decision point are outlined in Figure 11, informed by the commercial
fishing gear workshop and stakeholder interviews. Primary and secondary factors (drivers and
barriers) are distinguished based on an overall assessment of stakeholder engagement on the topic.

35
     A view also given by stakeholders in the commercial fishing gear workshop.

Resource Futures | Page 18
Factors within the Plastic Value Chain that lead to Marine Litter | Commercial fishing gear report
Figure 11: Drivers and barriers in recovery effort for lost gear
Workshop participants highlighted that creel pots and fishing nets are valuable items, and a fisher
will be highly incentivised to retrieve this gear when lost. An essential enabling condition is having
suitable equipment to recover the gear, which stakeholder interviews indicated was true of most
vessels. Time was also highlighted as a valuable resource, particularly if it results in a loss of income
and so could motivate recovery if no replacement gear is readily available and fishing time is lost.
Fishers are further motivated to recover items by a “moral duty of care” both for the environment
and the profession. The requirement to attempt recovery and report losses was also recognised.36 A
lack of funds to replace the lost gear could make recovery all the more important.
However, the fisher must make a cost-benefit analysis of the amount of time and resources to invest
in recovery efforts weighed against the likelihood of success and the value of the recovered gear
(which may be old or damaged). Risk management and health and safety must be considered when
recovery is difficult or dangerous, e.g. dealing with snagged or broken gear. In addition, the fisher
may be able to continue fishing if the lost gear is only a section of the net or a spare is available in
the vessel or close by on shore, as is often the case. Time spent on recovering gear has an
opportunity cost of not spending that time fishing and gaining revenue. Stakeholder interviews
revealed it can be difficult to locate lost gear.37 Furthermore, if the recovered gear is not repairable
then it will carry all the waste management issues discussed above, which would further discourage
recovery. A lack of awareness around environmental consequences and legal obligations of lost gear
was also raised as a discouraging factor.
36
MARPOL Annex V and Common Fisheries Policy
37
Particularly raised by creel fishers and specialist waste management sectors
Resource Futures | Page 19Factors within the Plastic Value Chain that lead to Marine Litter | Commercial fishing gear report 7 Potential solutions The following sections discuss the potential solutions, the final stage in the research framework, shown below. At the workshop, stakeholders from across the value chain discussed future action. Participants emphasised that all actors have a stake in this issue and must be involved if solutions are to be successful. In particular, they highlighted that pilot programmes, education and collaboration are needed, sought leadership, especially from Government, and thought legislation could be necessary. Each potential solution is evaluated below in terms of how it would help tackle marine litter and how it addresses specific drivers and barriers identified in section 6. Table 2 presents a summary of the likely influence solutions can exert on key decision points. The scale of the impact of each solution will depend largely on its design and implementation. Resource Futures | Page 20
Factors within the Plastic Value Chain that lead to Marine Litter | Commercial fishing gear report

Table 2: Commercial fishing gear - where solutions can most influence key decision points

                                                    Education                                               Gear marking                                         Deposit
                         Key decision                                                       100% indirect                  Takeback     Advance      Modulated
 Life cycle stage                                      and                Recycling                          and tagging                                          return
                         point                                                                  fee                         scheme    disposal fee     fee
                                                   engagement                                                                                                    scheme
 Production
                         Bespoke product
 and
 Retail &
                         design and                     ✔                    ✖                   ✖             ✖            ✔            ✖             ✔          ✖
                         purchase
 distribution

                         Recovery effort
 Use
                         for lost gear                  ✔                     ?                  ✔             ✔            ✔            ✔             ✔          ✔

                         Waste
 End of
 life/Recovery
                         management of                  ✔                     ?                  ✔             ✖            ✔            ✔             ✔          ✔
                         large items

✔ = Yes, ✖ = No, ✔ = Yes - if solution designed with this in mind, ? = Unknown

Resource Futures | Page 21
Factors within the Plastic Value Chain that lead to Marine Litter | Commercial fishing gear report
7.1 Education and engagement
The International Maritime Organisation’s (IMO) MARPOL Annex V prohibits the discharge of all types of
rubbish (including commercial fishing gear and synthetic ropes) into the sea from ships. More than 150
countries have signed up to the convention and ships (12 metres or more in length) are required to display
placards which notify the crew and passengers of the discharge requirements and, amongst other things,
carry a waste management plan. In 2018, the IMO adopted an Action Plan to address marine plastic litter
from ships. These and other developments have helped raise the profile of marine waste among the fishing
community. However, offshore, out of sight of others and in many cases beyond the reach of coastguard
and law enforcement agencies, regulatory enforcement is not a straight-forward matter, and if marine litter
is to be minimised, fishermen’s altruism and sense of social responsibility may be a more valuable resource
than a rulebook full of regulations.
There is already significant awareness of marine waste among fishermen. Mouat et al, in a 2010 study38,
estimated that on average marine litter costs each Scottish fishing vessel between €17,000 and €19,000 per
year, two-thirds of which was incurred through time lost clearing litter from nets. Aggregated, the authors
found this would have been enough to knock 5% off the fleets’ total annual revenue. Cognisant of these
costs, each vessel carries a net store and over 200 Scottish vessels are now engaged in the KIMO
administered ‘Fishing for Litter’ scheme, by which any items of waste caught in fishermen’s nets are
brought up on deck and voluntarily stored in a special container on board before being brought back to
harbour and discarded via a dedicated ‘Fishing for Litter’ skip. Another initiative, the Responsible Fishing
Scheme (RFS), is an independently audited scheme operated by Seafish, intended to demonstrate that a
vessel and its skipper are implementing best practice in five core areas, including Care of the Catch and
Care for the Environment, which specifically address the sound management of litter and recovery of lost
fishing gear39. Stakeholders spoke positively about these initiatives, in particular the ‘Fishing for Litter’
scheme which was mentioned by several consultees. One person, indicating the scale of the marine waste
problem (and its inconvenience to the industry itself), reported a fisherman had told him the most unusual
(and largest) item he had ‘caught’ was a helipad. This had been too heavy to bring on board and the crew
had no choice other than to cut their nets – resulting in losses of tens of thousands of Euros in catch and
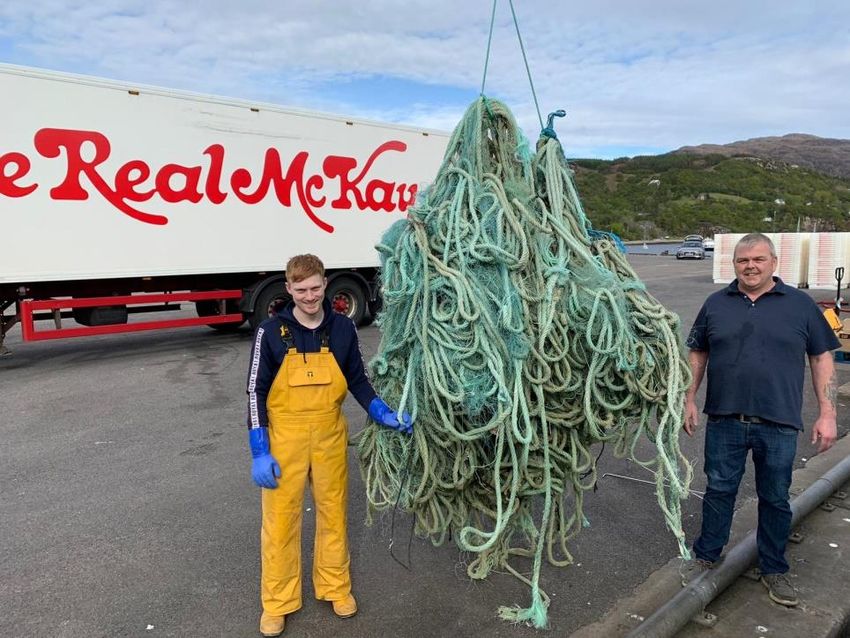
equipment. Figure 12 below, courtesy of the Scottish White Fish Producers Association, shows two
fishermen with some waste fishing gear they found in the sea and brought back to harbour.
As the economic impact of marine litter has become more prominent within the sector, fishermen have
voluntarily changed their behaviour. A commentator working in the static sector believed that most creels,
when they are fished up, are generally kicked back into the sea, as lost creels were very seldom recovered.
More commonly heard was the view that fishermen used to dump waste at sea but now, more often than
not, they bring it back. A third stakeholder, from the mobile fleet, told us that increasingly in recent years,
fishermen understand the nature of the social contract which binds them. A fourth, from a recycling
business, reported his belief that though fishermen are often blamed for marine waste, he did not believe
they were responsible for it – and certainly not the current generation. He pointed out that younger
38
Mouat et al, The Economic Impact of Marine Litter, www.kimointernational.org/wp/wp-
content/uploads/2017/09/KIMO_Economic-Impacts-of-Marine-Litter.pdf
39
https://www.seafish.org/article/what-is-rfs
Resource Futures | Page 22You can also read