Crossrail Property Impact & Regeneration Study 2012 - 2026 - Rackcdn.com
←
→
Page content transcription
If your browser does not render page correctly, please read the page content below

Crossrail Property Impact
& Regeneration Study
2012 – 2026

                 1
Contents
                                                                                                   Executive Summary                                               4

                                                                                              1.   Introduction & approach                                        12

                                                                                              2.   What have others considered to be the impact?                  16

                                                                                              3.   Value, development pipeline and development delivery impacts   22

                                                                                              4.   London’s world city economy                                    44

                                                                                              5.   London’s housing needs                                         62

                                                                                              6.   Town centres & placemaking                                     74

                                                                                              7.   Putting the Crossrail influence in context                     82

                                                                                              8.   Conclusions                                                    95

CONTRIBUTORS

                   Cover image: Artist’s impression of Bond Street station at Davies Street
                   All Crossrail images in this report   © Crossrail Limited.
               2                                                                                                                                      3
Impacts within 1 km of an
Foreword                                                                                                                                 Elizabeth line station
The Crossrail project is delivering the Elizabeth line – a new railway for London and
the South East. Running from Reading and Heathrow in the west, through 26 miles                                                          2012 Predictions
of new tunnels under central London to Shenfield and Abbey Wood in the east, it
will cut journey times, reduce crowding on the existing transport network and
provide passengers with more journey options.
                                                                                                                                              Housing:                          Property Uplift:                     Property value:               Commercial:
In December 2018, the ten new stations and 26 miles of tunnels below the capital will                                                                                                                                   £5.5bn in                  3.25mn sq m
                                                                                                                                           Development of                         18% uplift in
open to passengers. The full route will open at the end of 2019, transforming the way                                                                                                                                  additional                 of commercial
                                                                                                                                          57,000 new homes                          property
that millions of people travel every day.                                                                                                                                                                                 value                       space
                                                                                                                                                                                     values
However, Crossrail is delivering more than just a railway. The improved transport links that
the Elizabeth line will bring will help to reshape the areas through which it runs – driving
development, attracting investment and jobs and acting as a catalyst for regeneration.
                                                                                                Andrew Wolstenholme,
When the line opens fully in December 2019, it will add ten per cent capacity to central        Crossrail CEO

                                                                                                                                         By 2021 we forecast the following impacts:
London’s rail network and bring an extra 1.5 million people to within 45 minutes of central
London. It will connect the city’s financial and commercial districts more effectively with
Heathrow airport, bring commuters closer to their jobs and make areas outside central
London even more attractive places in which to live and work..

While the project has been busy creating the new railway tunnels beneath the streets
                                                                                                                                              Housing:                          Property uplift:                    Property value:                    Commercial:
of the capital, constructing ten new stations and upgrading the existing rail network
                                                                                                                                           Development of                         19% uplift in                     £10.6bn uplift in                   4.44mn sq m
in outer London, the regeneration of neighbourhoods right along the route is already
                                                                                                                                          90,599 new homes                          property                        property values                    of commercial
well underway.
                                                                                                                                                                                     values                                                                 space
This report updates research that was carried out by GVA in 2012. What these latest
findings show very clearly is that the Elizabeth line will have an even greater impact
on development, regeneration and value creation than previously thought.

As the opening of the new line approaches, the number of developments that cite
Crossrail as one of the main reasons for progressing has risen. GVA has increased its
predictions on the development of new homes along the route by 2021 from 57,000                                                          By 2026 we expect:
to 90,000 and expects this to double to 180,000 by 2026.

In central London, the Elizabeth line will reinforce London’s status as a global city. It has
created the capacity and conditions for major new headquarters for the likes of Facebook,                                                                                                                      Property value:
Deutsche Bank and Societe Generale, allowing for the accommodation of more than                                                                Housing:                          Rejuvenation:               £20.1bn total uplift
300,000 new jobs in key employment hubs including Liverpool Street and Canary Wharf.                                                        Development of                      New residential
                                                                                                                                                                                                              in propertyvalues
                                                                                                                                          180,000 new homes                     and workspace
Outside central London, with hotspots including Ealing, Woolwich, Ilford and Romford,                                                                                            opportunities                    within 1 km
GVA forecasts that the Elizabeth line will have a major impact. Better transport links                                                                                                                            of a station
will attract the construction of new homes and offices and make these areas even
more attractive places for people to live, work, visit and set up business.

In addition to the broader development taking place along the Elizabeth line route,
Crossrail is the first project in the UK to design the stations, surrounding areas and the
oversite development opportunities at the same time. This integrated approach will knit
the new stations into their surroundings, deliver over three million square feet of office,
retail and residential space above new stations, and enhance the public realm outside,
as well as capturing value for the public purse..

There are also valuable lessons to be learnt for future big transport programmes that                                  EALING BROADWAY                   TOTTENHAM COURT ROAD                          LIVERPOOL STREET                 CANARY WHARF                   STRATFORD

are considered in the report. It is vital that all parties work closely together to make the
most of the catalytic power of major transport upgrades and to spread the benefits
well beyond the locality of the station. With planning for Crossrail 2 now well underway,
it is important to capture this insight and ensure that it is passed on to future projects
so the wider benefits of investment can be maximised for years to come.
                                                                  4                                                                                                                                5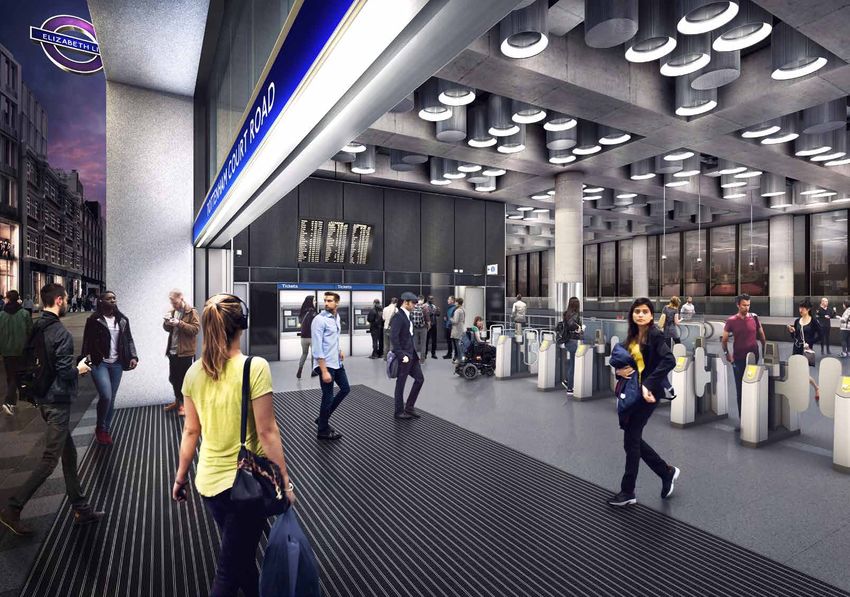
Crossrail’s value impact already exceeds 2012 forecasts, with
                                                                                                                                stations along the route seeing values in 2016 on average over
                                                                                                                                30% higher than predicted
Key findings
Our headline findings show that the expectations from the 2012 study of what impacts would accrue                                  Indicative
by 2021 have more than been achieved. They also suggest that there are still opportunities linked to                               residential
Crossrail that have not been realised yet and will occur once the Elizabeth line is operational.                                   value

To understand these impacts we have modelled forward beyond the 2021 period (to 2026). By modelling
to 2026 we are not only updating the expected benefits from the 2012 study, but extending them. The
property value impacts and permitted development pipeline impacts are then considered as combined                                                                                                       Crossrail uplift
outputs for the two studies, including the pipeline data over the period from 2008 to 2016.

Detailed analysis to support these findings is included in Section 5.

PROPERTY VALUE IMPACTS
                                                                                                                                                                                                        29%
Residential property
Based on permitted schemes alone, Crossrail could
                                                                 Office property
                                                                 Based on the permitted office pipeline from 2012 – 2016,                                                            19%                Baseline forecast

create up to £20.1bn in additional residential property          Crossrail could create an additional £357.4m of office
value by 2026, and average value increases along                 rental value, an average value increase of 14%.
the route of 29% above baseline forecasts.
                                                                 Along the Elizabeth line route, core office markets (in 11
In central London, by 2026, values could                         station locations) have experienced growth 26% higher
rise by 35%, and in outer London by 23%                          than we predicted in 2012.
above the rising baseline projection.

As set out above, Crossrail’s value impact
                                                                                                                                2012                                          2021               2026
already exceeds 2012 forecasts, with stations
along the route seeing values in 2016 on
average over 30% higher than predicted.
                                                                                                                                   Indicative
                                                                                                                                   office value

                                                                                                                                                                                                        Crossrail uplift

  £20.1bn                              35%                           £357.4m                                26%                                                                                         14%
                                                                                                                                                                                                        Baseline forecast

in additional residential       rise in values in central           of office rental value,            Core office markets                                                         8%
property value by 2026              London by 2026                    an average value               have experienced growth
                                                                       increase of 14%              26% higher than predicted

                                                                                                                                2012                                        2021                 2026

                                                             6                                                                                                      7
PERMITTED DEVELOPMENT PIPELINE DEVELOPMENT DELIVERY PROGRESS
The 2014 Development Pipeline Study identified the development pipeline over the period from The analysis of development delivery progress focuses Economic impact
2008 to mid-2013. This Study extends this by identifying the development pipeline over the period only on development schemes permitted between mid- Crossrail is playing a key role in strengthening and
from mid-2013 to 2016. 2013 and 2016 (the time period considered for this Study). shaping London’s position as a world city economy.
Over the combined period from 2008 – 16, significant development has been permitted around Crossrail is also driving development delivery over this • In central London, Crossrail is
Elizabeth line stations, with Crossrail having had a potential influence on unlocking: time period. Along the Elizabeth line route residential
»» Creating the capacity and conditions for major new
development starts (as a share of total consents) are
corporate headquarters for the likes of Facebook,
more than 10% higher in locations when compared to
Société Générale and Deutsche Bank
borough averages.
»» Enabling 319,000 additional jobs to be
90,599 4.44m 446,646 In total 70% of residential schemes permitted in station
locations along the new route have commenced, as
accommodated in key locations such as Liverpool
Street and Canary Wharf
opposed to an average of 59% of schemes in the
corresponding wider borough areas. • In outer London, Crossrail is
Almost two-thirds of stations along the Elizabeth line »» Creating the capacity for 42,000 additional jobs
residential units sq m office floorspace sq m of retail route are consistently seeing higher construction rates
(which equates to floorspace »» Enhancing connectivity to help attract for example
than the boroughs within which they sit.
c.362,000 jobs) new tech firms to Hayes, cultural activities to
This impact is most pronounced in the East where Woolwich and office development to Ealing
Between 2008 and 2016, 48% of permitted planning applications within 1km of new stations have 79% of all permitted homes along the new route have
highlighted the positive role Crossrail has played in supporting development. Recent years have seen commenced, compared to a borough average of 51%.
the role of Crossrail more widely cited in planning cases, increasing to 58% between 2013 and 2016 from This suggests that Crossrail is a critical factor in realising
40% in 2008–2013. the Mayor’s aspiration to unlock the “City in the East”,
helping bring forward capacity for London’s expansion
Since 2008, Crossrail has had a direct role in bringing forward planning consent for: and growth. In total 70% of residential schemes
For many central locations along the Elizabeth line route, permitted along the Elizabeth line
affordable housing is not traditionally located wthin our
study area, 1km around stations. This being the case, it route have commenced
may not be surprising that the proportion of affordable
66% 68% 58% housing being delivered along the route is lower than
borough-wide averages. However, Crossrail does appear
to help secure higher levels of affordable housing along
the Outer London parts of the route.
• In the West, permissions in the Elizabeth line locations
of all residential units of all office floorspace – of all retail floorspace
close to stations – c.3.1m sq m of - 220,000 sq m of new achieve on average 26% affordable housing, compared
almost 60,000 homes new space shops and restaurants to the 19% borough average
• In the East, permissions in the Elizabeth line locations
These Crossrail-dependent developments create potential uplifts of: achieve on average 20% affordable housing, compared
to the 17% borough average
• Registered Providers are directly bringing forward more
than 3,300 units on stand-alone sites within 1km of
Elizabeth line stations (providing both direct and in
£13bn £215m direct support for affordable housing)
in residential value in commercial value
by 2026 by 2026
8 9
Lessons learned
To add depth to the figures and inform future infrastructure and regeneration programmes, Future
of London and GVA conducted anonymous interviews with local authorities, the Greater London
Authority and Transport for London, developers, occupiers and Business Improvement Districts.
Findings are detailed throughout the report, and are summarised here.
In strong locations, Crossrail is seen as adding to the mix        Town centre regeneration and commercial activity
of attributes that make an area attractive for investment.         outside Central London is largely occupier, rather than
It can be difficult to isolate specific influences, but the        investor, driven. As such, impacts are likely to come
new route and stations are clearly regarded as catalysts           after opening, once the Elizabeth line can be properly
for regeneration and development.                                  experienced. Early town centre activity has been led by
                                                                   residential development, where improved connections
To maximise that catalytic power and to spread benefits
                                                                   can attract new (and often more affluent) markets.
beyond the station area, Crossrail must be part of a wider
array of investments and cross-sector activities, including
coordinated public realm, transport ‘feeder’ services,
planning policy and regeneration strategy.                         Delivered well, this new housing
On the other hand, the attractiveness of Crossrail’s               should in turn help to develop or
impacts has created challenges in terms of land                    revitalise town centre offers. Plans
speculation, which may have held back delivery while
landowners wait for value increases. Understanding and
                                                                   now emerging indicate a ‘second
preparing early for the impacts of major infrastructure            wave’ of development that will
can help mitigate this risk.
                                                                   bring forward new retail, leisure
Taking a larger stake in terms of land ownership can
                                                                   and office activity.
help to increase control over delivery and can therefore
provide multiple benefits.                                         As locations become more attractive to larger
A stronger public stake in development for Local                   corporations, there is a risk of crowding out SMEs,
Authorities and Registered Providers – especially                  including independent retail and restaurants, stripping
through early land-use masterplanning or site                      an area of what made it special. A number of local
identification – could also increase affordable housing            authorities are tackling this through planning.
in future infrastructure megaprojects if infrastructure            As this report shows, there is a strong case for much
and housing policy can be more closely aligned.                    more joined-up thinking around new infrastructure –
This research doesn’t capture developer contributions              especially on projects at the scale of Crossrail to enhance
of off-site affordable housing beyond a kilometre                  opportunities and manage risks. In the main, this does
from each station, so numbers are likely higher                    not require new delivery structures; it does require a clear,
than reported. Still, Crossrail’s highly central, high-            shared vision, appropriate resourcing, and commitment
value inner-London locations mean affordable                       from and alignment between agencies over the life of
housing tied to station proximity is lower than                    the programme. Predicting and mapping influences and
the borough average in Central London.                             impacts would therefore be simpler, and benefits should
                                                                   be easier to grasp and track for all stakeholders.
Although Crossrail is supporting a higher percentage of
affordable housing than the borough average in Outer
London, the pan-London numbers could be higher for
future programmes, particularly given the new Mayoral
focus on delivery of affordable housing which emerged
only in the latter stage of the study period.

                                                                                                                                   Artist’s impression of Canary Wharf Station
                                                              10                                                                                                                 11
1
                                                               Introduction & Approach

Artist’s impression of Tottenham Court Road Station
                                                      12                13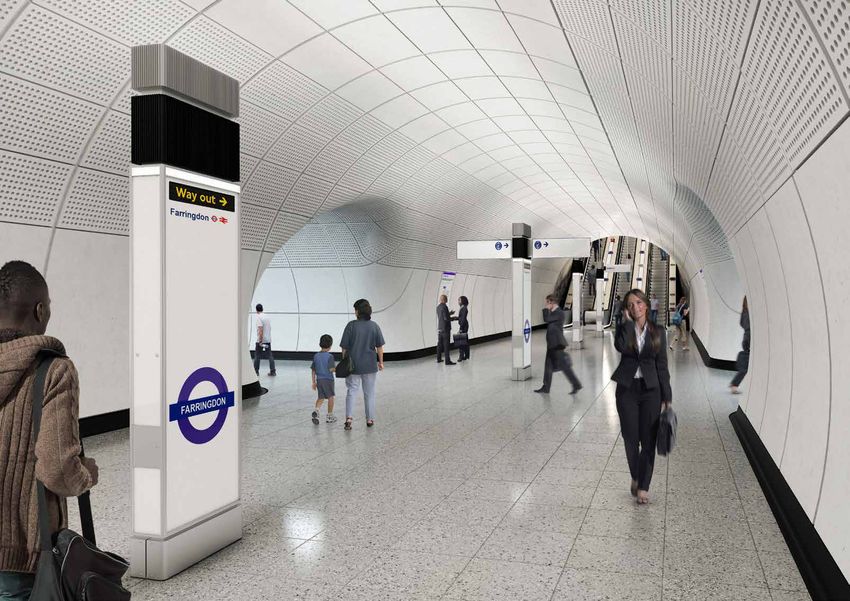
INTRODUCTION APPROACH & METHOD
1.1 GVA, supported by Future of London (FoL), have been commissioned by Crossrail Limited to undertake new 1.6 The quantitative elements of this Study’s analysis replicate the approach used in GVA’s previous
research to update and test the understanding of Crossrail’s impact on property and regeneration along the Property Impact Study (2012) and Development Pipeline Study (2014), using the same 500m and 1km
route. This comes at an exciting time when the first new trains have commenced passenger service between zones of influence as previously defined (with the addition of Reading and Twyford stations, which were
Liverpool Street Main line and Shenfield on the TfL Rail route, ahead of the Elizabeth line opening in phases not confirmed when the previous studies were undertaken). It also draws on the same data sources (where
through to December 2019. possible) to update the value uplift assumptions, value benchmarking data and development pipeline data.
1.2 This report provides a fresh take on the full range of 1.4 The Study also takes Future of London’s Crossrail 1.7 To support this quantitative analysis we have • Line Section: Splits the Elizabeth line route
impacts Crossrail is having, building on the strong as Catalyst report (2014) as another jumping- engaged with stakeholders across the property (shown below in Figure 1) into three sections which
base of research already undertaken to establish off point for the research. Crossrail as Catalyst industry, to understand the impacts that cannot be align with the Central London and Outer London
the quantitative benefits (using secondary data sought and reported key qualitative responses revealed by data alone. As mentioned, this has been property markets. The Central Section (Paddington
analysis), but also extending analysis to capture to Crossrail’s influence, with a focus on how it undertaken through targeted interviews with the to Canary Wharf) captures the Central London
the qualitative influences the delivery of major has affected placemaking, regeneration and private sector (developer, investors and occupiers), market and the West Section (Reading to Acton
infrastructure can have on London’s places (using consultation around stations and the reactions led by GVA, and the public sector led by Future of Main Line) and East Section (Stratford to Shenfield
primary data collection through interviews). required from the public sector to harness the London. and Custom House to Abbey Wood) capture the
opportunities that new connectivity brings. Outer London market. As set out in the Appendix
1.3 The Study builds on GVA’s earlier research presented 1.8 Full explanation of the approach, including data
I, this facilitates benchmarking and consideration
in the Crossrail Property Impact Study (2012) 1.5 In addition to updating GVA and FoL’s earlier work, sources, assumptions and benchmarking approaches,
of the unique character of the London Central
and Crossrail Development Pipeline Study (2014). we investigate the scheme’s wider regeneration is provided in the Appendix. The key terminology
Activities Zone (CAZ).
It refreshes the understanding of the property benefits through cross-sector interviews. This in- used throughout this report is defined below:
market benefits Crossrail continues to unlock depth material provides a richer insight into impacts • Benchmark Markets: Value and development pipeline
• Zone of Influence: Refers to 1km radii around future
as evidenced by the value, scale and nature of than quantitative analysis alone, provides lessons trends in the Zones of Influence are compared to
Elilzabeth line stations which captures the principal
development along the route. This is organised for future programmes, and links Crossrail’s impacts wider geographies, such as boroughs, to enable
geography of property and regeneration impact as
around Crossrail’s role as an agent for property directly to the Mayor’s priorities for London. Our benchmarking of Crossrail investment impact.
a result Crossrail investment, which was adopted
value change, a tool for creating development analysis therefore helps move forward the debate Benchmark market areas vary for different metrics
and used in the 2012 and 2014 studies. The Zone of
capacity, and a catalyst for delivery, underpinned on the value of transport infrastructure as a tool to and stations along the Elizabeth line route. Section
Influence may be split into an inner (0-500m) and
by extensive and robust quantitative data analysis. unlock regeneration and meet Mayoral objectives. benchmarks are also used when considering line
outer (500-1km) zone in accordance to evidence in
section average findings; West Benchmark, Central
support of Crossrail Community Infrastructure Levy
Benchmark and East Benchmark. The method
(CIL). Further detail regarding these inner and outer
Figure 1: Elizabeth line route map in Appendix I sets out how these correspond to
zones and the rationale for adopting them is set out
stations, and provides more detail on how they are
in Appendix I.
used throughout this report.
• Central London: For the purposes of this Study
Central London refers to the area from Paddington
to Canary Wharf.
14 15
2
                                                    What have others
                                                    considered to be
                                                    the impact?

Artists impression of Farringdon Station
                                           16                17
This study will build on GVA’s previous categorisation of the
Crossrail influence on stations, in order to provide an updated
view of how the Crossrail influence is evolving at each station
along the new route.

2.1 There is a range of published research on Crossrail, which has a varied focus on the influence of Crossrail                VALUE GROWTH AND CHANGING DYNAMICS OF LOCATIONS
    on the property market, and provides a platform for this Study to build on. A review of these determines
    commonalities and differences between findings, and aids to inform the approach to this Study. We also aim                 2.7	CBRE, JLL, Hamptons and Knight Frank research emphasise the value increases created in locations
    to tackle any significant unanswered questions raised by other work about Crossrail’s influence, and provide a                  with Elizabeth line stations, which is supporting increased development activity and investment in these
    robust, transparent evidence base where this may help to resolve discrepancies between different findings.                      locations. Methods and timescales vary across each of the studies, producing the following findings:

2.2 The following studies have received                             • Impact of Crossrail (April 2015) – City of London          • CBRE: Finds 31% average increase in house prices                  2.9	The CBRE, JLL, Hamptons and Knight Frank studies
    significant media reference and comprise the                      Corporation                                                  near stations along the route between 2008                             identify particular stations where the influence of
    core contributions to commercial research with                                                                                 and 2016.                                                              Crossrail is most significant, where it is supporting
                                                                    • Crossrail Property Impact Study (2012) – GVA                                                                                        the most transformational change, and where there
    regard to Crossrail’s property related impact:                                                                               • JLL: Expects 42% average increase in house prices
                                                                    • Crossrail Development Pipeline Study (2014) – GVA                                                                                   may be longer term plays in locations which see
  • Foresight: A global infrastructure perspective (44th                                                                           near stations along the route between 2014 and
                                                                                                                                                                                                          a step change in accessibility. This study will build
    edition – August 2016) – KPMG                                   • Crossrail as Catalyst (2014) – Future of London,             2020, outperforming the Greater London average
                                                                                                                                                                                                          on GVA’s previous categorisation of the Crossrail
                                                                      supported by Crossrail, GVA, Arup, and London                by 6%.
  • Crossrail: Identifying Opportunities (UK Research,                                                                                                                                                    influence on stations (Limited Impact, Reinforcing
                                                                      Communications Agency                                      • Hamptons: Finds 34% average increase in house                          Directions, and Creating Change), bearing in mind
    January 2015) – JLL
                                                                  2.3 It is worth noting, in the context of this Study,            prices near stations along the route between 2009                      how other research has considered the influence for
  • Crossrail: The Impact on London’s Property Market                                                                              and 2013.                                                              different stations, in order to provide an updated
                                                                      that Transport for London have commissioned a
    (Winter 2013/14, updated March 2016) – CBRE                                                                                                                                                           view of how the Crossrail influence is evolving at
                                                                      much broader assessment of Crossrail’s impact. Led         • Knight Frank: Finds that average increase in house
  • Crossrail: Analysing Property Market Performance                  by Arup this project is still at an early stage of its                                                                              each station along the Elizabeth line route.
                                                                                                                                   prices near stations along the Elizabeth line route
    Along the Elizabeth line (2017) – Knight Frank                    research but will investigate the influence Crossrail        outperform the Greater London average by 7%
                                                                      has had (or will have) on a range of economic, social,       between 2008 and 2016.
  • Linking Housing Markets: The Effect of Crossrail on
                                                                      deprivation and other indicators and measures.
    Housing Markets in London (March 2014) - Hamptons                                                                          2.8	As a result of this house price growth, driven by
  • The Impact of Crossrail on Visitor Numbers in Central                                                                           the increased transport capacity delivered by the
    London (January 2014) - Arup                                                                                                    Ellizabeth line, particularly improving accessibility for
                                                                                                                                    outer sections of the new route, wider development
                                                                                                                                    and regeneration in station areas is identified.
                                                                                                                                    To extend the findings of these pieces of research,
INCREASED FOOTFALL IN CENTRAL LONDON                              LESSONS LEARNED THROUGH DELIVERING                                building on GVA’s previous research, this study
                                                                  THE CROSSRAIL PROJECT                                             provides further value growth projections, adding
2.4	The Arup study focuses on Crossrail’s impact
     on visitor numbers and flows in central stations             2.5	The KPMG paper draws on findings from a Crossrail            to those produced in other research, but also aims to
     (Bond Street, Tottenham Court Road and Farringdon)                Case Study and focuses on the governance and                 unpack the dynamics of this residential price growth
     through the increased capacity created by the                     project management of the delivery of this ‘mega-            in much greater detail. This is undertaken by seeking
     Elizabeth line. It does not focus specifically on the             project’, rather than its property and regeneration          to understand how it supports housing delivery,
     resultant property market impacts, as is the case for             impacts.                                                     and exploring whether it is enabling the provision
     the JLL and CBRE research, instead demonstrating                                                                               of affordable housing, as well as determining the
                                                                  2.6	This provides useful context and understanding for           commercial market impacts, and the influence
     the increased passenger numbers which will result
                                                                       the approach and strategy adopted to deliver the             on placemaking and other regeneration factors.
     from the opening of the Elizabeth line. However this
                                                                       project, but does not provide any particular threads
     sets the scene for part of the focus of this Study,
                                                                       to explore as part of this Study.
     namely the changing dynamics of the Central
     London commercial property market underpinned
     by increased footfall, which is blurring boundaries
     between traditionally defined locations.

                                                             18                                                                                                                                 19
PREVIOUS GVA STUDIES
2.10 The main foundations for this Study are the two 2.12 Whilst it is important to update the metrics
previous studies undertaken by GVA; Crossrail measured in previous research to develop the most
Property Impact Study (2012) and Crossrail up to date understanding of Crossrail’s influence
Development Pipeline Study (2014). As set out in the possible, the main aim of this Study is to extend
previous section, the same methodology is used to the understanding of its influence as an agent
update the value growth projections for residential for property value change, a tool for creating
and commercial prices and rents, and to analyse the development capacity, and a catalyst for delivery,
permitted development pipeline (through planning whilst also exploring the wider benefits Crossrail has
applications) in the 500m and 1km areas around brought / is bringing to station locations, and how
stations along the route. this is able to unlock regeneration in order to meet
Mayoral objectives.
2.11 The 2012 and 2014 studies identified the influence
of Crossrail on property market dynamics and on
the nature and scale of development close to the
Elizabeth line stations, including;
• Impacting investment decisions (therefore
accelerating new development); Almost two-thirds of stations along
• Creating additional residential and commercial value the route are consistently seeing
(£5.5bn along the route from 2012-21); higher construction rates than the
• Supporting the delivery of new homes and boroughs within which they sit.
commercial office space;
• Seeing urban realm improvements which are driving
further development activity;
• Directly providing support for new development
proposals (41% of applications referencing Crossrail),
through improved transport capacity or wider place
making and regeneration impacts
• Showing the significance of Crossrail in reinforcing
the strength of Central London property markets;
and
• The importance of its role in unlocking major
regeneration opportunities in weaker locations where
it provides a step change in accessibility to core
markets.
Artists impression of Liverpool Street Station
20 213
Value, Development
Pipeline & Development
Delivery Impacts
Artists impression of Bond Street Station
22 233.1 This section considers in detail the value impacts experienced to date and updates future projections of 3.6 Detailed value and locational dynamics underlying • Strengthening and accelerating growth: Ealing
value growth. The analysis uses the same methodology and builds on our previous research published in this strategic analysis provide an understanding of Broadway, Acton Main Line and Hanwell station
2012; it therefore provides a consistent and comprehensive review of impacts since 2012. why there is a lag in relative values along the West areas show strong value levels from the start of the
Section until the end of the forecast period. Two key period. Once the Elizabeth line service opens from
VALUE IMPACTS factors drive the relationship: 2018, and over the remainder of the projection period,
Residential Market their level above the line section average continues
3.2 The impact of Crossrail on property value has been • There are significant value differentials between
3.4 All locations along the route have already experienced to increase.
the focus of much analysis and debate. Research stations, with a high number of west London stations
by a wide range of analysts, using a variety of positive value impacts as a result of Crossrail, with located in lower value locations such as Southall • Moving closer to area averages: a number of
methods, has suggested that the scale of impact values in the West, Central and East sections expected and Hayes. stations (such as Hayes & Harlington and Southall)
will be considerable across both residential and to exceeded market benchmarks by 2026. Beneath have lower starting values, which do not appreciate
this strategic trend there are some key distinctions • There are also significant value differentials between
commercial property. sufficiently to exceed the area benchmark. However,
in the timing of these impacts for each of the three the station zones and the wider borough within
Crossrail is important in narrowing the value gap,
3.3 Our 2012 Study suggested that, on average, residential which they lay, for example Maidenhead is one of
line sections. helping support development in these locations.
values would increase by between 20% and 25% over the lower value parts of the wider RB Windsor and
a rising baseline, whilst commercial values would rise 3.5 Within the West Section average values within Maidenhead area. 3.8 Within the Central Section, average values around
by between 17% and 20%. station locations (West Station Average) start from the stations started above the benchmark and
a significantly lower base than the borough averages 3.7 Drilling down to the station specific level, and
accelerate away from it over time, as shown below.
(West Benchmark) for that part of the Elizabeth line immediate areas of influence, key trends are as
This is largely due to stations occupying prime
route, however as shown below by 2026 average follows:
locations, with lower-value areas further away.
values will be marginally above their benchmark. • Stations whose relationship to the benchmark This is reflected in the analysis for Liverpool Street,
changes: Maidenhead and Twyford both start at where the 1km values remain below the benchmark,
values below the West Station average but increase whereas 500m values are above.
above it between 2017 and 2020. This suggests the
timing of the Elizabeth line opening is particularly
Figure 2: Average annual achieved and forecast residential property prices in West Section Zones of Influence and
benchmark market areas (2012-2026) important for the performance of the residential
market in these locations.
£700,000
Figure 3: Average annual achieved and forecast residential property prices in Central Section Zones of Influence and
benchmark market areas (2012-2026)
£600,000
£2,500,000
£500,000
£2,000,000
£400,000
£300,000 £1,500,000
£200,000
£1,000,000
£100,000
£500,000
£0
2012 2013 2014 2015 2016 2017 2018 2019 2020 2021 2022 2023 2024 2025 2026
West Benchmark West Station Average £0
2012 2013 2014 2015 2016 2017 2018 2019 2020 2021 2022 2023 2024 2025 2026
Source: HM Land Registry & GVA Analysis, 2017
Central Benchmark Central Station Average
Source: HM Land Registry & GVA Analysis, 2017
24 25All locations along the Elizabeth line route have
already experienced positive value impacts, with values
expected to exceed market benchmarks by 2026
3.9 Both Liverpool Street and Farringdon will see a 3.12 Residential market value performance is broadly 3.14 Key station-specific findings from 2012-16 achieved 3.15 For each line section, more detailed value projection
significant change in their value relationship with the consistent when comparing the 500m and 1km zones house price data and 2017-26 projected house price charts which show the stations where strong values
Central Section benchmark. Historically values here of influence, but the key difference when considering data – based on the 500m zone of influence around are being reinforced, weak values are continuing, and
have tended to be below the benchmark but by the the 1km zone of influence is that Liverpool Street stations – are as follows: value change is transforming markets are provided in
time of opening both will begin to see values that tracks just below the Central Section average rather Appendix II.
• Stations whose relationship to the benchmark
equal or exceed it. than above it.
changes: Custom House, Abbey Wood, Stratford, 3.16 By comparing the Crossrail enhanced value forecasts
3.10 Across the whole Central Section major value 3.13 The most significant change and impact on Forest Gate, Ilford, Gidea Park, Harold Wood, to a baseline forecast (drawing on Knight Frank’s UK
impacts have occurred much earlier than the outer residential values will occur within the East Section, and Brentwood all start at values below the East residential market forecast) it is possible to isolate
sections, reflecting the strength in value terms where values will shift from significantly below the Section average, but increase above it between the potential scale of the Crossrail impact. This
ofthese markets and the influence of a wider set benchmark to significantly above it. The timing of 2016 and 2024. These (alongside Shenfield, which is suggests there will be an average value uplift of
of factors on property value. this change is more closely aligned with the opening consistently above the benchmark) drive the value c.29% along the Elizabeth line route to 2026.
of the Elizabeth line route, suggesting Crossrail is dynamics shown left.
3.11 Residential values in Canary Wharf and Whitechapel 3.17 By comparing the 2016 achieved residential value for
a more critical driver in the East than the West or
continue to be below the line section benchmark • Moving closer to area averages: The majority of Elizabeth line station locations, with the value that
Central sections.
across the period. This is a departure from the 2012 stations along the East Section have values below was projected for 2016 in the previous GVA study
findings which suggested Canary Wharf would ‘catch the benchmark, largely as a result of the significantly (2012), it is evident that 28 out of 40 have on average
up’; the continued lag appears to reflect stronger higher values achieved in some of the wider borough already achieved or exceeded the anticipated value
than expected growth in the benchmark rather than areas. However, by the end of the period, all stations growth projected. The total achieved residential
lower performance within Canary Wharf as well as achieve values closer to the higher benchmark. value in 2016, at £18,360,845, reached c.35% above
limited capacity and opportunity to deliver new the 2012 projection of £14,377,500.
development at Canary Wharf until the Elizabeth
line opens.
Figure 4: Average annual achieved and forecast residential property prices in East Section Zones of Influence and
benchmark market areas (2012 – 2026)
£700,000
£600,000
£500,000
£400,000
£300,000
£200,000
£100,000
£0
2012 2013 2014 2015 2016 2017 2018 2019 2020 2021 2022 2023 2024 2025 2026
East Benchmark East Station Average
Artists impression of Woolwich Station
Source: HM Land Registry & GVA Analysis, 2017
26 27Office Market3 Figure 7: Average annual achieved and forecast office rents in Central Section Zones of Influence
and benchmark market areas (2012 – 2026).
3.18 For the office market, by comparing the rental 3.21 However, despite this over-arching trend the strong
forecasts for each station zone of influence and the markets do diverge. Locations such as Ealing
forecast for average achieved rent across defined Broadway, Slough, Maidenhead and Reading achieve £1,000
benchmark market locations, a stark difference parity and exceed the wider average, suggesting
in the performance between Central and Outer Crossrail will reinforce their role as key office centres.
£800
sections becomes evident.
3.22 As shown in the chart below, within the Central
3.19 The core influence of Crossrail in value terms Section averages for station areas are below those
£600
appears to be that it reinforces the strongest for the benchmark; however by the end of the period
markets and, whilst helping rents elsewhere, does the size of the gap has been significantly reduced.
not fundamentally alter the hierarchy of office £400
markets or values already in existence. We explore
some of the impacts of this in Section 7.
£200
3.20 Within the West Section values close to stations,
on average, are anticipated to remain below those Locations such as Ealing Broadway,
of the benchmark markets, however the gap does Slough, Maidenhead and Reading £0
2012 2013 2014 2015 2016 2017 2018 2019 2020 2021 2022 2023 2024 2025 2026
close significantly over time. This reflects the lack
of a significant office market in many locations in
achieve parity and exceed the wider
the West section, which tend to act as a ‘drag’ on average, suggesting Crossrail will Central Benchmark Central Station Average
average values. reinforce their role as key office centres Source: CoStar Focus & GVA Analysis, 2017
Figure 6: Average annual achieved and forecast office rents in West Section Zones of Influence and
benchmark market areas (2012 – 2026) 3.23 The core influence in the higher benchmark figure is 3.25 Individually Stratford is the only location that will
the inclusion of ‘super prime’ markets in Mayfair which exceed the benchmark over the period to 2026, along
£300 drive the higher average, particularly when compared with Maryland (which captures some of the Stratford
with the lower values in the Whitechapel and Isle of market area) and which will see values increase to a
Dogs area. However individual station locations at point where they almost equal the benchmark in the
£250
Bond Street and Tottenham Court Road will exceed 500m zone of influence and exceed the benchmark
the section average and benchmark average levels in the 1km zone of influence.
£200 (shown in the detailed charts in Appendix II), whilst
3.26 The only other areas where there is expected to
Farringdon and Liverpool Street will become broadly
be a notable impact on office market rents are
equal to it. The improvement highlights another
£150 Custom House, Brentwood, Romford and Ilford –
influence of Crossrail, which is to draw more areas
those locations where there is some scale of activity
fully into the Central London market, altering demand
already - although these markets have experienced
£100 dynamics and reducing rent differential across
challenges over the past decade. These locations
Central London.
will see improvements to their own position relative
£50 3.24 The East Section shows the greatest differential to their individual benchmark.
between the station locations and the Benchmark.
This is unsurprising given that outside of Stratford
£0 there is little office activity or presence at significant
2012 2013 2014 2015 2016 2017 2018 2019 2020 2021 2022 2023 2024 2025 2026
scale. The performance of Stratford significantly
distorts the line section average.
West Benchmark West Station Average
Source: CoStar Focus & GVA Analysis, 2017
3
It should be noted that the analysis of office rental growth is limited by the availability of data in some locations due to the small
scale of local markets and the lack therefore of transaction data. This can distort the value growth trend line of individual station
locations, and the variation in values between different station locations.
28 293.27 Comparing the Crossrail location forecasts to GVA’s 3.29 For each line section, more detailed value projection 3.35 In floorspace terms the floorspace split within each 3.36 Residential development is still considerable within
in house office market forecasts it is possible to charts which underpin the findings discussed above line section is shown in the chart below. It is clear the Central section, however the commercial function
estimate the scale of additional value Crossrail itself are provided in Appendix II. that Crossrail is playing a major role in supporting and dominance is underlined by the scale of office
creates along the route for station locations where residential development in Outer London with it and retail space permitted, representing a greater
there is sufficient activity to establish a robust base. being the dominant type of floorspace coming share of total floorspace than residential.
On average the additional value created by Crossrail forward in both the West and East sections.
will be c.14%.
3.28 Comparing the 2012 forecast for values in 2016 to For the key office markets along
Figure 10: Residential, office and retail floorspace in major consented schemes in line section Zones
achieved values in 2016 provides an indication of how the route values tend to outperform of Influence and combined along the Elizabeth line route (2008 – 2016)
the markets have performed against expectation.
Comparable data only exists for 11 stations, in the
expectations
main these tend to show values outperforming Whole Line
expectations, with the exception of Canary Wharf,
where value growth has been slower than expected. West
This is likely to be a result of limited new capacity
to deliver additional stock prior to the opening of
Central
the Elizabeth line station.
East
DEVELOPMENT PIPELINE
3.30 This section considers in detail the impacts Crossrail has had on development capacity and delivery across 2,000,000 4,000,000 6,000,000 8,000,000 10,000,000 12,000,000 14,000,000
the Elizabeth line route. The analysis uses the same methodology and builds on the previous 2014 Study; it Total Estimated Floorspace (sqm)
therefore provides a consistent and comprehensive review of development since 2014.
Residential Office Retail
3.31 This analysis is then extended to consider not only 3.33 In 2014 our research identified that in the period between Source: EGi & GVA Analysis, 2017
the scale of development permitted but whether 2008 and mid-2013 Crossrail had helped in the creation
Crossrail is helping to quicken the pace of delivery. of new consents that would deliver over 65,000 new
homes and 3.5m sqm of commercial floorspace. 3.37 At the station specific level there are even more stark
Consented Development differences in the scale and mix of development
3.34 Our new analysis shows that between 2008 and 2016
3.32 Unlike value impacts there has been a lower level of coming forward. Between 2008 and 2016 period the
there has been significant development activity around
analysis of the impact Crossrail has on development pipeline is dominated by Canary Wharf (largely a
Elizabeth line stations, in total these schemes have the
capacity itself. Whilst a number of organisations have result of the Wood Wharf master consent), Custom
capacity to deliver:
produced research that ‘implies’ a certain level of growth House, Liverpool Street and Stratford (largely the
will come forward, very few have sought to quantify this. Olympic Legacy projects).
90,599 4.44m 446,646
residential units sq m office floorspace sq m of retail
(which equates to floorspace
369,055 jobs)
30 313.38 These results are shown in the bar chart below, which 3.40 The majority of permitted development floorspace 3.41 Over the 2008-16 period 48% of permitted planning 3.43 This reinforces the assertion that the influence of
also allows comparison to the predicted scale and along the Elizabeth line route is residential. However, applications within a 1km radius of Elizabeth line Crossrail has continually increased over time as we
nature of impact established in the 2012 study. Liverpool Street, Bond Street, Farringdon, Tottenham stations have made direct reference to Crossrail move closer to full route opening.
Court Road and Reading are exceptions to this, supporting their proposals in their planning
3.39 Whilst there is some variation in broad terms a large
reflecting the strength of the office markets in application documents. This proportion has
number of locations have reacted to Crossrail in
the manner expected, the main exceptions being
these locations. Retail floorspace is more limited
and evenly spread across all stations, suggesting
increased continually as the study period has
progressed, as shown in the chart below.
Our new analysis shows
Ealing Broadway and Abbey Wood where much
it may be much less influenced by transport that between 2008 and 2016
more significant impacts were expected. However 3.42 Over the 2008 – 2013 period (used for GVA’s previous
it is worth noting that whilst development has not
accessibility.
study) 40% of applications made direct positive there has been significant
yet been delivered in these locations both areas reference to Crossrail, whereas this increased to development activity around
have benefited from significant value uplift. Factors 58% over the 2013 – 2016 period (used for this study).
influencing these locations are considered later in Looking at the start and end of the combined study Elizabeth line stations
this report. period, in 2009 15% of applications made direct
positive reference to Crossrail, but by 2016 this
had increased to a high over the period of 67%.
Figure 11: Residential, office and retail floorspace in major consented schemes in Zones of Influence
along the Elizabeth line route (2008 – 2016)
Figure 12: Annual count and proportion of major consented schemes in Zones of Influence along the
Slough
Elizabeth line route with and without Crossrail reference (2008 – 2016)
Southall
Ealing Broadway
Tottenham Court Road
Number of Applications % of Applications
Farringdon
Whitechapel 100 80%
Canary Wharf
Custom House
Woolwich
70%
Abbey Wood
80
Maidenhead 60%
Heathrow Airport
Hayes & Harlington 60 50%
Paddington
Bond Street 40%
Liverpool Street
Stratford 40
Ilford
30%
Seven Kings
Goodmayes 20%
Romford
20
Brentwood
10%
Shenfield
Reading
Twyford
0 0%
Taplow
2009 2010 2011 2012 2013 2014 2015 2016
Burnham
Proportion of Schemes
Langley
Crossrail Reference No Crossrail Reference
Iver with Crossrail Reference
West Drayton
Hanwell
West Ealing Source: EGi, Local Authority Planning Websites & GVA Analysis, 2017
Acton Main Line
Maryland
Forest Gate
Manor Park
Chadwell Health
Gidea Park
Harold Wood
0 500,000 1,000,000 1,500,000 2,000,000 2,500,000 3,000,000
Residential Office Retail
Source: EGi & GVA Analysis, 2017
32 333.44 Within those schemes that use Crossrail as part of their justification there is the capacity to deliver: 3.51 Whilst we recognise Crossrail is not solely responsible 3.52 As shown below 16 of the stations show a greater
for the commencement of development schemes proportion of permitted schemes which have started,
along the route, there is evidence to suggest compared to the proportions which have started at
that there is some alignment between improving the wider borough level. These stations are shown
accessibility and development activity. in bold in the following table.
66% 68% 57% Figure 13: Delivery progress of residential, office and retail floor space in major consented schemes
in Zones of Influence along the Elizabeth line route (2013 – 2016)
West Drayton
Heathrow
Hayes & Harlington
Southall
residential units office floorspace – 3.1m retail floorspace - Hanwell
(59,357 units) sq m of 256,398 sq m West Ealing
Ealing Broadway
new space Acton Main Line
Paddington
Bond Street
Tottenham Court Road
3.45 Since 2013 there have been some significant 3.46 The 2012 Study, based on Local Plan policy based Farringdon
Liverpool Street
trends. For example Southall, Abbey Wood, Hayes figures, indicated that Crossrail would help support Whitechapel
& Harlington, Ilford, Seven Kings, Goodmayes, 57,000 new homes and 3.25m sqm of commercial Canary Wharf
Stratford
Romford, and Brentwood, all have 100% of permitted office floorspace. This Study’s updated analysis Maryland
Forest Gate
schemes referencing Crossrail as important for of permitted schemes suggests that development Custom House
the development. Conversely Chadwell Heath and capacity supported by Crossrail has increased to Manor Park
Ilford
Burnham have no proposals where Crossrail is used 90,599 new homes and 4.44m sqm of commercial Woolwich
as a justification. office floorspace. Seven Kings
Goodmayes
Abbey Wood
Chadwell Heath
Romford
DEVELOPMENT DELIVERY Gidea Park
Harold Wood
3.47 The analysis of permitted schemes provides a useful understanding of how Crossrail is influencing the 200,000 400,000 600,000 800,000 1,000,000 1,200,000 1,400,000
development pipeline. However, it is limited in demonstrating that Crossrail is actually an agent for change
on the ground. To do this, analysis of development delivery rather than planning consent is required. Not Started Started and Completed
3.48 For the majority of station areas along the route a 3.50 To estimate the specific influence Crossrail has (if Source: London Development Database & GVA Analysis, 2017
higher proportion of schemes permitted between any) we have compared the proportion of started
2013 and 2016 have been started or completed, schemes within 1km of a station to the borough
than have been permitted and are yet to begin average. Whilst this does not provide an entirely
construction – this suggests that Crossrail is helping comparable benchmark4 in terms of the time periods
create conditions where delivery is more certain. considered by the different datasets, it uses the best
available data to give an indication of how the start
3.49 However there are some exceptions to the overall
rates in Elizabeth line station areas compare to
trend. Southall, Acton Main Line, and Abbey Wood
borough wide performance.
are notable exceptions where there has been limited
4
In terms of comparability between datasets in this benchmarking exercise the following factors must be noted:
development activity when compared to permissions
granted. In part this may reflect the complexities of • The LDD data is for schemes permitted between July 2013 – Dec 2016, whereas the AMR data is for the total development pipeline
bringing some of the opportunities forward, it may (all permitted schemes which have not yet been completed, which could therefore include applications which date further back
than July 2013)
also reflect the less mature markets in these areas,
which have taken longer to strengthen. • The LDD data is filtered to include significant schemes (at least 20 residential units) whereas the London AMR data has no size
filter for permitted schemes.
34 35Table 2: % of residential units that form part of started/completed major consented schemes in 3.53 Within the East line section 79% of residential units 3.54 As shown left, Crossrail appears to be having the
Zones of Influence along the Elizabeth line route (2013 – 2016)
permitted within 1km of Elizabeth line stations largest influence in the East, which is unsurprising
have started, compared to only 51% in the relevant given the scale of the transport improvement it
% of started residential units within % of started residential units within
boroughs. In the Central and West line sections this delivers for a number of locations. In the West, where
the 1km Zone of Influence the wider Borough Benchmark
relationship is reversed within 66% compared to connections are already perceived to be stronger
West Drayton 86% 73% 74% in the Central section and 37% compared to (despite the West and East line sections actually
56% in the West section. However, as a total along having very similar transport accessibility when
Hayes & Harlington 89% 73%
the Elizabeth line route 70% of permitted residential measured using Public Transport Accessibility Level
Southall 13% 50% units within 1km of new stations have started, (PTAL) scores), development has tended to come
compared to only 59% in the wider boroughs. forward quicker and current lags may be as much
Hanwell 53% 50%
a function of specific site conditions as a limited
West Ealing 35% 50% influence from Crossrail.
Ealing Broadway 50% 50%
Acton Main Line 13% 50%
Paddington 79% 59% OVERALL QUANTITATIVE IMPACTS
Bond Street 62% 59% 3.55 The value impact, development pipeline and development delivery findings from this Study, identified
above, update the analysis from the 2012 and 2014 studies, however it is useful to draw comparison
Tottenham Court Road 36% 66% between findings to determine whether stations have performed as expected and predicted in 2012
Farringdon 68% 83% and 2014, to identify any deviations from these expectations, and to highlight any spatial differences
in the findings along the route which show that the nature of certain locations may have changed as
Liverpool Street 33% 83%
development of the Elizabeth line route has progressed.
Whitechapel 76% 74%
3.56 Whilst broadly the conclusions of the 2012 study • Whitechapel – permitted floorspace in Whitechapel
Stratford 70% 43% appear to be holding true, there are number of has been modest throughout the whole 2008 – 2016
Maryland 0% 43% station locations that require a deeper understanding period, and has not seemed to realise the potential
to be developed in order to understand their for this location considering its site and regeneration
Forest Gate 0% 43%
response to Crossrail: opportunities. There are a range of potential reasons
Manor Park 100% 46% for this, which are explored in more detail in later
• Ealing Broadway – has seen an increase in permitted
sections.
Ilford 33% 46% floorspace in 2013-16, but the total floorspace
permitted from 2008-16 remains modest considering • Hayes & Harlington – has seen a much lower level
Seven Kings 38% 46%
its connections and accessibility. This may reflect the of permitted floorspace between 2013 – 2016 than
Goodmayes 100% 46% maturity of the residential market in the area and the over the earlier study period (2008 – 2013), this may
fact that Crossrail is so far having limited impact on reflect the nature of the development opportunities
Chadwell Heath 87% 46%
commercial sectors. in the area which are, in the main, concentrated on a
Romford 55% 46% small number of very large sites such as the Old Vinyl
• Stratford – had the largest permitted development
Factory. There is continued development interest
Gidea Park 0% 46% pipeline between 2008 and 2013, but has remained
which is driven by the improving connectivity to
almost static since. This is unsurprising given the
Harold Wood 100% 46% Central London.
burst of permissions that occurred around the time
Canary Wharf 86% 74% of the 2012 Olympics and the legacy masterplan.
This provided significant development capacity that
Custom House 100% 43%
has yet to be fully delivered or absorbed.
Woolwich 82% 54%
Abbey Wood 12% 54%
Source: London Development Database & GVA Analysis, 2017
36 373.57 The most significant impact on development 3.60 In the 2012 and 2014 Studies three different Figure 14: Crossrail Places to Watch based on value impact and development pipeline
(replicated from 2012 Study)
pipeline in the 2013 – 2016 data is for Canary Wharf, categories of ‘Places to Watch’ were identified
where further significant capacity has been unlocked, to reflect the levels of transformational impact of
Canary Wharf
adding to the already high levels of capacity created Crossrail on the property market in key locations;
by Wood Wharf. It is interesting to note the high Ealing Broadway Custom House
• Creating Change: where a substantial change in Tottenham Court Road
proportion of floorspace permitted which is for
current development quantities and types of land
Creating
Slough Woolwich
residential use in what has traditionally been an
use can be expected;
Change Whitechapel
office location.
• Reinforcing Directions: where support is given to Southall Farringdon
3.58 L ooking more closely at the type of floorspace Abbey Wood
active, in-progress development programmes which
being permitted from 2008-13 compared to 2013-16,
reflect changing property values; and
there are several interesting shifts in the dynamics
of station locations in the Central Section. For both • Limited Impact: where little change to the current Bond Street
Liverpool Street and Farringdon there is a significant development context can be expected. Hayes & Harlington
Ilford
Paddington
increase in the amount of office floorspace being Reinforcing
3.61 This positioning of each Elizabeth line station, as Stratford Shenfield
permitted; Liverpool Street permissions were Direction Maidenhead Liverpool Street
Romford
identified in the 2012 Study is shown in Figure 14.
initially retail led but the area is now becoming Brentwood
more dominated by office consents, and Farringdon 3.62 The 2012 analysis (based on the value uplift and Heathrow Seven Kings
was previously an even office-residential split but is permitted development pipeline from the 2012
Goodmayes
now predominantly office dominated. Study) reflects that point in time, so to consider how
the scale and nature of transformation impact at West Ealing
Forest Gate
3.59 B ased on the development pipeline data analysed, Chadwell Heath
Elizabeth line stations is changing, we consider the Acton Main Line
the greatest influence of Crossrail in underpinning West Drayton
same categories in light of the updated analysis
new residential and commercial floorspace continues Limited Langley
Harold Wood
in this Study. The findings largely hold true in light
to be on the strongest existing market locations in Impact Hanwell
Maryland
of this Study’s findings, however there are four key Burnham
the Central section of the Elizabeth line route. The
moves for the following station locations (based on Gidea Park
West section, with the weakest existing markets, Taplow
the updated value uplift and permitted development Iver Manor Park
is seeing development activity supported by
pipeline in this Study):
Crossrail but this continues to see the most modest West Central East
development pipeline. In part this is a result of the • Ealing Broadway (down)
lack (in most locations) of large scale development Source: GVA Analysis, 2012
• Acton Main Line (up)
opportunities, with a finer grain approach to growth
required in many locations. However, this does not • Whitechapel (down)
mean Crossrail is not important in locations in the • Shenfield (down)
West and East line sections, instead it suggests that
3.63 These moves are shown in the form of arrows in the
the Crossrail influence takes longer to be realised
following Figure 15.
The most significant impact on development pipeline in the
in weaker markets, which is explored further in a
later section. 3.64 The strongest performing stations (where value
2013 – 2016 data is for Canary Wharf, where further significant
growth is strongest and the most significant pipeline capacity has been unlocked
is identified) are where Crossrail can be seen to be
Creating Change. These locations include Farringdon,
Canary Wharf, Abbey Wood and Custom House –
this reflects the conclusions in 2012.
38 39You can also read