PATHWAY TO VALUE CREATION - MCKINSEY & COMPANY
←
→
Page content transcription
If your browser does not render page correctly, please read the page content below

Pathway to value
                          creation
                          A perspective on how transportation and logistics
                          businesses can increase their economic profit

                          Travel, Transport & Logistics September 2015

Authored by:
Dr. Ludwig Hausmann
Ishaan Nangia
Dr. Thomas Netzer
Werner Rehm
Dr. Maximilian Rothkopf

Table of contents Executive summary 5 Introduction: Informing strategy with insights into value creation 8 Why insights into value creation are more important than ever 8 What this publication is about 8 Where has value been created? Lessons from the past and expectations for the future 10 How has the sector performed? Through-cycle returns to shareholders 11 How has value been created? Understanding the drivers of economic profit in transportation and logistics 13 What are the market’s expectations for transportation and logistics? Current valuation and growth forecasts 18 What drives future value creation? Global megatrends shaping the transportation and logistics sector 20 Shifting growth patterns: Megacities and emerging trade routes 21 Shared transportation: New solutions from unexpected competitors 23 The future is now: The digital frontier 24 The race for efficiency: Burdening capex as a prerequisite for competitiveness 25 Rules of the game: The impact of deregulation on growth and competition 27 Size matters: Consolidation and cooperation across the network 28 Turbulent times: Increased volatility of demand and input factors 28 What does it take to win? Five ingredients for value creation 30 Be agile in resource allocation and reallocation 31 Resolve the asset dilemma 32 Make your digital transformation a success story 33 Develop programmatic M&A and cooperation capabilities 35 Manage for an uncertain world 37 Appendix 40 Economic profit 40 Details on transportation and logistics sector ROIC, growth, and TRS 40 Sample and methodology 42 Pathway to value creation Table of contents 3
Executive summary
To unlock growth and profitability in a challenging sector, transportation and logistics
companies need to make bolder and more astute strategic choices than ever before. The
sector’s checkered history of value creation is counterbalanced by compelling lessons
from successful players in a range of transportation and logistics industries, both pre- and
post-crisis. For all of the upheaval facing the sector, a number of powerful megatrends will
create unprecedented opportunities to enter new markets and redefine existing business
models. The asset intensity and geographic breadth of transportation and logistics
companies will reward granular fact-based decisions about the markets in which to play,
city by city, route by route. This is an opportune moment for executives in the sector to
challenge whether their strategy will meet and outperform market expectations.

The authors of this report draw on proprietary macroeconomic and sector-specific research,
supported by “big data”-enabled analytical techniques from McKinsey’s global center of
excellence in strategy and corporate finance. We adopt a financial investor perspective by
taking an in-depth look at the capital market performance of 264 listed transportation and
logistics companies from around the world over a period of ten years. The findings provide
fact-based insights into the drivers of value creation, both before and after the economic
crisis, across eight industries that comprise the sector: airline, bus, freight forwarding, postal/
CEP (courier, express, and parcel), rail, shipping, trucking, and contract logistics.

Key findings
The through-cycle capital market performance of the transportation and logistics
sector is below investors’ requirements. Over the last ten years, the companies in our
sample have generated an average total return to shareholders (TRS) of 7.2 percent, a figure
well below the sector’s cost of capital (10.5 percent). Although the sample did produce
average to above-average revenue growth at a compound annual growth rate (CAGR) of
3.6 percent, the sector’s return on invested capital (ROIC) of 7.5 percent was lower than in
most other sectors.

Even in the worst-performing industries, successful players provide valuable
lessons for those seeking a pathway to economic profitability. Overall, companies in
the bottom 60 percent of the sample destroyed 3.5 times the economic profit created by
the top 40 percent. All is not lost, however. Individual “winners” in each industry have been
able to create value, typically by making bold strategic moves to boost margins and capital
efficiency. An example here is the large new aircraft orders placed by Ryanair and Easyjet
in a saturated intra-European air transport market – a bet that has paid off. Both companies
have delivered continuous value-creating growth through rigorous “clean sheet” cost control
and an unmatched asset productivity, benefiting from large-order discounts and highest-in-
class flight hours per day.

Improving ROIC is the key to overcoming investor skepticism about the sector and
increasing valuations. Market expectations for transportation and logistics are lower than
for the S&P 500 Index on average. Although growth expectations are weak, a poor ROIC in
particular drives valuation multiples of about 11 (versus 13.5 for the S&P 500). Transportation
and logistics players cannot simply grow their way out of the situation – addressing
comparatively low ROIC must be at the core of any value-creating strategy.

Pathway to value creation   Executive summary                                                         5
Winning strategies will make the most of seven megatrends that are shaping the
    transportation and logistics sector. The emergence of more and more megacities and
    new regional pockets of growth will change the places where transportation and logistics
    companies can fuel their organic growth. Shared transportation and disruptive technology-
    related solutions will generate new competition, but also new markets. Companies will face
    the challenges of understanding how the digital revolution will affect their business and of
    mastering their own digital transformation. Technological progress will require companies
    to make conscious choices about their asset intensity and investment program to avoid the
    “asset trap.” Rapidly changing regulatory and geopolitical environments will call for smart
    approaches to managing external relations in complex stakeholder landscapes. Finally, an
    increase in the volatility of demand and input factors will require greater strategic agility and
    flexibility than in the past.

    Ingredients for value creation
    To design and implement strategies to beat the market, senior executives of transportation
    and logistics businesses should ensure their strategies incorporate five crucial ingredients:

    Be agile in resource allocation. Companies that are better prepared to flexibly reallocate
    resources are more successful in generating a higher TRS. Nowhere is this more true than
    in the geographically diverse network industries of the transportation and logistics sector.
    In this largely asset-intensive business environment, huge strategic bets have to be made
    – and run the risk of even greater misallocations. Yet 90 percent of companies’ allocation
    decisions are anchored on “last year, we …” approaches. Few transportation and logistics
    companies have been more agile in reallocation recently than Singapore Post – cutting
    capital expenditures (capex) for the traditional mail business and even divesting several
    printing and mailing businesses to allow for bold investments into the growing e-commerce
    logistics business, expanding coverage across Southeast Asia. Executives can unlock the
    benefits of agility by overcoming common barriers that hinder flexible resource reallocation –
    typically, a lack of intent, an inadequate process, and a lack of the right skills and mindsets.

    Resolve the asset dilemma. Our analysis suggests that the flexibility provided by financial
    leases rarely justifies the premium asset-intensive companies pay for them, implying that
    many transport companies could outperform competitors by owning a larger part of their
    core fleet. A through-cycle procurement strategy is also required to overcome pro-cyclical
    asset purchases that create vicious cycles of capacity influx in times of lower demand.
    An understanding of the enormous efficiency gains in the newest equipment models helps
    avoid the “asset trap,” i.e., sinking money into transport equipment or infrastructure that
    rapidly loses value and/or becomes obsolete. A shipping line has saved 5 percentage points
    on the costs of adding new asset capacity relative to competitors by consistently better
    timing its vessel purchases through the cycle for the last 15 years, thereby avoiding having
    to pay the substantial price premium that is charged during “order booms.” Also, the first
    movers into innovative asset pooling concepts, starting with aircraft engine pools, have been
    rewarded with higher capital efficiency.

    Make your digital transformation a success story. Almost every company is facing the
    pressure of digitally enabled change from customers, new competitors, and shareholders.
    Turning a potential threat into an opportunity will require each company to define a digital
    strategy tailored to its own value drivers, and to make its transformation a success on its

6   Pathway to value creation   Executive summary
own terms. Instead of just “adding” digital outside of existing structures, corporations can
create much more value from digitization if they build on their existing assets and strengths
(product portfolio and product development team, existing customer relationships,
company assets, and business-building approaches). For most companies, this will mean
defining and executing objectives that digitize their core processes, reinforce the IT
foundations of their business model, and stake a claim along new frontiers. The latter could
reach from digital auxiliary products (“Is the data your new product?”) to partnering with
digital giants to develop completely new solutions.
Develop programmatic M&A and cooperation capabilities. Transportation and logistics
players have been active consolidators with a bias for using M&A as the predominant
source of growth. The sector’s current “firepower” (i.e., excess cash and debt-raising
capacity) means that many companies stand to benefit from considering additional M&A
opportunities. Instead of chasing “the one big deal,” companies will need to develop a
programmatic capability to identify, execute, and integrate attractive acquisition targets –
just as many of the leading freight forwarding and contract logistics players have being doing
since the year 2000. In addition, companies will need to continue to use alliances to access
new markets and capabilities in a cost-effective way.
Manage for an uncertain world. Now more than ever, a market-beating strategy will
often mean departing from a company’s traditional markets and experience. Doing so
prudently will require executives and boards to be explicit about building the assessment
and management of risk and uncertainty into the strategy process. Among sources of
uncertainty, changes in regulation can put substantial value at risk. Mitigating the negative
impact of regulatory change, and capturing the opportunities it creates, requires a
company to rigorously map its stakeholder landscape, engage stakeholders with the right
mindset and fact-base, and build crack external affairs capabilities and resources. This
will be particularly important for incumbents and entrants in the most regulated industries
within T&L – postal services (under the universal service obligation) and passenger rail –
but this is no less critical for carriers reliant on access to public transport infrastructure
such as ports and airports.
This report aims to equip executives in the transportation and logistics sector with a fact
base on historic capital markets performance and insights into sector-shaping trends.
Blending the five strategic ingredients into a compelling strategy will require ambition to
outperform the market, tailored analytics, granular understanding of individual markets,
and flawless judgment. Executives who are able to combine these inputs will have mixed a
potent cocktail that has every chance of beating the market.
Pathway to value creation Executive summary 7Introduction: Informing strategy with insights into value creation
The continuing negative effects of the most recent crisis, combined with the influence
of a number of disruptive trends, have made strategic positioning even more critical for
transportation and logistics companies.
Why insights into value creation are more important than ever
Growth and return on capital drive cash flows and are the fundamental ingredients of value
creation. The goal of a well-crafted strategy is to increase one or both by identifying sources
of competitive advantage that place the company ahead of trends and drive superior
performance. The asset intensity and geographic breadth of most transportation and
logistics companies mean portfolio choices are fundamental to performance and cash flow.
These factors also mean that having a fact-based perspective on how the industry creates
value is a particularly important input into strategic decisions.
In capital-intensive businesses, such as transportation and logistics, the foundational
principle for success is to have a clear line of sight on how much profit over the cost of
capital (“economic profit”) an investment will create through the cycle. Most companies
in the industry have to invest significant amounts just to stay in business – for instance, to
comply with tighter emission standards, to maintain and expand distribution networks, and
to launch new and more convenient services. The annual investment required to renew
the fleet and other assets to operate the network often exceeds cash flow. Not investing is
often not an option because the efficiency gains from new generations of assets are critical
to defending and strengthening competitiveness.
Against this backdrop, the transportation and logistics industry faces the continuing
negative effects of the 2008/09 crisis, combined with new turbulence in the energy and
currency markets. Disruptive forces, such as the shift in geographic growth to emerging
markets, digitization-driven challenges to established business models, and shifts in
regulation, pose a series of new opportunities for the sector, but realizing them requires
additional capital-intensive bets that must pay off. As transportation and logistics
companies confront new choices and trade-offs, financial analysis of past performance
can provide a fact-based reference point.
What this publication is about
The aim of this report is to provide a thought-provoking perspective on how value is created
(and destroyed) in the transportation and logistics industry and which key trends are likely to
affect the sector in the future. To support decision makers, we identify overarching patterns
among these trends and draw out possible courses of action to guide strategy development
and planning. The report also describes some tools and methods that can help leaders
define and execute their strategies.
The perspectives and ideas in this report draw on McKinsey’s strategy and corporate
finance methods and global experience in the transportation and logistics sector as well
as on in-depth analysis of 264 listed companies in the sector utilizing new “big data” and
advanced analytical techniques. The insights in this report reflect proprietary research,
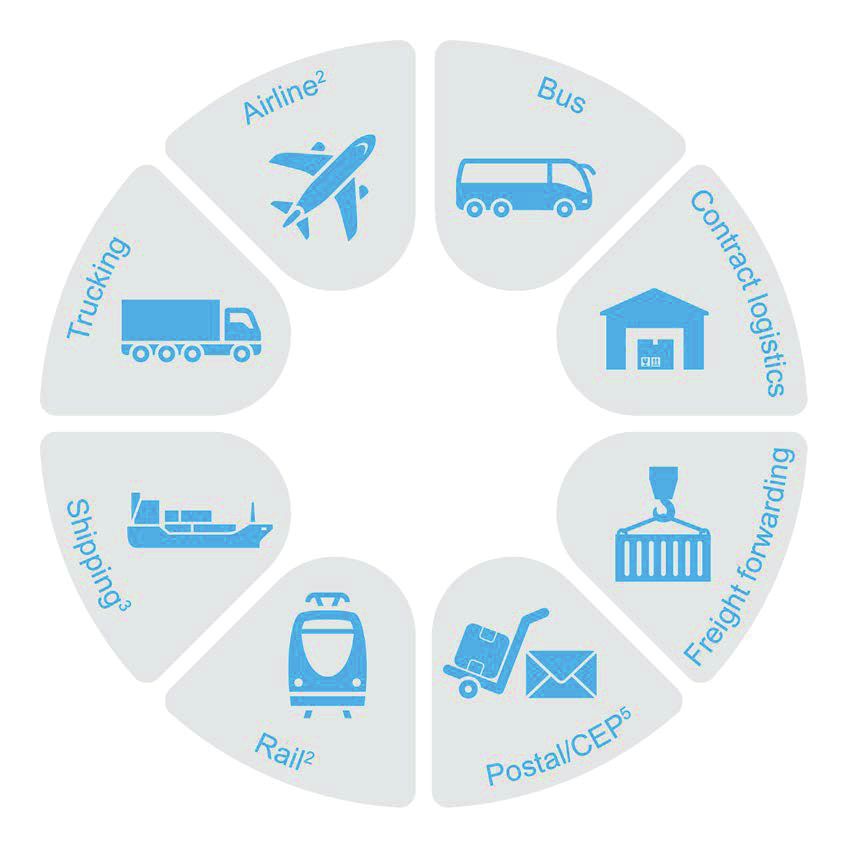
analysis, and market surveys covering the sector’s eight major industries: airline, rail, bus,
shipping, trucking, postal/parcel/express services, freight forwarding, and contract logistics
(Exhibit 1). These industries address different steps of the value chain, have disparate
structures and different asset intensities, and each faces different trends and issues.
8 Pathway to value creation IntroductionHowever, the eight industries all have two features in common: they are all dedicated to the
physical movement of goods and/or people. They are also set up as network businesses,
relying on (transport) infrastructure, dealing with a high share of fuel/energy costs, and often
providing time-critical and perishable services.
Exhibit 1
Split by industries
Sample of 2641 transportation & logistics companies
78 14
51 30
49 36
284 18
1 Figures do not add up as some companies are allocated to more than 1 industry 2 Passenger and cargo 3 Tanker, bulk, and container
4 Excluding Japanese rail companies due to uncommonly high network investments distorting an insightful comparison to other rail companies globally
5 Post, courier/express/parcel
SOURCE: McKinsey
This report is structured in three chapters:
Chapter 1: Where has value been created? An overview of historic returns to shareholders,
a breakdown of drivers of economic profit, and implicit market expectations for the sector
Chapter 2: What drives future value creation? Global megatrends impacting sector
momentum – comprising both challenges and opportunities
Chapter 3: What does it take to win and beat the odds? Five ingredients that must be
explicitly considered in any value-creating strategy.
Pathway to value creation Introduction 9Where has value been created?
Lessons from the past and
expectations for the future
While the post-crisis “new normal” for the transportation and logistics sector is tougher
than for most other industries, there are still clear winners and losers.
10How has the sector performed? Through-cycle returns to shareholders
From 2004 to 2013, the transportation and logistics sector generated returns to
shareholders below its cost of equity. While the sector generated average rates of revenue
growth, its ROIC lagged other sectors.
Over the last economic cycle, the capital markets performance of the transportation and
logistics sector was well below the rate of return required by equity investors. TRS is defined
as the accumulated performance of a company’s shares over time, taking into account both
share price appreciation and dividends paid. Over the last ten years, the sector has achieved
an annual TRS of 7.2 percent relative to its estimated cost of equity of 10.5 percent.1 By
contrast, the best-performing sector, biotechnology, achieved a TRS of 16.5 percent per
annum over the same period; heavyweight traditional sectors also generated a much
healthier TRS (e.g., chemicals (10.7 percent), retailing (9.7 percent), utilities (9.6 percent)).
Three distinct patterns of industry performance have emerged over the last three economic
phases (pre-crisis (2004 to 2007), crisis (2008 to 2009), and post-crisis (2010 to 2013))
(Exhibit 2):
Down and up again. The top three performers (rail, freight forwarding, and contract logistics)
fell from TRS at high pre-crisis levels (22 to 31 percent per annum) down to double-digit
negative TRS during the crisis. However, post-crisis, they managed to partially rebound,
achieving 50 to 75 percent of their pre-crisis performance (i.e., stable double-digit TRS values).
Exhibit 2
Different patterns of recovery from crisis by transportation & logistics industries
Total return to shareholders (TRS) 2004 - 07
USD, percent, annualized 2008 - 09
15.8 2010 - 13
8.6 Cost of equity 10.5
7.2 6.7 7.2
6.0
4.2 4.3
Through-
cycle, 0.5
2004 - 13
31
26 24 25
18 18 18 20
16 17
12 13 11
5 4 6 5
0
By phases
-3
-7
-11
-15 -15 -15
-24 -21
-27
Rail Freight Contract Trucking Postal/ Bus Airline Shipping Transpor-
forwarding logistics CEP tation &
logistics
Down and up again Phoenix from Downward trajectory
the ashes
SOURCE: McKinsey Corporate Performance Center
1 Derived applying the risk-weighted sector beta of 0.9 for equity holders to the sector WACC (weighted average
cost of capital) of 9 percent at an average debt/equity share of 30:70 percent; beta is a measure of the volatility
of a stock’s returns relative to the equity returns of the overall market
Pathway to value creation Lessons from the past and expectations for the future 11Phoenix from the ashes. Trucking and postal/CEP are the exceptions to the story. Starting
from a low single-digit TRS pre-crisis, they emerged from the 2008/09 turbulence to
increase their TRS to nearly four times their pre-crisis levels.
Downward trajectory. The bottom three performers (shipping, bus, airlines) started with
the high TRS (20 to 30 percent per annum), but destroyed almost as much value during the
crisis. Post-crisis, average annual TRS has remained flat at 0 to 5 percent.
Investors’ returns are ultimately driven by a company’s growth and profitability. In the trans-
portation and logistics sector, analysis reveals that the sector as a whole has grown
revenues in line with other industries, with some industries such as rail, airlines, and freight
forwarding even exceeding comparators. At the same time, however, the ROIC achieved
by the sector ranks among the lowest across all industries, a remarkably consistent picture
(Exhibit 3).
However, even within troubled industries, some individual companies stand out as winners,
achieving ROIC well above their peers. The next section explores how these companies
have created value.
Exhibit 32
Revenue growth vs. ROIC, 2004 - 13
Percent
Revenue growth, CAGR1
7
Airline Rail
6
5
Freight forwarding
Transportation & Economy
4
logistics
Trucking Contract logistics
3 Shipping
Bus
2
Postal/CEP
1
0 5 10 15 20 25 30 35 40 45 95
ROIC (average)2
1 Real revenue growth, CAGR 2004 - 13, inflation adjusted
2 ROIC after tax, excluding goodwill; excludes outliers; average for 2004 - 13
SOURCE: Compustat; McKinsey Corporate Performance Center
2 For more details, please see appendix
12 Pathway to value creation Lessons from the past and expectations for the futureHow has value been created? Understanding the drivers of economic profit
in transportation and logistics
Although the sector has failed to generate positive economic profit, individual “winners” in
each industry have been able to create value. This can be attributed mostly to improvements
in margins and capital efficiency.
Economic profit effectively measures how much value a company creates over and
above its cost of capital,3 and change in economic profit is one of the key drivers of TRS.
Unsurprisingly, as seen in the sector’s TRS, the transportation and logistics sector as a
whole generated a negative economic profit over the last ten years.
Examining the companies in the sector at an individual level reveals an interesting dynamic.
The vast majority of transportation and logistics companies generate a small negative
economic profit. However, the bottom 60 percent of companies in the sector destroyed 3.5
times more value than the top 40 percent created, as illustrated by the industry’s “power
curve” (Exhibit 4). While it is possible to be a winner, companies in the bottom quintile lose big.
Exhibit 4
Average economic profit by company, 2004 - 13
USD millions
Quintiles Top Middle Bottom
I II III IV V
8,000
6,000
4,000
2,000
0 Transportation and
logistics mean -72
-2,000
-4,000
Transportation & logistics 135 6 (15) (72) (416) Average economic
profit
Utilities 146 (82) (259) (584) (1,599)
Retail 448 60 5 (38) (226)
Pharma and healthcare 3,022 366 101 7 (140)
Transportation & logistics 7,139 340 (783) (3,801) (21,963) Total economic
profit
SOURCE: McKinsey Corporate Performance Center
3 For more details, please see appendix and Koller, T., Goedhart, M., Wessels, D.: Valuation: Measuring and
Managing the Value of Companies, 5th Edition
Pathway to value creation Lessons from the past and expectations for the future 13If, on average, companies in the transportation and logistics sector destroyed economic
value, have the included industries at least improved over the cycle? Over the three time
horizons introduced earlier, only the postal industry achieved positive economic profit
both prior to and after the crisis (Exhibit 5). Four industries – bus, contract logistics, freight
forwarding, and shipping – reversed their fortunes for the worse, enjoying positive economic
profit before the crisis, but destroying value post-crisis. Airlines and trucking both started
with negative economic profit pre-crisis and worsened that position post-crisis. Only the rail
industry used the crisis as a turning point, bucking the trend within asset-intensive industries
to decrease its economic losses from -USD 12.6 billion pre-crisis to -USD 2.6 billion from
2010 to 2013.
Exhibit 5
Accumulated economic profit 2004 - 07
2008 - 09
USD billions
2010 - 13
Revenue 249 31 197 254 120 127 201 530 1,352
2013
28
Through-
cycle
2004 - 13
1 0 0 Σ
-1871
-15
-22
-43
-147
22.0
15.0 14.0
5.6 5.5
1.6
By phases -17 -78 -92
-1.0 -0.1 -0.9 -2.7 -2.9 -3.9 -1.6 -3.1 -6.3
-2.7
-5.3 -12.6 -6.4 -15.0
-43.0
-50.0 -52.0 -51.0
Postal/ Bus Contract Freight Trucking Rail Shipping Airline Transpor-
CEP logistics forwarding tation &
logistics
1 Figures do not add up as some companies contribute in different sectors but are only accounted for 1 time in the total sum
SOURCE: McKinsey Corporate Performance Center
Two thirds of companies producing high economic profit before the crisis failed to maintain
their relative position after the crisis (Exhibit 6). While this relative movement along the power
curve does not necessarily represent absolute increase or decrease in economic profit, it is
typically strongly correlated with TRS.4
Despite the sector’s overall destruction of value, each industry produced winners with
sustained economic profit as well as some with sustained losses. Some of the very best
performers can be found in the most capital-intensive and/or worst-performing industries,
e.g., Daqin Railway, Ryanair (the European low-cost airline), and Frontline (the world’s
largest oil-tanker shipping company) (Exhibit 7).
4 For more details, please see appendix
14 Pathway to value creation Lessons from the past and expectations for the futureExhibit 6
Economic mobility from 2004 - 07 to 2010 - 13
Percent, n = 2641
Ending position after crisis
Bottom Middle Top
Stayed
31 37 33
Upward
Top Downward
6 74 20
Starting position
based on the EP Middle
power curve
Bottom
53 42 6
1 Based on a sample of 264 TTL companies
SOURCE: McKinsey Strategy Practice, McKinsey Corporate Performance Analytical Tool
Exhibit 7
Accumulated economic profit 2004 - 13 by segment
USD billions
Net economic
27.8 0.6 0.0 0.0 -14.8 -21.6 -43.3 -146.7 -1871
profit
Value creators UPS Stage- C.H. Kühne + J.B. Hunt Stage- Frontline Ryanair
(examples) PostNL coach Robinson Nagel DSV coach Grindrod Copa
Go- Agility Expedi- Daqin Airlines
Ahead Public tors Railway
Ware-
Value housing
creation 37.2 5.2 4.1 36.2 30.5 139
16.7 19.6 15.4
-16.7 -19.5 -18.9
Value -9.4 -4.5 -37.0 -326
destruction -79.5
-177.2
Postal/ Bus Contract Freight Trucking Rail Shipping Airline Industry
CEP logistics forwarding total
EBITA margin 7.6 7.3 5.1 4.9 4.7 20.9 8.3 4.2 7.2
Average, percent
1 Figures do not add up as some companies contribute in different sectors but are only accounted for 1 time in the total sum
SOURCE: McKinsey Corporate Performance Center
Pathway to value creation Lessons from the past and expectations for the future 15Breaking down each industry’s pre- and post-crisis change in economic profit into its
underlying drivers reveals some industry-specific insights (Exhibit 8). For instance, shipping’s
through-cycle drop in economic profits is driven almost entirely by a sustained nosedive in
margins, caused partly by industry overcapacity. In contrast, the airline industry managed
to overcome a pre-crisis reduction in sales volumes, only to trade that value away through a
complete reversal in margin growth. The rail industry’s improving fortunes, on the other hand,
are enhanced thanks to steady through-cycle improvement in margins and capital efficiency.
Exhibit 8
Change in economic profit by drivers (before and after crisis)
USD billions
Postal/ Contract Freight
CEP Bus logistics forwarding Trucking Rail Shipping Airline
Pre-crisis value
creation1
Economic profit 2004 3.5 0.4 2.0 2.0 -0.5 -11.4 9.2 -14.3
Sales effect 1.0 0.2 1.1 1.1 0.1 -1.5 5.5 -5.7
Margin effect -1.6 0.4 -1.6 -1.6 -0.4 3.3 -7.6 12.2
Capital efficiency 0.4 -0.1 0.5 0.3 -0.1 2.0 -0.7 4.8
TCR2 effect -0.4 -0.3 -0.6 -0.5 -0.2 -0.7 -0.3 -2.1
Economic profit 2007 2.9 0.6 1.3 1.3 -1.1 -8.2 6.1 -5.1
Post-crisis value
creation3
Economic profit 2010 2.4 -0.1 1.3 1.4 -1.9 -13.2 -0.1 -4.7
Sales effect 0.3 0 0.2 0.4 -0.1 1.5 0 -1.4
Margin effect 0.6 -0.4 -1.5 -1.2 0.5 3.0 -12.2 -13.9
Capital efficiency 1.1 0 -0.3 -0.1 0.2 2.2 -2.1 3.3
TCR2 effect -0.1 0.1 0.3 0.3 0 0.2 -0.2 -0.6
Economic profit 2013 4.3 -0.4 -0.1 0.8 -1.3 -6.4 -14.5 -17.4
1 Based on 235 + 5 unique companies
2 Tangible capital ratio: describes the share of a company’s balance sheet deployed in productive assets (vs. assets used to finance goodwill; companies
growing through acquisitions typically create less value as their productive asset share is smaller)
3 Based on 264 unique companies
SOURCE: McKinsey Corporate Performance Center
It is also instructive to take a closer look at pre- and post-crisis economic profit margins
of the sample companies within each industry. Only in airlines, rail, and postal/CEP did
a relevant share of companies manage to improve their performance compared with
pre-crisis figures. Unsurprisingly, our shipping sample mirrors the seismic shifts towards
negative profitability in the industry. Similarly, structural changes in profitability potential
can also be observed in freight forwarding and contract logistics. Having survived the crisis
with limited damage, companies in these industries now seem unable to substantially gear
up their economic profit to pre-crisis levels: between 2010 and 2013, none of the sample
companies earned an economic profit margin that was significantly higher than its pre-crisis
margin in the 2004 to 2007 period. Trends such as disintermediation as well as increasing
price transparency and pressure through digitization seem to have created new profitability
ceilings for the industry (Exhibit 9).
16 Pathway to value creation Lessons from the past and expectations for the futureExhibit 9
Companies’ change in accumulated economic profit margin 2010 - 13 vs.
2004 - 07 by industry
Number of companies
Up: Δ > 2 PPT Flat: 2 PPT > Δ > -2 PPT Down: Δ < -2 PPT
Airline 24 22 25
Rail 7 8 11
Postal/CEP 4 10 3
Shipping 2 5 42
Trucking 2 36 10
Bus 1 9 4
Freight forwarding 23 12
Contract logistics 21 7
SOURCE: McKinsey
Pathway to value creation Lessons from the past and expectations for the future 17What are the market’s expectations for transportation and logistics?
Current valuation and growth forecasts
Market expectations for transportation and logistics seem to be muted compared with the
S&P 500. Weak growth expectations combined with poor current ROIC drive low valuation
multiples.
Valuation multiples (i.e., the ratio of EV to EBITA) for transportation and logistics companies
show that the sector is structurally discounted relative to the S&P 500 Index, with an average
of around 11x versus roughly 13.5x. This indicates investors’ skepticism about the sector’s
future profitability and growth potential (Exhibit 10).
Exhibit 10
EV/EBITA multiple distribution1
Percentage of companies within multiple range
Percent
60
50
Transportation & S&P
40 logistics sector
30
20
10
0
6 7 8 9 10 11 12 13 14 15 16 17 18+
EV/EBITA multiple
1 Financial companies have been excluded from the S&P 500 data set. Multiple is EV as of Feb 2015 on FY + 1 EBITA. Data points lower than 4.0x and
higher than 18.0x are considered outliers and were excluded from the data set
SOURCE: Capital IQ; McKinsey Corporate Performance Analysis Tool (CPAT); McKinsey analysis
18 Pathway to value creation Lessons from the past and expectations for the futureHigher valuations are mainly driven by expectations of future growth in profitability versus
current performance. For shipping and trucking, which have lower current ROIC ratios, the
market appears to expect a rebound in profitability. On the other hand, the markets appear
to signal doubt about the postal industry’s ability to sustain its strong run of increasing
profitability and growth (Exhibit 11).
Exhibit 11
Valuation by sector
Enterprise value to EBITA Key assumptions2 Pre-tax ROIC
(forward looking1) Percent Percent;
Measures the expected Average EBIT margin, Expected growth, measures the current
increase in future profits 2015 - 16 2014 - 16 performance
Shipping 12.8x 7.4 5.1 7.5
Trucking 12.5x 6.3 4.1 13.0
Rail 11.7x 26.8 4.8 16.3
Freight forwarding 10.9x 6.3 4.8 18.0
Transportation
10.8x 11.0 4.5 15.2
& logistics
Airline 10.0x 9.0 4.3 14.3
Contract logistics 9.8x 6.7 3.5 17.3
Bus 9.7x 7.6 -2.8 14.4
Postal/CEP 8.8x 11.7 3.6 30.5
1 EV is based on Dec 2014 market capitalization, IC as of Dec 2013; EBITA is based on consensus estimates for FY 2015 for all companies
2 2015 - 16 based on analyst estimates
SOURCE: Capital IQ; McKinsey Corporate Performance Analysis Tool (CPAT)
The capital market performance, economic profit generation, and valuation of the trans
portation and logistics sector at first sight appear to paint a gloomy picture: transportation
rates (as income per capacity unit) for goods and passengers have by and large been too
low for operators to generate an attractive return. Efficiency gains – be they created via
technological progress, economies of scale of denser networks, or process improvements –
have been passed on mostly to passengers and cargo owners (especially the retail and
consumer goods sectors as largest customers by transportation spend),5 but also to
employees and suppliers; in the aviation value chain, for example, most other participants
like aircraft OEMs, airports, and booking services create value at the expense of the airlines
themselves.
However, individual success stories in the worst-performing industries reveal that there is a
path to value creation. By staying ahead of the trends shaping the industry and by making
astute strategic choices, decision makers have a chance to beat the odds.
5 In fact, freight rates have been in steep decline for decades on an inflation-adjusted basis (“Where is the value in
transportation,” McKinsey, 2012).
Pathway to value creation Lessons from the past and expectations for the future 19What drives future value
creation? Global megatrends
shaping the transportation and
logistics sector
20Transportation and logistics companies connect a world changing at an ever-increasing rate,
fueled by global megatrends and sector-specific forces. Creating value in this sector requires
a strategy that places the company ahead of those trends. Our research shows that "riding
the right tailwinds" – being in the right markets at the right time – can account for more than
60 percent of growth. Yet, only 40 percent of companies systematically take into account the
impact of macrolevel trends as they shape their strategies. In our view, seven important trends
are shaping or will shape the sector over the coming years (Exhibit 12). Acknowledging that
none of those trends is entirely new or has so far been negligible, we believe that out of dozens of
themes and dynamics observed and discussed in transportation and logistics, these seven are
most relevant – even increasing in importance – and requiring strategic responses by executives.
Exhibit 12
7 megatrends affecting the transportation & logistics businesses
Megacities and selected emerging trade routes New solutions from unexpected competitors
Increased volatility of
demand and input factors
The digital frontier
Transportation &
logistics
Consolidation and cooperation
across the network
Burdening capex as a prerequisite
for competitiveness
The impact of deregulation on growth and competition
SOURCE: McKinsey
Shifting growth patterns: Megacities and emerging trade routes
As overall emerging market growth rates slow, growth patterns in trade and transportation
are becoming more granular. Betting on the most lucrative pockets of growth requires a
sophisticated perspective to select the cities and trade routes that will shift the centers of
economic gravity.
Growth in the transportation and logistics sector has tended to be highly linked to GDP.
While this still holds true, the IMF predicts that emerging markets’ growth will slow from
its pre-crisis peak of 7 percent per annum to 5 percent per annum over the current five-year
period (2014 to 2018),6 albeit from a higher base. In addition, the trade-to-GDP multiple has
fallen by 25 percent from 2.2 in the period from 1997 to 2006 to pre-globalization levels of
1.6 over the period of 2007 to 2013 and is not expected to rebound.
6 IMF (http://www.imf.org/external/pubs/ft/wp/2014/wp14173.pdf)
Pathway to value creation Global megatrends shaping the T&L sector 21In this context, it is crucial to identify the specific geographic areas and segments that
promise above-average growth, both in and beyond the emerging economies.
Shifting centers of gravity. Over the coming decades, Asia-linked trade flows are
projected to increase more than 3.6 times from 2009 to 2029.7 This means that by 2030 the
trade flows between Asia and North America will be four times higher than between North
America and Europe. Looking at past growth, this prediction seems anything but unrealistic.
Latin America became the fastest-growing market for Asian goods with an impressive
annual growth rate of 36 percent from 2003 to 2008; vice versa, Latin American exports to
Asia grew by 25 percent, in the same period.8 Finally, intraregional trade within emerging
markets has exploded. For example, between 2009 and 2029, intra-Asian trade flows are
projected to increase 4.6 times; domestic Chinese flows by 5.8 times, representing the
highest projected growth rates of all traffic flows. The McKinsey Global Institute visualized
the shifting center of gravity on a world map, tracking its recent trajectory east and south
(Exhibit 13).
Exhibit 13
Evolution of the earth’s economic center of gravity1
AD 1 - 2025
2000
1990
1970
1960 1980
1950 1940 2010
1913
2025
1820
1500
AD 1
1000
1 Economic center of gravity is calculated by weighting locations by GDP in 3 dimensions and projected to the nearest point on the earth’s surface. The
surface projection of the center of gravity shifts north over the course of the century, reflecting the fact that in 3-dimensional space America and Asia
are not only “next” to each other, but also “across” from each other
SOURCE: McKinsey Global Institute analysis using data from Angus Maddison, University of Groningen
7 Boeing WACF 2010-11
8 IMF Direction of Trade Statistics, time period 2003 to 2008
22 Pathway to value creation Global megatrends shaping the T&L sectorEmerging cities. By 2025 the number of megacities (with a nominal GDP of over USD 100
billion) in Asia, Africa, and Latin America will rise from 16 in 2010 to 109 (83 of which are in
Asia alone). Moreover, half of the global GDP growth will take place in 440 middleweight cities
(0.15 to 10 million inhabitants) in the developing world. Take Tianjin as an example:
120 kilometers southeast of Beijing, this city’s GDP is projected to grow from USD 130 billion
(equal to Stockholm’s GDP) in 2010 to USD 625 billion (equal to Sweden’s total GDP) by 2025.9
Nearshoring. While companies in Europe and North America are facing constant pressure
to reduce travel and logistics costs, products from Asia have become more expensive
due to diminishing labor cost differentials, which make it increasingly hard to recover the
long-distance shipping costs. As an example, for US companies, Chinese products have
become about 33 percent more expensive since 2005 than those sourced from Mexico.
The resultant trend to nearshoring – shifting manufacturing to countries in the same region –
both creates opportunities for new intraregional routes and challenges the profitability of
trade routes to emerging markets.
Shared transportation: New solutions from unexpected competitors
Starting with car sharing, the shared economy is beginning to profoundly impact other
passenger and cargo services, and even spurring new arrangements between businesses.
The popularity of shared transportation is on the rise, as innovative peer-to-peer platforms
enable customers to utilize other economic agents’ assets and competencies. Technology-
enabled solutions, pioneered by Uber and Airbnb in the field of B2C transactions, are now
being planned or emulated in other transportation segments and also spreading into the
B2B space.
Crowdsourced delivery. Dozens of platforms already exist for local crowdsourced delivery
arrangements. For example, with Barnacle, drivers can post their driving routes with a
mobile app and get notified of any delivery requests. Friendshippr leverages a Facebook
user’s own network by helping turn Facebook friends into couriers. These services
represent both a threat and an opportunity for traditional postal and logistics services. DHL
Parcel delivers parcels to a service point/depot ("Packstation" or "Paketshop") and enables
recipients to pay others for pickup and “last-mile” delivery, thus bypassing high costs for
covering remote areas. Start-ups in crowdsourced delivery typically offer fast local, point-
to-point deliveries (instant, scheduled), easy access via online platforms and application
program interfaces (API), and automated pricing and dispatching.
Capacity sharing and trading. Within a few years of the introduction of sharing-economy
services geared to the B2C segment, B2B platforms for freight transportation emerged,
changing existing business models but also creating new ones.
Consider the start-up Cargomatic in the US. Traditionally, trucks servicing scheduled or
ad-hoc routes often had loads that did not fill their freight or cargo capacity, and the excess
was poorly managed. With Cargomatic’s new online platform, shippers can now access
spare capacity at pre-screened and qualified carriers at short notice (in near real time) and
at a comparatively low cost. This more open access creates a win-win situation, maximizing
payload while enabling cheapest-possible freight rates. Cargomatic benefits from a
9 McKinsey Global Institute, Cityscope 1.1
Pathway to value creation Global megatrends shaping the T&L sector 2320 percent commission on the freight rates for the broker service and transaction handling.
The company – which has raised more than USD 10 million in funding within the last
12 months – aspires to become the leading platform connecting commercial shippers
and trucking companies – a position that Uber took years to reach in local on-demand
passenger transportation.
In general, online platforms enable and fuel transport capacity sharing and thus pose a
threat to established business models, especially in freight forwarding. The Web-based
solutions allow shippers, carriers, and other players (e.g., customs authorities) to interact
directly at different steps of the information value chain. They will continue to streamline
procurement of transport services, lower switching barriers through standardized quotes,
ease comparisons through greater transparency, minimize intermediaries’ margins with
concepts such as reverse auctioning, and bring down the number of parties to deal with
(disintermediation). Already, around 20 percent of global tenders for freight forwarding are
handled via such online platforms. It is not inconceivable that the entirety of low-complexity
volumes could transition onto platforms like GT Nexus, Inttra, and Cargoclix.com
Disruptive solutions for passenger services. Shared-economy business models have
already disrupted the passenger transportation market. In addressing the traditionally low
utilization of cars, and the inner-city congestion challenge, shared transportation – from
Citi Bike and Flinkster to Uber and myDriver – is revolutionizing the way customers think
about short-distance transportation. Once the new models overcome existing legal hurdles
and reach mainstream adoption, these asset-light approaches/services will accelerate
pressure on owners and operators of traditional infrastructure to react.
The future is now: The digital frontier
The digital revolution has profound and specific implications for the transportation and
logistics sector. In order to survive and thrive as they transform into digital businesses,
companies in this sector need to consider each step of the value chain, from acquiring and
delighting customers, to increasing operational efficiency.
By drastically reducing the marginal cost of acquiring a new customer, digitization has
radically increased the speed at which new transportation and logistics players can grow.
For example, by expanding its services from flights only to travel in general, Skyscanner
boosted revenues by 42 percent in 2014 alone. Nevertheless, many transportation and
logistics companies have not yet fully recognized digital’s potential to create (and disrupt)
value across the value chain, especially in operations and customer interaction.
Simpler, safer, and better operational processes. Digitization will transform the back
end of transportation and logistics businesses. Digital solutions are capable of reducing
costs and adding more value to services in all facets of operational processes. According
to our research, partial or full automation, e.g., driverless trucks (already technologically
possible), can reduce transport costs by 25 to 40 percent, delivery time by 30 percent,
and the number of accidents by more than 50 percent. Access to new insights through
exploding amount of data generated (“big data”) also enables transportation and logistics
companies to optimize customer-facing and internal processes. The truckload service firm
U.S. Xpress rigorously collects real-time data on the fuel consumption of its vehicles,
saving the company millions of dollars.
24 Pathway to value creation Global megatrends shaping the T&L sectorThe importance of data as an input is accelerating, enabling new possibilities and information-based business models. Big data lays the groundwork for completely new levels of optimization and easier quality evaluation. Predictive modeling will, for example, become much more accurate and thus greatly improve capacity planning. On the other hand, there will be a growing need for transportation and logistics companies to collaborate with the data providers, e.g., cloud service providers, to gain market insights. Moreover, data security and system reliability will be increasingly differentiating factors for industry players. Meeting customers’ increased expectations. Digital tools enhance transportation and logistics services by making them faster, cheaper, and better, as well as more transparent, flexible, and comfortable. But innovations by attackers, such as the price aggregator and ranking site TripAdvisor, have also intensified competitive pressure for incumbents. Markets and channels – digitally augmented or replaced. New digital technologies open markets that either complement or replace old markets. Instant customer reach, direct access to end customer, and low-to-zero transaction cost are inherent benefits leveraged by more and more transportation and logistics players and especially their customers. With online shopping, e.g., the number of parcels has soared (growing roughly three times as fast as the GDP in all major economies since the year 2000), enabling logistics companies to reinvent themselves as e-commerce players. The race for efficiency: Burdening capex as a prerequisite for competitiveness Transportation assets are becoming smarter, greener, and larger at an ever-faster rate. Companies need to invest constantly in new-generation assets to remain competitive, while retaining capital discipline. Companies endowed with older assets in capital-intensive industries are typically able to generate windfall profits. However, the opposite holds true for the transportation industry. There is a strong inverse relationship between economic profit and the average age of an airline or shipping fleet. Lower costs. Asset size has roughly doubled every ten years, reducing unit costs by 16 percent and 25 percent, respectively, for new-generation aviation and container shipping assets (Exhibit 14). Over the past 30 years, marginal capacity cost in a number of the eight transportation and logistics industries has amounted to as much as 25 to 50 percent. Asset deflation. Furthermore, scale and technological progress have driven up the operating efficiency of new assets. New-generation assets (e.g., large container ships, the new Boeing 787, or Gigaliner trucks) are 10 to 30 percent more efficient than previous generation assets and have correspondingly lower unit operating costs. New assets often set lower market prices, causing older, less efficient assets to deliver lower than expected return on investment. Further, as we have shown in our report “Where is the value in transportation?” from 2012, new-generation assets devalue older assets as second- hand prices tumble. Exhibit 15 recaps the significant impact the development of capital expenditure and operating costs has had on different industries over the last 30 years. Pathway to value creation Global megatrends shaping the T&L sector 25
Exhibit 14

      Development of containership sizes

      Largest ship size, 1972 - 2013                                                                    Containership fleet, Mar 2014
      TEU                                                                                               TEU, percent

                                                                                18,200                          100% = 17,321                    3,680
                                                                                                        Feeder                                       3
                                                                                                                                14               6
                                                               15,500                                   (< 2,000)                                    6
                                                                                                        Feedermax                                    12
                                                                                                                                21
                                                                                                        (< 3,000)

                                                                                                        Panamax
                                                                                                                                26
                                                                                                        (< 5,100)
                                              7,400
                                                                                                        Post-Panamax                                 73
                            4,500                                                                       (< 10,000)              24
           3,000                                                                                        Super-Post-
                                                                                                        Panamax
             1                 2                 3                4                 5                   (> 10,000)              15

           1972               88              1996              2006             2013                                        Fleet             Order book
       1 3rd generation
       2 4th generation (Panamax)
       3 5th generation (Post-Panamax)
       4 6th generation (Ultra Large Container Ship/Super-Post-Panamax)
       5 Maersk deployed newly delivered 4 Triple-E class vessels
         (18,000 TEU) on Asia-EU route

      SOURCE: CI Online; McKinsey analysis

      Exhibit 15

      Change of marginal capex1/variable2 cost by industry                                                          Not transportation & logistics industry

      for old vs. new capacity in operation (estimates)                                                             Transportation & logistics industry

                                                                       Capital expenditure            Variable cost                  Calculated windfall
                       1980                    2010                    Percent                        Percent                        profit3

      Mining           Iron ore mine           New iron ore
                                               mine                                         1,500                         370                             10

      Real estate      Home                    New home
                                                                                 150                  -40                                            4

      Power            Coal power plant        New plant
      generation                                                                        425               -15                                        3

      Container        Container vessel, Emma Maersk,
      shipping         1,600 TEU         14,770 EUR                    -50                            -324                           -7

      Aviation         Boeing                  Boeing
                       737-3005                737-700                  -86                              -20                              -4

      Trucking         Mercedes-Benz           MAN TGS 41 t
                       NG80                                            -25                               -20                              -4

      1 Cost per capacity unit in nominal terms                                                                       4 Based on energy intensity/bunker burn
      2 Cost per output unit in 2010; includes mainly fuel, maintenance, crew, handling, operating supplies           5 1984
      3 Calculated EBIT gap in percentage points between operator with average aged asset vs. operator                6 Based on cost per seat
        with only newest assets (50% of this effect is assumed to be realized)
      SOURCE: "Where is the value in transportation?", McKinsey, 2012

26   Pathway to value creation                  Global megatrends shaping the T&L sector
Environmental regulations. Governments around the world continue to strengthen environmental regulations that apply to the transport sector. In Europe, high-emission vehicles are banned from city centers, with zero-emission requirements expected to be commonplace by 2030. Airlines now need to buy allowances for CO2 emissions. And in shipping, Emission Control Areas (ECA) in the US and Europe, are expected to be followed by new areas in the Caribbean, Mediterranean, Arctic, and Sea of Japan. In response, the shipping industry is moving towards smarter vessels, reducing fuel consumption through design, with lower speeds and wider beam hulls. Rules of the game: The impact of deregulation on growth and competition A further wave of deregulation will expose transport and logistics companies to greater competition in their home markets, while opening up opportunities elsewhere. In many countries, the privatization and deregulation of the transportation and logistics sector started in the 1980s. Still, further removal of regulatory barriers (especially in the EU) could alter the sector even more dramatically. Postal services. The deregulation of postal services in Europe is already well advanced. The EU required member states to fully liberalize their postal services by 2013, causing incumbent companies to react with reforms such as new products and pricing strategies. For example, the UK’s Royal Mail has applied innovative pricing levers differentiated by zone, physical features (size, weight), and content. It was able to increase stamp prices by more than 30 percent, while remaining affordable for consumers. Air. Open-sky agreements between countries have progressively opened routes previously dominated by national carriers to new entrants. The US alone already has such agreements with 100 countries. Today, open-sky negotiations are still mostly bilateral and remain a lengthy, highly political process affected by the economic cycle. Efforts to establish multilateral agreements, such as the ASEAN Multilateral Agreement on Air Services, could rapidly accelerate the opening up of regional routes. Rail. The rail industry is still highly regulated, especially in Europe as the largest market for passenger rail services. But the trend towards liberalization is accelerating. Cross-border passenger rail in the EU, for instance, has been opened for all European railway companies creating new opportunities for international cooperation. Domestic European railway services are to be completely tendered out by 2022, which is, so far, only the case in the UK and Sweden. This may result in dramatic changes in the railway landscape (new owners, fragmented markets). At the same time new players such as Uber enter existing or perceived areas of regulatory voids, testing current protectionism and legislators’ willingness to adjust inflexible rules to new business models. Results are mixed, ranging from tightening of regulation, banning Uber's service (e.g., in Miami among other cities) to ongoing official reviews for less regulation (e.g., for currently tightly regulated paid ride services and ride sharing in Washington D.C.), which could affect the wider industry of urban transportation. Pathway to value creation Global megatrends shaping the T&L sector 27
Size matters: Consolidation and cooperation across the network
     As industries consolidate and competition increases, M&A is a core competency for transport
     and logistics companies. At the same time, traditional and innovative approaches to cooperation
     are increasing opportunities to work together to leverage scale and realize synergies.

     Consolidation and cooperation have never been as easy and as necessary as in today’s
     increasingly deregulated and value- and cost-conscious world. As barriers continue to fall,
     companies are deploying the full range of combination techniques, from M&A to simple
     partnerships. The asset intensity and network effects in the transportation and logistics
     sector increase the potential synergies from collaboration.

     Consolidation. Most mature industries are consolidating across markets. Incumbents
     in post and parcel services, in particular Deutsche Post, prepared themselves for full
     liberalization through an aggressive acquisition strategy across the globe. For airlines, we
     estimate that between one-third and half of the total synergies realized through M&A result
     from network/fleet optimization. Not surprisingly, the strong consolidation activity in the US
     airline market – with the top three market share based on ASK (available seat kilometers)
     moving up overall from 50 percent in 2001 to 64 percent in 2014, and from 62 percent to
     90 percent on international flights – has resulted in significantly higher profitability levels
     through capacity rationalization and economies of scale in all processes.

     Joint ventures. In most industries, cooperation through joint ventures remains the primary
     means to gain access to new markets, especially emerging ones. Examples of joint ventures
     in Europe include Veolia, RATP, and KMB in the bus sector and, in Asia, the Singapore/China
     Airlines joint ventures in air cargo.

     Creative cooperation. Companies are getting more and more creative in how they
     collaborate. Gainsharing agreements, for instance, are often used as an incentive for
     contract logistics (3PL) and shippers to work together on improving supply chain operations.
     In 2012, 42 percent of shippers reported gainsharing agreements with their 3PL partners
     as a way to fill their fixed warehouse and vehicle capacity. Kimberly-Clark has pursued a
     “collaborative logistics” approach by partnering with its retail customers. In the same trucks,
     it succeeded in combining light freight that “cubes out” (physically fills the trailer) with its
     customers’ heavy freight that “weighs out” (meets the maximum legal weight limit). This
     slashed empty miles, transportation costs, and the number of trucks. Creative cooperation
     agreements are also expected to emerge across industry borders along the value chain.

     Turbulent times: Increased volatility of demand and input factors
     Transportation and logistics industries are exposed to rapid swings in both customer
     demand and input factors such as fuel. Remaining agile in the face of sudden change
     remains the best defense to increased volatility.

     Transportation and logistics companies face a perfect storm of exposure to volatility – not
     as a rare event but as a constant companion. The scale of fuel and energy as a share of
     total costs means that rapid changes have a big impact on the bottom line. In addition,
     consumer demand for transportation and logistics services is highly price sensitive and
     subject to macroeconomic shifts, demand shocks, and regulatory changes.

28   Pathway to value creation   Global megatrends shaping the T&L sector
You can also read