Air quality in Europe - 2018 report - EEA Report No 12/2018 - European Environment Agency
←
→
Page content transcription
If your browser does not render page correctly, please read the page content below

EEA Report    No 12/2018

Air quality in Europe — 2018 report

                                   ISSN 1977-8449

EEA Report   No 12/2018

Air quality in Europe — 2018 report

Cover design: EEA
Cover photo: © Ieva Bruneniece, My City /EEA

Legal notice
The contents of this publication do not necessarily reflect the official opinions of the European Commission or other
institutions of the European Union. Neither the European Environment Agency nor any person or company acting on
behalf of the Agency is responsible for the use that may be made of the information contained in this report.

Copyright notice
© European Environment Agency, 2018
Reproduction is authorised provided the source is acknowledged.

More information on the European Union is available on the Internet (http://europa.eu).

Luxembourg: Publications Office of the European Union, 2018

ISBN 978-92-9213-989-6
ISSN 1977-8449
doi: 10.2800/777411

European Environment Agency
Kongens Nytorv 6
1050 Copenhagen K
Denmark

Tel.: +45 33 36 71 00
Web: eea.europa.eu
Enquiries: eea.europa.eu/enquiries
Contents

Contents

Acknowledgements..................................................................................................................... 5

Executive summary..................................................................................................................... 6

1 Introduction.......................................................................................................................... 10
     1.1 Background............................................................................................................................. 10
     1.2 Objectives and coverage.......................................................................................................10
     1.3 Effects of air pollution............................................................................................................11
     1.4 International policy ...............................................................................................................15
     1.5 European Union legislation...................................................................................................15
     1.6 National and local measures to improve air quality in Europe	���������������������������������������17

2 Sources and emissions of air pollutants............................................................................ 18
     2.1 Total emissions of air pollutants..........................................................................................18
     2.2 Sources of regulated pollutants by emissions sector	�������������������������������������������������������20

3 Particulate matter................................................................................................................ 26
     3.1	European air quality standards and World Health Organization guidelines for
          particulate matter..................................................................................................................26
     3.2 Status of concentrations.......................................................................................................26
     3.3 PM2.5 average exposure indicator.........................................................................................29
     3.4	Contribution of PM precursor emissions, natural sources, climate change and
          meteorological variability to ambient PM concentrations................................................31

4 Ozone..................................................................................................................................... 35
     4.1 European air quality standards and World Health Organization guidelines for ozone...35
     4.2 Status of concentrations.......................................................................................................36
     4.3 Ozone precursors...................................................................................................................38

5 Ozone pollution in Europe: special focus on the Mediterranean	�������������������������������������39
     5.1 Tropospheric ozone pollution..............................................................................................39
     5.2 Ozone pollution in the Mediterranean region....................................................................40
     5.3 Abatement strategies............................................................................................................41
     5.4 Ozone trends across Europe................................................................................................42

                                                                                             Air quality in Europe — 2018 report                      3
Contents
6 Nitrogen dioxide................................................................................................................... 46
6.1 European air quality standards and World Health Organization guidelines
for nitrogen dioxide...............................................................................................................46
6.2 Status of concentrations.......................................................................................................46
6.3 Contribution of nitrogen oxides emissions to ambient nitrogen dioxide
concentrations.......................................................................................................................47
7 Benzo[a]pyrene..................................................................................................................... 48
7.1 European air quality standard and reference level for benzo[a]pyrene.........................48
7.2 Status of concentrations.......................................................................................................48
7.3 Reporting of other polycyclic aromatic hydrocarbons �����������������������������������������������������48
8 Other pollutants: sulphur dioxide, carbon monoxide, benzene and toxic metals......51
8.1 European air quality standards and World Health Organization guidelines..................51
8.2 Status in concentrations........................................................................................................51
9 Population exposure to air pollutants............................................................................... 56
9.1 Exposure of the EU-28 population in urban and suburban areas in 2016.....................56
9.2 Exposure of total European population in 2015 and changes over time........................57
10 Health impacts of exposure to fine particulate matter, ozone and nitrogen dioxide...62
10.1 Methodology used to assess health impacts......................................................................62
10.2 Health impact assessment results.......................................................................................63
10.3 Changes over time of the health impacts of air pollution ������������������������������������������������66
11 Exposure of ecosystems to air pollution........................................................................... 68
11.1 Vegetation exposure to ground-level ozone.......................................................................68
11.2 Eutrophication........................................................................................................................69
11.3 Acidification............................................................................................................................. 70
11.4 Vegetation exposure to nitrogen oxides and sulphur dioxide ����������������������������������������72
11.5 Environmental impacts of toxic metals...............................................................................72
Abbreviations, units and symbols........................................................................................... 73
References.................................................................................................................................. 76
Annex 1 S
ensitivity analysis of the health impact assessments ��������������������������������������� 83
4 Air quality in Europe — 2018 reportAcknowledgements
Acknowledgements
This report has been written by the European (Czech Hydrometeorological Institute), Jaume Targa
Environment Agency (EEA) and its European (4sfera), Wim Mol (Netherlands National Institute for
Topic Centre on Air Pollution and Climate Change Public Health and the Environment), and Rebecca
Mitigation (ETC/ACM). The EEA project manager J. Thorne, Torleif Weydahl and Rune Ødegaard
was Alberto González Ortiz and the ETC/ACM manager (Norwegian Institute for Air Research). The ETC/ACM
was Cristina Guerreiro. reviewer was Xavier Querol (Spanish Council for
Scientific Research).
The authors of the report were Cristina Guerreiro
(Norwegian Institute for Air Research), Alberto González Thanks are due to the air quality data suppliers in the
Ortiz (EEA), Frank de Leeuw (Netherlands National reporting countries for collecting and providing the
Institute for Public Health and the Environment), data on which this report is based.
Mar Viana (Spanish Council for Scientific Research)
and Augustin Colette (French National Institute for The EEA acknowledges comments received on the draft
Industrial Environment and Risks). report from the European Environment Information
and Observation Network national reference centres,
The EEA contributors were Anke Lükewille, Federico the European Commission and the World Health
Antognazza, Evrim Öztürk, Michel Houssiau and Artur Organization. These comments have been included in
Gsella. The ETC/ACM contributors were Jan Horálek the final version of the report as far as possible.
Air quality in Europe — 2018 report 5Executive summary
Executive summary
The current report presents an updated overview and Europe's air quality
analysis of air quality in Europe from 2000 to 2016. It
reviews the progress made towards meeting the air
quality standards established in the two EU Ambient Particulate matter
Air Quality Directives and towards the World Health
Organization (WHO) air quality guidelines (AQGs). Concentrations of particulate matter (PM) continued
It also presents the latest findings and estimates to exceed the EU limit values and the WHO AQGs in
on population and ecosystem exposure to the air large parts of Europe in 2016. For PM with a diameter
pollutants with the greatest impacts and effects. The of 10 µm or less (PM10), concentrations above the
evaluation of the status of air quality is based mainly EU daily limit value were registered at 19 % of the
on reported ambient air measurements, in conjunction reporting stations in 19 of the 28 EU Member States
with modelling data and data on anthropogenic (EU-28) and in eight other reporting countries; for
emissions and their evolution over time. PM2.5, concentrations above the annual limit value
were registered at 5 % of the reporting stations in four
For the first time, the Air quality in Europe report Member States and four other reporting countries.
presents information on concentrations for
most air pollutants at country level for all of the The long-term WHO AQG for PM10 was exceeded at
EEA-39 countries (the 33 member countries and six 48 % of the stations and in all the reporting countries
cooperating countries; see Box ES.1). This is thanks to except Estonia, Iceland, Ireland and Switzerland. The
an improvement in the official reporting of data by all long-term WHO AQG for PM2.5 was exceeded at 68 %
countries. We would like to recognise and acknowledge of the stations located in all the reporting countries
the support from the air quality experts in the different except Estonia, Finland, Hungary, Norway and
countries. Switzerland.
Box ES.1 New in the Air quality in Europe — 2018 report
The Air quality in Europe report series from the EEA presents regular assessments of Europe's air pollutant emissions and
concentrations, and their associated impacts on health and the environment.
Based upon the latest official data available from countries, this updated 2018 report presents new information, including:
• updated data on air pollutant emissions and concentrations, and urban population exposure (for 2016);
• extended country scope in the analysis of concentrations, with a more detailed analysis for all the reporting countries;
• information on the status of reporting of PM2.5 (particulate matter with a diameter of 2.5 µm or less) speciation, ozone
precursors, and polycyclic aromatic hydrocarbons;
• updated assessments of total population and ecosystems exposure data, and air quality impacts on health (for 2015);
• evolution over time of the health impacts of air pollution;
• a special focus on ozone, with a summary of ozone formation mechanisms in the atmosphere, as well as some
abatement strategies and past trends in Europe.
6 Air quality in Europe — 2018 reportExecutive summary
A total of 13 % of the EU-28 urban population was long-term objective was met in only 17 % of stations in
exposed to PM10 levels above the daily limit value and 2016. The WHO AQG value for O3 was exceeded in 96 %
approximately 42 % was exposed to concentrations of all the reporting stations, the same percentage as
exceeding the stricter WHO AQG value for PM10 in in 2015.
2016. Regarding PM2.5, 6 % of the urban population
in the EU-28 was exposed to levels above the EU limit About 12 % of the EU-28 urban population was
value, and approximately 74 % was exposed to exposed to O3 concentrations above the EU target value
concentrations exceeding the WHO AQG value for PM2.5 threshold, which is a considerable decrease compared
in 2016 (Table ES.1). The percentage of the EU-28 urban with the high exposure of 2015 (30 %). However,
population exposed to PM10 and PM2.5 levels above limit the percentage is still higher than the 7 % recorded
values and WHO guidelines in 2016 was the lowest in 2014. The percentage of the EU-28 urban population
since 2000 (2006 for PM2.5), showing a decreasing trend. exposed to O3 levels exceeding the WHO AQG value
was 98% in 2016, scarcely showing any fluctuation
However, four Member States had yet to meet the since 2000 (Table ES.1).
exposure concentration obligation.
Nitrogen dioxide
Ozone
The annual limit value for nitrogen dioxide (NO2)
In 2016, 17 % of stations registered concentrations continues to be widely exceeded across Europe,
above the EU ozone (O3) target value for the protection even if concentration and exposure are decreasing.
of human health. The percentage of stations In 2016, around 12 % of all the reporting stations
measuring concentrations above this target value was recorded concentrations above this standard, which
considerably smaller than in 2015 (41 %) but higher is the same as the WHO AQG. These stations were
than in 2014, reflecting the interannual variability of O3 located in 19 of the EU-28 and four other reporting
concentrations. These stations were located in 14 of the countries, and 88 % of concentrations above this limit
EU-28 and five other reporting European countries. The value were observed at traffic stations.
Table ES.1 Percentage of the urban population in the EU-28 exposed to air pollutant concentrations
above certain EU and WHO reference concentrations (minimum and maximum observed
between 2014 and 2016)
Pollutant EU reference value (a) Exposure estimate (%) WHO AQG (a) Exposure estimate (%)
PM2.5 Year (25) 6-8 Year (10) 74-85
PM10 Day (50) 13-19 Year (20) 42-52
O3 8-hour (120) 7-30 8-hour (100) 95-98
NO2 Year (40) 7-8 Year (40) 7-8
BaP Year (1) 20-24 Year (0.12) RL 85-90
SO2 Day (125)Executive summary
Seven per cent of the EU-28 urban population lived in impacts, cutting lives short, increasing medical costs
areas with concentrations above the annual EU limit and reducing productivity through working days lost
value and the WHO AQG for NO2 in 2016 (Table ES.1), across the economy. Europe's most serious pollutants
which represents the lowest value since 2000. in terms of harm to human health, are PM, NO2 and
ground-level O3.
Benzo[a]pyrene, an indicator for polycyclic aromatic Estimates of the health impacts attributable to exposure
hydrocarbons to air pollution indicate that PM2.5 concentrations in
2015 (1) were responsible for about 422 000 premature
Thirty-one per cent of the reported benzo[a]pyrene (BaP) deaths originating from long-term exposure in Europe
measurement stations reported concentrations above (over 41 countries; see Table 10.1), of which around
1.0 ng/m3 in 2016. They belonged to 13 Member States 391 000 were in the EU-28. The estimated impacts
(out of 25 EU-28 and two other countries reporting data) on the population in these 41 European countries of
and were located mostly in urban areas. Twenty-one per exposure to NO2 and O3 concentrations in 2015 were
cent of the EU-28 urban population was exposed to BaP around 79 000 and 17 700 premature deaths per year,
annual mean concentrations above the EU target value respectively, and in the EU-28 around 76 000 and 16 400
in 2016 and about 90 % to concentrations above the premature deaths per year, respectively.
estimated reference level (Table ES.1).
Although variations from year to year are small, a
recent study (ETC/ACM, 2018c) assessed the long-term
Other pollutants: sulphur dioxide, carbon monoxide, evolution of the European population exposure's to
benzene and toxic metals PM2.5 concentration since 1990 and the associated
premature deaths. Different data-sets were used
Only 23 stations (out of 1 600) in five reporting countries and the ensemble of all datasets indicates a median
reported values for sulphur dioxide (SO2) above the decrease in premature mortality of about 60% in
EU daily limit value in 2016. However, 37 % of all SO2 Europe, attributed to exposure to PM2.5 between
stations, located in 30 reporting countries measured SO2 1990 and 2015. This reflects a similar decrease in the
concentrations above the WHO AQG. This signified that European population's exposure to PM2.5.
23 % of the EU-28 urban population in 2016 was exposed
to SO2 levels exceeding the WHO AQG.
Exposure and impacts on European
Exposure of the European population to carbon ecosystems
monoxide (CO) concentrations above the EU limit value
and WHO AQG is very localised and infrequent. Only five Air pollution also damages vegetation and ecosystems.
stations (of which four were outside the EU-28) registered It leads to several important environmental impacts,
concentrations above the EU limit value in 2016. which affect vegetation and fauna directly, as well
as the quality of water and soil, and the ecosystem
Likewise, concentrations above the limit value for services they support. The most harmful air pollutants
benzene (C6H6) were observed at only four European in terms of damage to ecosystems are O3, ammonia
stations (all of them located in the EU-28) in 2016. (NH3) and nitrogen oxides (NOx).
Concentrations of arsenic (As), cadmium (Cd), lead (Pb) The latest estimates of vegetation exposure
and nickel (Ni) in the air are generally low in Europe, to O3 indicate that the EU target value for protection
with few exceedances of the environmental standards. of vegetation from O3 was exceeded in 2015 (1)
However, these pollutants contribute to the deposition in about 30 % of the agricultural land area of the
and accumulation of toxic metal levels in soils, sediments EU-28, and in 31 % of all the European countries
and organisms. considered. The long-term objective for the protection
of vegetation from O3 was exceeded in 79 % of the
EU-28 (80 % of all European) agricultural area. The
Impacts of air pollution on health United Nations Economic Commission for Europe
(UNECE) Convention on Long-range Transboundary
Air pollution continues to have significant impacts on Air Pollution (CLRTAP) critical level for the protection
the health of the European population, particularly of forests was exceeded in 61 % of the EU-28
in urban areas. It also has considerable economic (60 % of all European) forest area in 2015.
(1) The methodology uses maps of interpolated air pollutant concentrations, with information on the spatial distribution of concentrations
from the European Monitoring and Evaluation Programme (EMEP) model. At the time of drafting this report, the most up-to-date data from
the EMEP model were used (2015).
8 Air quality in Europe — 2018 reportExecutive summary
It is estimated that about 61 % of the European Mediterranean basin, different mechanisms cause
ecosystem area and 72 % of the EU-28 ecosystem area high O3 episodes. Among these mechanisms are
remained exposed to air pollution levels exceeding transport of O3 from other regions, local production
eutrophication limits in 2015. of O3, and vertical recirculation from higher
atmospheric layers. Regional transport is more
Finally, exceedances of the critical loads for acidification frequent in the eastern part of the basin and local
occurred over 5 % of the European ecosystem area and production in the western part. This has implications
6 % of the EU-28 ecosystem area. from the point of view of mitigation strategies to
reduce O3 impacts.
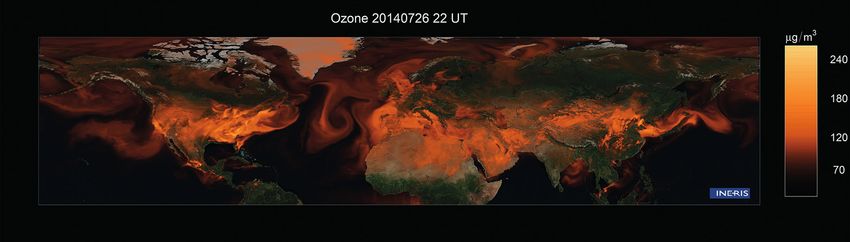
Focus on tropospheric ozone Despite the fact that O3 precursor emissions declined
in the EU-28 between 2000 and 2016 by about
O3 is a secondary pollutant formed in the troposphere 40 %, mixed trends are found for O3 concentrations
by complex chemical reactions following emissions of depending on the metrics. However, O3 peaks have
precursor gases such as NOx and VOCs. The highest declined over Europe since 2000. This decline has been
concentrations occur mainly in southern Europe. It mainly due to a reduction in the precursors emissions
affects both human health and ecosystems. In the and, to a lesser extent, to meteorological conditions.
Photo: © Giorgio Mazza, NATURE@work /EEA
Air quality in Europe — 2018 report 9Introduction
1 Introduction
1.1 Background of air quality is based on officially reported ambient
air measurements (see Box 1.1), in conjunction with
Air pollution is a global threat leading to large officially reported data on anthropogenic emissions
impacts on health and ecosystems. Emissions and their evolution over time. Parts of the assessment
and concentrations have increased in many areas also rely on air quality modelling.
worldwide. When it comes to Europe, air quality
remains poor in many areas, despite reductions in In addition, the report includes an overview of the latest
emissions and ambient concentrations. findings and estimates of the effects of air pollution
on health (including the evolution, since 1990, of the
Effective action to reduce air pollution and its effects attributed to exposure to particulate matter
impacts requires a good understanding of its causes, (PM) with a diameter of 2.5 µm or less (PM2.5)), and of
how pollutants are transported and transformed ecosystems' exposure to air pollution.
in the atmosphere, how the chemical composition
of the atmosphere changes over time, and how The report reviews progress towards meeting the air
pollutants impact humans, ecosystems, the climate quality standards (see Tables 1.1 and 1.2) established
and subsequently society and the economy. To curb in the two Ambient Air Quality Directives presently in
air pollution, collaboration and coordinated action force (EU, 2004, 2008) and the long-term objectives
at international, national and local levels must be of achieving levels of air pollution that do not lead
maintained, in coordination with other environmental, to unacceptable harm to human health and the
climate and sectoral policies. Holistic solutions involving environment, as presented in the latest two European
technological development, structural changes and Environment Action Programmes (EU, 2002, 2013),
behavioural changes are also needed, together with an moving closer to the World Health Organization (WHO)
integrated multidisciplinary approach. air quality guidelines (WHO, 2000, 2006a)
(see Table 1.3).
Air pollution is perceived as the second biggest
environmental concern for Europeans after climate This year's report looks into tropospheric ozone (O3)
change (European Commission, 2017b) and people pollution in some more detail. The development
expect the authorities to implement effective measures and causes of O3 pollution in Europe, and especially
to reduce air pollution and its effects. in the Mediterranean, are analysed, as along with
some abatement strategies. Tropospheric O3 is an
air pollutant with significant impacts on health,
1.2 Objectives and coverage ecosystems, crops and forests, as well as climate.
O3 is a secondary pollutant formed in the presence
This report presents an updated overview and analysis of sun-light and governed by complex formation,
of air quality in Europe (2) and is focused on the state reaction, transport and deposition mechanisms. As a
of air quality in 2016. The evaluation of the status result, the design of air quality policies to efficiently
(2) The report focuses as much as possible on the EEA-39 countries, that is:
• the 28 Member States of the European Union (EU), or EU-28 — Austria, Belgium, Bulgaria, Croatia, Cyprus, Czechia, Denmark,
Estonia, Finland, France, Germany, Greece, Hungary, Ireland, Italy, Latvia, Lithuania, Luxembourg, Malta, the Netherlands, Poland,
Portugal, Romania, Slovakia, Slovenia, Spain, Sweden and the United Kingdom;
• plus the five other member countries of the European Environment Agency (EEA) — Iceland, Liechtenstein, Norway, Switzerland and
Turkey — that, together with the EU-28, form the EEA-33;
• plus the six cooperating countries of the EEA — Albania, Bosnia and Herzegovina, the former Yugoslav Republic of Macedonia, Kosovo
under United Nations Security Council Resolution 1244/99, Montenegro and Serbia — that, together with the EEA-33, form the EEA-39
countries.
Finally, some information also covers other smaller European countries such as Andorra, Monaco and San Marino.
10 Air quality in Europe — 2018 reportIntroduction
abate ambient air O3 concentrations is also a complex HEI, 2018), causing around 400 000 premature deaths
task. Since the second half of the 1990s, European per year. Heart disease and stroke are the most
policies have been in place to limit emissions of O3 common reasons for premature death attributable
precursors and regulate ambient concentrations, to air pollution, followed by lung diseases and lung
but measurements indicate that in certain regions cancer (WHO, 2014). The International Agency for
of Europe the decline in O3 is less than expected. Research on Cancer has classified air pollution in
Consequently, several questions have been raised general, as well as PM as a separate component of air
regarding the underlying reasons, which are complex pollution mixtures, as carcinogenic (IARC, 2013).
and related to meteorological conditions, emissions of
precursors and long-range transport of O3. Both short- and long-term exposure of children
and adults to air pollution can lead to reduced lung
function, respiratory infections and aggravated
1.3 Effects of air pollution asthma. Maternal exposure to ambient air pollution
is associated with adverse impacts on fertility,
pregnancy, new-borns and children (WHO, 2005,
1.3.1 Human health 2013b). There is also emerging evidence that
exposure to air pollution is associated with new-onset
Air pollution is a major cause of premature death type 2 diabetes in adults, and it may be linked to
and disease and is the single largest environmental obesity, systemic inflammation, ageing, Alzheimer's
health risk in Europe (Lim et al., 2012; WHO, 2014, disease and dementia (RCP, 2016, and references
2016a; GBD 2016 Risk Factors Collaborators, 2017; therein; WHO, 2016b).
Box 1.1 Ambient air measurements
The analysis of concentrations in relation to the defined EU and WHO standards is based on measurements at fixed
sampling points. Only measurement data received by 4 June 2018 (3) were included in the analysis and, therefore, the
maps, figures and tables reflect this data. Data officially reported after that date are regularly updated in the Air Quality
e-Reporting Database (EEA, 2018a).
Fixed sampling points in Europe are situated at four types of sites:
• traffic-oriented locations ('traffic');
• urban and suburban background (non-traffic, non-industrial) locations ('urban');
• industrial locations (or other, less defined, locations: 'other'); and
• rural background sites ('rural').
For most of the pollutants (sulphur dioxide (SO2), nitrogen dioxide (NO2), O3, PM and carbon monoxide (CO)), monitoring
stations have to fulfil the criterion of reporting more than 75 % of valid data out of all the possible data in a year to be
included in this assessment. The Ambient Air Quality Directive (EU, 2008) sets the objective for them of a minimum data
capture of 90 % but, for assessment purposes, the more relaxed coverage of 75 % allows more stations to be taken into
account without a significant increase in monitoring uncertainties (ETC/ACM, 2012).
For benzene (C6H6), the required amount of valid data for the analysis is 50 %. For toxic metals (arsenic (As), cadmium
(Cd), nickel (Ni) and lead (Pb)) and benzo[a]pyrene (BaP), it is 14 % (according to the air quality objectives for indicative
measurements; EU, 2004, 2008).
The assessment in this report does not take into account the fact that Member States may use supplementary assessment
modelling. Furthermore, in the cases of PM and SO2, nor does it account for the fact that the Ambient Air Quality Directive
(EU, 2008) provides the Member States with the possibility of subtracting contributions to the measured concentrations
from natural sources and winter road sanding/salting.
(3) Italy, however, resubmitted data after this date. The new data have been considered. A change of status has occurred in four stations: two stations
have changed from above to below the Pb limit value; and two stations have changed from above to below the BaP target value.
Air quality in Europe — 2018 report 11Introduction
While this report focuses only on ambient 1.3.2 Ecosystems
(outdoor) air quality, indoor air pollution also
poses considerable impacts on health, especially in Air pollution has several important environmental
homes that use open fires for heating and cooking impacts and may directly affect vegetation and
(Lim et al., 2012; WHO, 2013b; RCP, 2016). fauna, as well as the quality of water and soil and
Table 1.1 Air quality standards for the protection of health, as given in the EU Ambient Air Quality
Directives
Pollutant Averaging period Legal nature and concentration Comments
PM10 1 day Limit value: 50 μg/m 3
Not to be exceeded on more than
35 days per year
Calendar year Limit value: 40 μg/m3
PM2.5 Calendar year Limit value: 25 μg/m3
Exposure concentration Average Exposure Indicator (AEI) (a) in 2015
obligation: 20 μg/m3 (2013-2015 average)
National Exposure reduction AEI (a) in 2020, the percentage reduction
target: 0-20 % reduction in depends on the initial AEI
exposure
O3 Maximum daily 8-hour mean Target value: 120 µg/m3 Not to be exceeded on more than
25 days/year, averaged over 3 years (b)
Long-term objective: 120 µg/m3
1 hour Information threshold: 180 µg/m3
Alert threshold: 240 µg/m3
NO2 1 hour Limit value: 200 µg/m3 Not to be exceeded on more than
18 hours per year
Alert threshold: 400 µg/m3 To be measured over 3 consecutive hours
over 100 km2 or an entire zone
Calendar year Limit value: 40 µg/m3
BaP Calendar year Target value: 1 ng/m3 Measured as content in PM10
SO2 1 hour Limit value: 350 µg/m3 Not to be exceeded on more than 24 hours
per year
Alert threshold: 500 µg/m3 To be measured over 3 consecutive hours
over 100 km2 or an entire zone
1 day Limit value: 125 µg/m3 Not to be exceeded on more than
3 days per year
CO Maximum daily 8-hour mean Limit value: 10 mg/m3
C6H6 Calendar year Limit value: 5 µg/m3
Pb Calendar year Limit value: 0.5 µg/m3 Measured as content in PM10
As Calendar year Target value: 6 ng/m 3
Measured as content in PM10
Cd Calendar year Target value: 5 ng/m 3
Measured as content in PM10
Ni Calendar year Target value: 20 ng/m3 Measured as content in PM10
Notes: (a) AEI: based upon measurements in urban background locations established for this purpose by the Member States, assessed as a
3-year running annual mean.
(b) In the context of this report, only the maximum daily 8-hour means in 2016 are considered, so no average over the period 2014-2016
is presented.
Sources: EU, 2004, 2008.
12 Air quality in Europe — 2018 reportIntroduction
Table 1.2 Air quality standards, for the protection of vegetation, as given in the EU Ambient Air Quality
Directive and the CLRTAP
Pollutant Averaging period Legal nature and concentration Comments
O3 AOT40 ( ) accumulated
a
Target value, 18 000 µg/m .hours3
Averaged over 5 years (b)
over May to July
Long-term objective, 6 000 µg/m3.hours
AOT40 (a) accumulated Critical level for the protection of forests: Defined by the CLRTAP
over April to September 10 000 µg/m3.hours
NOx Calendar year Vegetation critical level: 30 µg/m3
SO2 Winter Vegetation critical level: 20 µg/m3 1 October to 31 March
Calendar year Vegetation critical level: 20 µg/m3
Notes: (a) AOT40 is an indication of accumulated ozone exposure, expressed in μg/m3.hours, over a threshold of 40 ppb. It is the sum of the
differences between hourly concentrations > 80 μg/m3 (40 ppb) and 80 μg/m3 accumulated over all hourly values measured between
08:00 and 20:00 (Central European Time).
(b) In the context of this report, only yearly AOT40 concentrations are considered, so no average over 5 years is presented.
Sources: EU, 2008; UNECE, 2011.
Table 1.3 WHO air quality guidelines (AQG) and estimated reference levels (RL) (a)
Pollutant Averaging period AQG RL Comments
PM10 1 day 50 μg/m3 99th percentile (3 days per year)
Calendar year 20 μg/m 3
PM2.5 1 day 25 μg/m3 99th percentile (3 days per year)
Calendar year 10 μg/m 3
O3 Maximum daily 8-hour mean 100 µg/m3
NO2 1 hour 200 µg/m3
Calendar year 40 µg/m3
BaP Calendar year 0.12 ng/m3
SO2 10 minutes 500 µg/m3
1 day 20 µg/m3
CO 1 hour 30 mg/m3
Maximum daily 8-hour mean 10 mg/m3
C6H6 Calendar year 1.7 µg/m3
Pb Calendar year 0.5 µg/m3
As Calendar year 6.6 ng/m3
Cd Calendar year 5 ng/m3 (b)
Ni Calendar year 25 ng/m3
Notes: (a) As WHO has not set an AQG for BaP, C6H6, As and Ni, the reference level was estimated assuming an acceptable risk of additional
lifetime cancer risk of approximately 1 in 100 000.
(b) AQG set to prevent any further increase of Cd in agricultural soil, likely to increase the dietary intake of future generations.
Sources: WHO, 2000, 2006a.
Air quality in Europe — 2018 report 13Introduction
the ecosystem services that they support. For example, 1.3.4 The built environment and cultural heritage
nitrogen oxides (NOx, the sum of nitrogen monoxide
(NO) and NO2) and ammonia (NH3) emissions disrupt Air pollution can damage materials, properties,
terrestrial and aquatic ecosystems by introducing buildings and artworks, including Europe's culturally
excessive amounts of nutrient nitrogen. This leads to most significant buildings. The impact of air pollution
eutrophication, which is an oversupply of nutrients that on cultural heritage materials is a serious concern
can lead to changes in species diversity and to invasions because it can lead to the loss of parts of our history
of new species. NOx, together with SO2, also contribute and culture. Damage includes corrosion (caused by
to the acidification of soil, lakes and rivers, causing acidifying compounds), biodegradation and soiling
biodiversity loss. Finally, ground-level O3 damages (caused by particles), and weathering and fading of
agricultural crops, forests and plants by reducing their colours (caused by O3).
growth rates and has negative impacts on biodiversity
and ecosystem services. A recent paper (Tidblad et al., 2017) found that corrosion
and pollution decreased significantly from 1987 to
2014, even though the rate of decrease slowed down
1.3.3 Climate change after 1997. SO2 levels and the corrosion of carbon steel
and copper decreased after 1997, especially in urban
Air pollution and climate change are intertwined. Several areas, while the corrosion or soiling of other materials
air pollutants are also climate forcers, which have a (apart from zinc) decreased very little, if at all, after 1997.
potential impact on climate and global warming in the
short term. Tropospheric O3 and black carbon (BC), a
constituent of PM, are examples of air pollutants that 1.3.5 Economic impacts
are short-lived climate forcers and that contribute
directly to global warming. Other PM components, such The effects of air pollution on health, crop and
as organic carbon, ammonium (NH4+), sulphate (SO42–) forest yields, ecosystems, the climate and the built
and nitrate (NO3–), have a cooling effect (IPCC, 2013). In environment also entail considerable market and
addition, changes in weather patterns due to climate non-market costs. The market costs of air pollution
change may alter the transport, dispersion, deposition include reduced labour productivity, additional
and formation of air pollutants in the atmosphere. health expenditure, and crop and forest yield losses.
Increasing temperature, for instance, will increase the The Organisation for Economic Co-operation and
emissions of biogenic volatile organic compounds Development (OECD) projects that these costs will
(VOCs), which are O3 precursors, and emissions from increase to reach about 2 % of European gross
wildfires and dust events. In addition to its warming domestic product (GDP) in 2060 (OECD, 2016), leading
effect, O3 impairs vegetation growth, as indicated above, to a reduction in capital accumulation and a slowdown
by reducing vegetation's uptake of carbon dioxide in economic growth.
(CO2). Climate change alters environmental conditions
(e.g. temperature, pH) that modify the bio-availability of Non-market costs are those associated with increased
pollutants (e.g. metals and POPs), the exposure, uptake mortality and morbidity (illness causing, for example,
and sensitivity of species to pollutants (Noyes et al., 2009; pain and suffering), degradation of air and water quality
Staudt et al., 2013). Consequently, climate change may and consequently the health of ecosystems, as well as
magnify the adverse environmental effects of pollutants, climate change.
including O3, toxic metals and persistent organic
pollutants (POPs) (Hansen and Hoffman, 2011; Staudt et In 2015, more than 80 % of the total costs (market and
al., 2013). non-market) of outdoor air pollution in Europe were
related to mortality, while market costs were less than
Air quality and climate change should be tackled jointly 10 %, (OECD, 2016). OECD (2016) estimates that the
using policies and measures that have been developed total costs for the OECD region amount to USD 1 280
through an integrated approach. These integrated (around EUR 1 100) per capita for 2015 and USD 2 880
policies would avoid the negative impact of climate to USD 2 950 (around EUR 2 480 to 2 540) per capita
policies on air quality, or vice versa, which has already for 2060, corresponding to about 5 % of income in
been evidenced. Examples are the negative impacts both 2015 and 2060. The non-market costs of outdoor
on air quality arising from the subsidising of diesel cars air pollution amount to USD 1 200 (around EUR 1 030)
(which have lower CO2 but higher PM and NOx emissions) per capita in 2015 and are projected to increase
and from the increased use of biomass combustion to USD 2 610-2 680 (around EUR 2 250-2 310) in 2060
without adequate emission controls. in the OECD region.
14 Air quality in Europe — 2018 reportIntroduction
1.4 International policy global, regional and sub-regional assessments. In the
2017 meeting, Resolution 3/8 (UNEP, 2017) urged the
Increased recognition of the effects and costs of air Member States to put in place policies and measures
pollution has lead international organisations, national to prevent and reduce air pollution from significant
and local authorities, industry and non-governmental sources.
organisations (NGOs) to take action.
Air quality is closely linked to the Sustainable
At international level, the United Nations Economic Development Goals (4) (SDGs) and several of the goals,
Commission for Europe (UNECE), the WHO and UN concerning health, welfare and urbanisation, implicitly
Environment, among others, have recently decided on include air quality issues . For instance, SDG-3 (Good
global actions to address the long-term challenges of health and well-being) targets substantially reducing
air pollution. the number of deaths and illnesses caused by air
pollution by 2030, and SDG-11 (Sustainable cities and
The UNECE Convention on Long-range Transboundary communities) targets reducing the adverse per capita
Air Pollution (LRTAP Convention; UNECE, 1979) environmental impact of cities by 2030, through paying
addresses emissions of air pollutants via its particular attention to air quality.
various protocols, among which the 2012 amended
Gothenburg Protocol is key in reducing emissions of
selected pollutants across the pan-European region. 1.5 European Union legislation
The UNECE Eighth Environment for Europe Ministerial
Conference, held in Batumi, Georgia, in June 2016, The EU has been working for decades to improve air
approved the declaration 'Greener, cleaner, smarter!' quality by controlling emissions of harmful substances
(UNECE, 2016). It recognised air pollution as a serious into the atmosphere, improving fuel quality, and
environmental health threat and made a commitment integrating environmental protection requirements into
to improve air quality by (1) integrating air pollution the transport, industrial and energy sectors. Figure 1.1
reduction measures into financial, development and illustrates the framework of the EU's clean air policy,
other sectoral policies as appropriate, (2) cooperation based on three main pillars (European Commission,
to address transboundary impacts and enhanced 2018a):
policy coordination, and (3) coherence at national and
regional levels. It also pledged to ensure adequate 1. Ambient air quality standards set out in the
monitoring of air pollution as well as public access to Ambient Air Quality Directives (EU, 2004, 2008)
relevant information. (see tables 1.1 and 1.2), requiring the Member
States to adopt and implement air quality plans
The WHO Regional Office for Europe held its Sixth and meet standards in order to protect human
Ministerial Conference on Environment and Health health and the environment;
in Ostrava, Czechia, in June 2017. The declaration of
this conference (WHO, 2017a) resolved, among other 2. National emission reduction targets established
things, to protect and promote people's health and in the National Emission Ceilings (NEC) Directive
well-being by actively improving air quality to meet (EU, 2016), requiring Member States to develop
the WHO air quality guidelines (WHO, 2000, 2006a). National Air Pollution Control Programmes by 2019
These guidelines (see Table 1.3) are designed to offer in order to comply with their emission reduction
guidance in reducing the health impacts of air pollution commitments;
and are based on expert evaluation of current scientific
evidence. They are currently under review. 3. Emission and energy efficiency standards for key
sources of air pollution, from vehicle emissions to
The United Nations Environment Assembly (UNEA) products and industry. These standards are set
of the United Nations Environment Programme, in out in EU legislation targeting industrial emissions,
its Resolution 1/7 on air quality, 2014 (UNEP, 2014), emissions from power plants, vehicles and
requested that UN Environment support governments transport fuels, as well as the energy performance
in their efforts to implement the resolution through of products and non-road mobile machinery (5).
capacity-building activities; awareness-raising;
strengthened cooperation on air pollution; monitoring The Seventh Environment Action Programme,
and assessment of air quality issues; and undertaking 'Living well, within the limits of our planet' (EU, 2013)
(4) These goals were set in the United Nations' (UN) 2030 Agenda for Sustainable Development (UN, 2015b), covering the social, environmental and
economic development dimensions at a global level (UN, 2015a).
(5) For more information on the specific legislation, please check http://ec.europa.eu/environment/air/quality/existing_leg.htm.
Air quality in Europe — 2018 report 15Introduction
recognises the long-term goal within the EU to achieve The CAPE also envisages a regular update of the impact
'levels of air quality that do not give rise to significant assessment analysis, to track progress towards the
negative impacts on, and risks to, human health and objectives of the Ambient Air Quality Directives. In
the environment'. To meet this goal, effective air quality 2018, the European Commission published the First
policies require cooperation and action at global, clean air outlook (European Commission, 2018b). It
European, national and local levels. In line with the concluded that the package of measures that has been
principle of subsidiarity, policies must be developed adopted since 2013 is expected to surpass the health
at national, regional and local levels, implementing impact reduction by 2030, as anticipated in the CAPE.
measures tailored to specific needs and circumstances. However, it also recognises that there is an urgent
short-term need to take decisive action to achieve the
The Clean Air Programme for Europe (CAPE), published objectives of the Ambient Air Quality Directives, at all
by the European Commission in late 2013 (European governance levels.
Commission, 2013), aims to ensure full compliance
with existing legislation by 2020 at the latest, and to In relation to the Ambient Air Quality Directives
further improve Europe's air quality, so that by 2030 (EU, 2004, 2008), the European Commission
the number of premature deaths is reduced by half started a 2-year process in 2017 to fitness
when compared with 2005. Following the proposals check them. The process aims to examine the
made in this context, the NEC Directive was revised and performance of the Ambient Air Quality Directives.
approved in 2016 (see bullet point 2 above) and a new It builds on the analysis underlying the CAPE and
directive (EU, 2015) on the limitation of emissions of will draw on experience in all Member States,
certain pollutants from medium combustion plants was focusing on the period 2008-2018. It will look
approved in 2015. It regulates pollutant emissions from at the fitness-for-purpose of all the Directives'
the combustion of fuels in plants with a rated thermal provisions, and in particular the monitoring and
input equal to or greater than 1 megawatt (MWth) and assessment methods, the air quality standards, the
less than 50 MWth. provisions on public information, and the extent to
which the Directives have facilitated action to prevent
In addition, the EU is supporting and facilitating the or reduce adverse impacts. Administrative costs,
Member States to take the measures necessary to overlaps and/or synergies, gaps, inconsistencies
meet their targets, and the enforcement action to help and/or potentially obsolete measures will also be
ensure that the common objective of clean air for all addressed, as well as the coherence of air quality
Europeans is achieved across the EU. This includes the governance between EU, Member States, regional and
EU Urban Agenda and Urban Innovative Actions, which local levels. Under current planning, the fitness check
facilitate cooperation with and among city actors to will be concluded in 2019 (European Commission,
address air pollution in urban areas across the EU. 2017a).
Figure 1.1 EU clean air policy – the policy framework
Emissions
Source-specific National Emission
emission standards Ceilings Directive
- Industrial Emissions Directive National emission
- Medium Combustion Plants Directive totals: (SO2, NOx, VOC, PM2.5, NH3)
- Eco-design Directive
- Energy efficiency
- Euro and fuel standards
Concentrations
Air Quality Directives
Maximum
concentrations
of ambient
air pollutants
16 Air quality in Europe — 2018 reportIntroduction
In addition to the specific legislation on air, the European and measures for zones and agglomerations where
Commission prioritises a strong Energy Union and a concentrations of pollutants exceed the EU standards
clean, safe and connected mobility, and is committed (and of maintaining quality where it is good, see also
to meeting the targets of the Paris Agreement on Section 1.5).
decarbonisation. It has, inter alia, introduced measures
on: (1) cleaner vehicles, i.e. new CO2 standards for cars Most of the measures reported by the Member States
and vans and, for the first time, trucks; (2) updating under the Ambient Air Quality Directives (EU, 2004,
road pricing, to encourage less polluting modes of 2008) over the last 3 years are aimed at reducing
transport and to ease traffic congestion; and (3) concentrations of and the number of exceedances of
promoting alternative energies, such as electric cars, the limit values of PM10 and NO2 (EEA, 2018b). In general,
with new measures to improve the deployment of the road transport sector is the largest contributor
charging infrastructure and an action plan for batteries to total nitrogen dioxide emissions in the EU, while
(European Commission, 2018a). fuel combustion in the commercial, institutional and
households sector is the largest contributor to overall
Europe is actively addressing the issue of toxic metal primary particulate matter emissions, particularly in
releases to the environment through the implementation some eastern European countries (see Chapter 2).
of the Industrial Emission Directive (2010/75/EU), the Most reported measures address the road transport
CLRTAP 1998 Protocol on Heavy Metals, and the Mercury sector (Figure 1.2). The main measures related to traffic
Regulation (2017/852/EU) as a response to the Minamata are encouraging a shift among transport modes; land
Convention on Mercury (UN, 2013). In addition, the use planning to ensure sustainable transport facilities;
Water Framework Directive (2000/60/EC) establishes a improving public transport; and public procurement. The
requirement for achieving good ecological and chemical second and third most-targeted sectors are commercial
status in European waters. This includes targets for and residential combustion, and industry in the case
reducing heavy metal concentrations. of PM10, and industry, and commercial and residential
combustion for NO2. Measures targeting industry and
the commercial and residential combustion sectors
1.6 National and local measures to are mainly targeting a shift towards low-emission fuels,
improve air quality in Europe emission control equipment and retrofitting. Lastly,
measures focusing on public information are important
Air quality plans and measures to reduce air pollutant in all cases. They typically aim to give the public targeted
emissions and improve air quality have been information about individual actions that they can
implemented throughout Europe and form a core take to reduce air pollution. The local administrative
element in air quality management. The Ambient Air level is responsible for the majority of planning and
Quality Directives (EU, 2004, 2008) set the obligation implementation with regard to these measures
of developing and implementing air quality plans (EEA, 2018h).
Figure 1.2 Sectors addressed by the measures reported by the EU-28 Member States for PM10 and NO2
%
70
60
50
40
30
20
10
0
Agriculture Commercial- Industry Off-road Other Shipping Transport
Residential
NO2 PM10
Source: EEA, 2018h.
Air quality in Europe — 2018 report 17Sources and emissions of air pollutants
2 Sources and emissions of air pollutants
Air pollutants may be categorised as primary or 2.1 Total emissions of air pollutants
secondary. Primary pollutants are directly emitted to
the atmosphere, whereas secondary pollutants are Figure 2.1 shows the total emissions of pollutants in
formed in the atmosphere from precursor pollutants the EU-28, indexed as a percentage of their value in
through reactions. Air pollutants may have a natural, the reference year 2000. As can be seen, emissions of
anthropogenic or mixed origin, depending on their all primary and precursor pollutants contributing to
sources or the sources of their precursors. ambient air concentrations of PM, O3 and NO2, as well
as As, Cd, Ni, Pb, Hg and BaP (7), decreased between
Key primary air pollutants include PM, BC, sulphur 2000 and 2016 in the EU-28 (Figure 2.1) and the
oxides (SOx), NOx (which includes both NO and EEA-33 (8). SO2 emissions have exhibited the largest
NO2), NH3, CO, methane (CH4), non-methane volatile reduction (76 % in the EU-28 and 62 % in the EEA-33)
organic compounds (NMVOCs) including C6H6 (6), since 2000, while NH3 emissions have exhibited the
certain metals and polycyclic aromatic hydrocarbons smallest reductions (9 % in the EU-28 and 5 % in
(PAH, including BaP). the EEA-33). Furthermore, in the period 2013-2016,
NH3 emissions have increased in the agriculture sector
Key secondary air pollutants are PM (formed in the by about 3% (EEA, 2018e). Generally, reductions of
atmosphere), O3, NO2 and a number of oxidised VOCs. emissions in the EU-28 and EEA-33 were similar. There
Key precursor gases for secondary PM are SO2, NOx, were slightly larger reductions in the EU-28 than in the
NH3 and VOCs. The gases NH3, SO2 and NOx react in the EEA-33, with the exception of As, BaP, Hg and PM2.5
atmosphere to form NH4+, SO42– and NO3– compounds. where reductions were slightly higher in the EEA-33
These compounds form new particles in the air or than in the EU-28 (although here the differences were
condense onto pre-existing ones to form secondary less than 1.2 %).
PM (also called secondary inorganic aerosols). Certain
NMVOCs are oxidised to form less volatile compounds, In recent years, a large proportion of emissions
which form secondary organic aerosols. Ground-level has shown significant absolute decoupling (9)
(tropospheric) O3 is not directly emitted into the from economic activity, which is desirable for
atmosphere. Instead, it is formed from chemical both environmental and productivity gains. This
reactions in the presence of sunlight, following is indicated by a reduction in EU-28 air pollutant
emissions of precursor gases, mainly NOx, NMVOCs emissions contrasting with an increase in EU-28 GDP
and CH4. These precursors can be of both natural (10) (Eurostat, 2018a), which effectively means that
(biogenic) and anthropogenic origin. NOx also depletes there are now fewer emissions for each unit of GDP
tropospheric O3 as a result of the titration reaction with produced per year. The greatest decoupling has been
the emitted NO to form NO2 and oxygen (O3 formation for SOx, CO, NOx, certain metals (Ni, Pb, Cd, Hg) and
cycle, see also Chapter 5). organic species (NMVOC and BC), for which emissions
(6) There is no separate emission inventory for C6H6, but it is included as a component of NMVOC.
(7) The emissions reported from Portugal for the activity 'asphalt blowing in refineries' were not taken into account to ensure consistency between
nationally reported data (they were not reported by any other country).
(8) The analysis of the development of emissions in Europe is based on emissions reported by the countries (EEA, 2018e, 2018c). The nominal
increase or decrease in reported emissions is analysed, not statistical trends.
(9) 'Absolute decoupling' is when a variable is stable or decreasing when the growth rate of the economic driving force is growing, while 'relative
decoupling' is when the growth rate of the variable is positive but less than the growth rate of the economic variable (OECD, 2002).
(10) Based on chain-linked volumes (2010), in euros, to obtain a time-series adjusted for price changes (inflation/deflation).
18 Air quality in Europe — 2018 reportSources and emissions of air pollutants
Figure 2.1 Development in EU-28 emissions, 2000-2016 (% of 2000 levels): a) SOX, NOX, NH3, PM10, PM2.5,
NMVOCs, CO, CH4 and BC. Also shown for comparison is EU-28 gross domestic product (GDP
expressed in chain-linked volumes (2010), % of 2000 level); b) As, Cd, Ni, Pb, Hg and BaP
a)
Index (% of 2000)
140
120
100
80
60
40
20
0
2000 2001 2002 2003 2004 2005 2006 2007 2008 2009 2010 2011 2012 2013 2014 2015 2016
SOx NOx NH3 PM10 PM2.5 NMVOCs CO CH4 BC GDP
b)
Index (% of 2000)
140
120
100
80
60
40
20
0
2000 2001 2002 2003 2004 2005 2006 2007 2008 2009 2010 2011 2012 2013 2014 2015 2016
As Cd Ni Pb Hg BaP
Notes: CH4 emissions are total emissions (Integrated Pollution Prevention and Control sectors 1-7) excluding sector 5: Land use, land-use
change and forestry. The present emission inventories include only anthropogenic VOC emissions.
Sources: EEA, 2018c, 2018e; Eurostat, 2018a.
Air quality in Europe — 2018 report 19You can also read