Oyster River Integrated Watershed Plan for Nitrogen Load Reductions
←
→
Page content transcription
If your browser does not render page correctly, please read the page content below
Oyster River Integrated Watershed Plan
for Nitrogen Load Reductions
Final Technical Report - July 2014

PREPARED FOR                  PREPARED BY
Town of Durham                Vanasse Hangen Brustlin, Inc.
University of New Hampshire
Durham, New Hampshire         IN COLLABORATION WITH
                              Woodard and Curran, Inc.
                              Portland, Maine
\\nhbedata\projects\52226.00\reports\Overall IPP Watershed
                                                             ii   Table of Contents
Report\2014-07-10-ORIWMP-v12-Final.docx
Contents
Contents ........................................................................................................................................................ iii
Executive Summary .................................................................................................................................... EX-1
Introduction ................................................................................................................................................. 1-1
1.1 Report Organization .......................................................................................................................... 1-1
1.2 Existing Durham/UNH Permit Status and Regulatory Drivers ........................................................... 1-1
1.3 Durham / UNH’s Proposed Integrated Planning and Permitting Approach ...................................... 1-2
1.4 Examples of NPS Controls Used to Offset Wastewater Treatment ................................................... 1-3
Existing Wastewater Treatment Facility ...................................................................................................... 2-1
2.1 Existing Treatment Operations .......................................................................................................... 2-1
2.2 Pilot “Optimization” Study ................................................................................................................ 2-1
2.3 Preliminary Cost Estimates and Load Reductions for to Meet an Effluent Limit of 5 or 3 mg/L ....... 2-2
Review of Existing Water Quality Data ........................................................................................................ 3-1
3.1 Status of Great Bay & Local Water Resources in Oyster River Watershed ....................................... 3-1
3.2 Existing Water Quality Data in the Watershed .................................................................................. 3-1
3.3 UNH Water Resources Research Center............................................................................................ 3-4
3.4 UNH Water Systems Analysis Group ................................................................................................. 3-7
3.5 General Summary of Findings in Review of Existing Water Quality Data .......................................... 3-7
Modeling of Nonpoint Sources in the Oyster River Watershed ................................................................... 4-1
4.1 Introduction ....................................................................................................................................... 4-1
4.2 Watershed Description ...................................................................................................................... 4-1
4.3 Model Background ............................................................................................................................ 4-2
4.4 Initial Model Inputs and Assumptions ............................................................................................... 4-5
4.5 Modeling Results ............................................................................................................................... 4-8
4.6 Comparison of Load Estimates to Existing Water Quality Data ...................................................... 4-12
4.7 Implications of Modeling Results for Nonpoint Source Control Measures ..................................... 4-16
Draft Nitrogen Control Plan for Nonpoint Sources ...................................................................................... 5-1
5.1 Existing Measures and Programs....................................................................................................... 5-1
5.2 Evaluation of Management Strategies for Nonpoint Source Control ................................................ 5-2
5.3 Overview of the Screening Analysis to Identify Management Measure ........................................... 5-2
5.4 Potential Development of a “Bay Friendly” Lawn Fertilizer Program ............................................... 5-3
5.5 Potential Management Strategies for Agriculture in Durham and UNH ........................................... 5-6
5.6 Potential Management Strategies for Impervious Cover Areas in Durham and UNH ....................... 5-8
5.7 Potential Management Strategies for Existing Septic Systems in Durham ..................................... 5-13
5.8 Urine Segregation or Diversion ....................................................................................................... 5-16
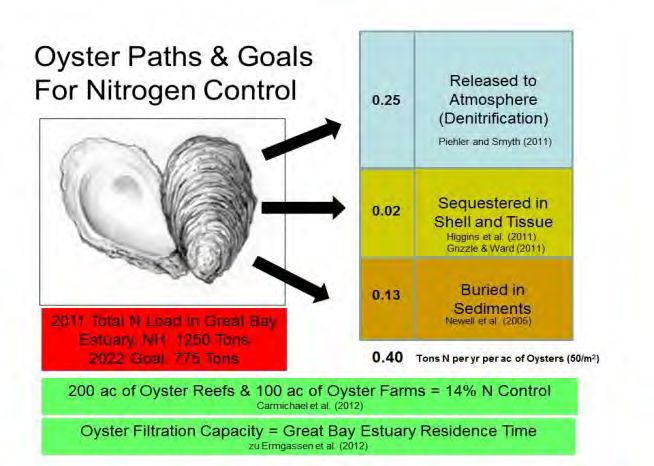
5.9 Oyster Bed Restoration ................................................................................................................... 5-17
5.10 Preliminary Cost Estimates for the Possible Nitrogen Control Program ......................................... 5-18
Tracking and Accounting for Future Nitrogen Control Program .................................................................. 6-1
6.1 Overview of Tracking and Accounting for Regulatory Compliance ................................................... 6-1
6.2 Relevant Activities for Tracking and Accounting ............................................................................... 6-1
6.3 An Evaluation of other Tracking and Accounting System Developments ......................................... 6-3
6.4 Various Options for a Tracking and Accounting Procedure ............................................................... 6-3
Recommendations to Advance the Integrated Permitting Process ............................................................. 7-1
Potential Grant Funding Programs ............................................................................................................... 8-1
                         References.................................................................................................................................................... 9-1

Appendices
                  A: EPA Water Quality Trading Case Study Fact Sheets
                  B: Durham Resident Survey Results on Fertilizer Usage
                  C: Draft Interim Water Quality Reports (UNH WRRC and WSAG)
                  D: Data Input and Assumptions used in the Oyster River Watershed Load Assessment
                  E: Management Measures Screening Analysis Memo

Tables
    Table 2.1: Estimated Costs for WWTF Upgrades to Achieve an Effluent Limit of 5 and 3 mg/L ..................................... 2
    Table 2.2: Estimated Difference in Annual Nitrogen Loads with Effluent Limits of 5 and 3 mg/L .................................. 2
    Table 3.1: Estimated Nitrogen Loads Based on NH PREP Monthly Data from 2008 to 2011 .......................................3-2
    Figure 3.1 a & b: Observed Mean Nitrate-N Concentrations (mg/L) for Oyster River Stations ...................................3-3
    Figure 3.2 a & b: Observed Mean Ammonia-N Concentrations for Oyster River & Tributary Stations .......................3-3
    Figure 3.3 a & b: Observed Mean Dissolved Nitrogen Conc. for Oyster River & Tributary Stations ............................3-4
    Figure 3.4: UNH WRRC Sample Sites for Various Tributary Streams and Oyster River Main Stem ..............................3-5
    Table 3.2: Sampling Information for Stations in the Oyster River Watershed by the UNH WRRC...............................3-5
    Table 3.3: Flow-Weighted Mean Concentrations1 For Streams in the Oyster River Watershed .................................3-6
    Table 3.4: Estimated Nitrogen Loads (lbs/ac/yr) at Each Station based on the Sampling Data ...................................3-6
    Table 4.1: Listing of Nitrogen Sources and Land Use Types Used in the Oyster River NLM Model .............................4-5
    Table 4.2: Local Data Sources Used to Quantify Land Uses & Nitrogen Sources in the Watershed ............................4-6
    Table 4.3: Model Load Estimates for Each Jurisdictional Area within the Watershed .................................................4-8
    Table 4.4: Model Load Estimates by Source in the Oyster River Watershed, Durham and UNH Campus ...................4-9
    Figure 4.3: Estimated Nitrogen Loads by Source Type and Jurisdictional Area ...........................................................4-9
    Table 4.5: Nitrogen Load Estimates by Land Use/Source for the Watershed, Durham & UNH .................................4-10
    Figure 4.4: Estimated Nitrogen loads by Land Use/Source in the OR Watershed, Durham and UNH .......................4-10
    Table 4.6: Estimated Nitrogen Loads by Pathway for Watershed Area, Durham and UNH Campus .........................4-11
    Table 4.7: Estimated Stormwater Delivered Nitrogen Loads by Source or Land Use Input .......................................4-11
    Table 4.8: Estimated Nitrogen Loads on Aerial Basis for Each Sub-Watershed Area .................................................4-12
    Table 4.9: Comparison of Oyster River NLM Loads to Load Estimates Derived from Measured Data ......................4-12
    Table 5.2: Estimated Annual and Capital Costs for Potential Lawn Fertilizer Education Program ...............................5-5
    Table 5.3: Estimated Delivered Nitrogen Loads from Agricultural Fertilizer Use in Durham and UNH .......................5-6
    Table 5.4: Estimated Annual & Capital Costs for Potential Nutrient Management Program for UNH ........................5-8

\\nhbedata\projects\52226.00\reports\Overall IPP Watershed
                                                                iv     Table of Contents
Report\2014-07-10-ORIWMP-v12-Final.docx
Table 5.5: Model Estimates of Delivered Nitrogen Loads for Impervious Cover in Durham and UNH ........................5-9
    Table 5.6: Estimated Nitrogen Load Reductions for Measures Targeting UNH Impervious Cover ............................5-11
    Table 5.7: Estimated Nitrogen Load Reductions for Measures Targeting Durham Impervious Cover ......................5-12
    Table 5.8: Estimated Annual and Capital Costs for Potential Measures Targeting Impervious Cover .......................5-13
    Table 5.9: Estimated Delivered Nitrogen Loads from Septic Systems in the Oyster River Watershed ......................5-14
    Table 5.10: Estimated Load Reductions for Recommended Measures Related to Septic Systems ...........................5-15
    Table 5.11: Estimated Annual and Capital Costs for Potential Measures Targeting Septic Systems .........................5-16
    Table 5.12: Estimated Annual and Capital Costs for Potential Oyster Bed Restoration ............................................5-18
    Table 5.13: Preliminary Cost Estimates for Possible Nonpoint Source Control Program in Durham & UNH .............5-19
    Table 6.1: Potential List of Activities and Measures and Related Data Sources for Nitrogen Tracking .......................6-2
    Table 8.1: Summary of Existing State and Federal Grant Funding Programs for Funding Assistance..........................8-2

Figures
    Figure 3.1a & b: Observed Mean Nitrate-N Concentrations (mg/L) for Oyster River & Tributary Stations .................3-3
    Figure 3.2a & b: Observed Mean Ammonia-N Concentrations at Oyster River & Tributary Stations ..........................3-3
    Figure 3.3a & b: Observed Mean Total Dissolved Nitrogen Conc. for Oyster River & Tributary Stations ....................3-4
    Figure 3.4: UNH WRRC Sample Sites for Various Tributary Streams and Oyster River Main Stem ..............................3-5
    Figure 4.1: Map of Oyster River Watershed ................................................................................................................4-2
    Figure 4.2: Schematic of the Nitrogen Loading Model Inputs and Processes ..............................................................4-2
    Figure 4.3: Estimated Nitrogen Loads by Source Type and Jurisdictional Area ...........................................................4-9
    Figure 4.4: Estimated Nitrogen loads by Land Use/Source for the OR Watershed, Durham and UNH .....................4-10
    Figure 4.5: Map of Major Subawatershed Tributaries ..............................................................................................4-13

\\nhbedata\projects\52226.00\reports\Overall IPP Watershed
                                                             v   Table of Contents
Report\2014-07-10-ORIWMP-v12-Final.docx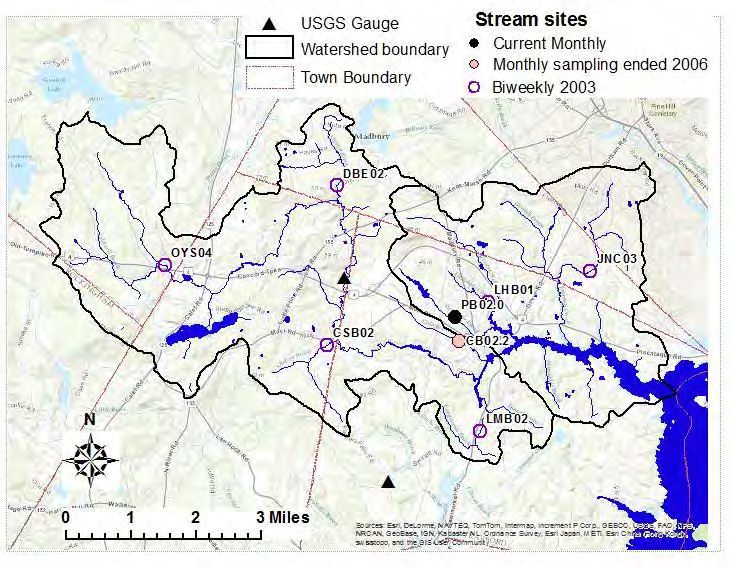
Executive Summary
The Town of Durham and the University of New Hampshire (UNH), as Project Partners, seek to develop a more cost-
effective and sustainable means to meet future permitting compliance needs and improve water quality in the
Oyster River watershed through an Integrated Permitting approach. This proposed approach, consistent with the
U.S Environmental Protection Agency’s (EPA) Integrated Planning and Permitting Policy (IP3) 1, would balance future
upgrades to Durham’s wastewater treatment facility (WWTF) with nonpoint and point source stormwater control
measures in an effort to reduce existing and future nitrogen loads to the Oyster River estuary as well as achieve
other water quality objectives.
Both Durham and UNH share in the use and the operating costs of Durham’s WWTF, which discharges to the tidal
portion of the Oyster River that leads to Great Bay Estuary. The WWTF is operating under an administratively
continued discharge permit that expired in December 2004. In anticipation of the next permit renewal, the Project
Partners are concerned with potentially being required to meet a “Limit of Technology” effluent limit of 3 mg/L for
total nitrogen that EPA has imposed on other communities in recent permits. The facility currently maintains a
relatively low effluent concentration for total nitrogen compared to other WWTF’s in the Seacoast region. The
Draft Facility Plan indicates that to meet a seasonal average effluent limit of 3 mg/L, a carbon supplement such as
ethanol or methanol may be needed to stimulate sufficient biological activity, especially in the cooler temperature
months. The use of a carbon supplement will not only result in much higher capital and operational costs but would
pose serious public health and safety concerns with respect to the storage and transport of a volatile compound. It
could also contribute to higher greenhouse gas emissions. As described herein, a balanced approach of using
nonpoint source (NPS) control measures in combination with a modest WWTF upgrade as part of an Integrated
Permit could achieve similar if not greater nitrogen load reductions in a more cost-effective and sustainable manner
than achieving a total nitrogen effluent limit of 3 mg/L. The added costs and increased public safety concerns
associated with the potential use of a carbon supplement could be avoided.
Both the Town and UNH are also subject to EPA’s MS4 Stormwater General Permit having adjacent regulated
urbanized areas that also drain to the Oyster River estuary. The 2003 MS4 General Permit has expired and is
expected to be renewed in the next six to twelve months. It is anticipated that the renewed MS4 permit will also
require reductions of existing nitrogen loads as well as other stormwater related pollutants given language included
in the NH DRAFT MS4 General Permit released in 2013. Given the overlapping requirements between the two
permit programs (i.e., wastewater and MS4), the Town and UNH believe an Integrated Permit approach would
result in greater economic and environmental benefits and eliminate duplication of efforts. This approach also
aligns with the Town’s and UNH’s close working relationship and shared use of the WWTF as well as other
stormwater and drinking water infrastructure.
This report presents the results of several recent planning and data collection efforts initiated by the Project
Partners to provide the technical basis for an Integrated Permitting approach. These efforts include a watershed
based modeling effort to estimate existing nitrogen loads from nonpoint sources, initial baseline water quality
monitoring at select locations within the watershed, an evaluation of potential management measures for nitrogen
load reduction and the development of a Draft Nitrogen Control Plan to identify and prioritize effective
management measures for future nitrogen load reductions within the watershed. This report also provides
1
June 2012, EPA Memo: Integrated Municipal Stormwater and Wastewater Planning Approach Framework
\\nhbedata\projects\52226.00\reports\Overall IPP Watershed
EX-1 Executive Summary
Report\2014-07-10-ORIWMP-v12-Final.docx
recommendations for next steps to advance this permitting approach as pending federal permits for Durham’s
WWTF and the NH MS4 Stormwater General Permit are renewed in the foreseeable future.

Both EPA and the New Hampshire Department of Environmental Services (NHDES) have initially endorsed Durham’s
and UNH’s proposed Integrated Permit approach and have suggested that it be pursued further for a variety of
practical and environmental reasons. EPA-Region 1 representatives, however, have indicated that due to limited
flexibility contained in the Clean Water Act (CWA), they may be required to include a Limit of Technology (LOT)
effluent limit of 3 mg/L in a NPDES permit regardless of whether other alternative NPS and stormwater control
measures may be equally or even more effective in reducing nitrogen loads. Having to meet this LOT requirement
will substantially raise future compliance costs and minimize the incentive to pursue other innovative and cost-
effective measures. Although there appears to be no precedent for an Integrated Permit in Region 1, numerous
case studies in other EPA regions have initiated Integrated Permits where NPS control measures have been used in
lieu of advanced wastewater treatment. EPA suggested that the proposed integrated approach could be done
through an Administrative Order on Consent (AOC) similar to those issued to Newmarket and Exeter. Although
AOC’s allow additional time to operate in a non-compliance mode to address more stringent permit requirements,
they do not necessarily allow for the integration of overlapping permit requirements nor offer the flexibility to
identify the best combination of measures to achieve the water quality objectives in the most cost-efficient manner.

The AOC’s issued to Newmarket and Exeter allow these communities to operate “out of compliance” for up to 10
years as long as they meet a number of conditions including meeting an interim seasonal effluent limit of 8 mg/l for
total nitrogen within 5 years, developing a watershed based allocation of nonpoint source nitrogen loads and
developing a Nitrogen Control Plan by 2017 to identify specific non-point source and stormwater point source
control measures that would be used within their respective towns to reduce existing nitrogen loads. In addition,
the communities must develop a tracking and accounting procedure to document, quantify and annually report
progress on nitrogen load reduction activities. By 2023, both Towns are required to submit an Engineering Report
to describe their progress in reducing existing nitrogen loads, provide an update on nitrogen levels in receiving
waters and a potential justification as to why additional WWTF upgrades are not necessary to meet an effluent of 3
mg/L for total nitrogen given recent success in reducing nitrogen loads and nitrogen levels in receiving waters based
on ongoing water quality monitoring data. These Towns are also subject to the MS4 Stormwater permit, which
would have to be addressed separately or in addition to the nonpoint source requirements included in the AOC.

The potential “non-compliance” or permit “violation” status associated with an AOC is also contrary to Durham’s
and UNH’s recent efforts to address nonpoint sources and in improving its WWTF. Durham already has a relatively
low seasonal average effluent concentration for nitrogen at its WWTF and both the Town and UNH have taken a
number of proactive steps to reduce pollutant loads from impervious cover. The Town was one of the first
communities in the region to update its local stormwater regulations for both new and redevelopment. More
importantly, the use of NPS controls as part of an Integrated Permit approach would result in additional water
quality benefits to upstream water bodies in the Oyster River watershed as well as the estuary for potentially far
less cost. Improvements to the WWTF would only result in water quality benefits to the estuary. The use of NPS
control measures would reduce other pollutants and would likely engage other watershed stakeholders as NPS
control measures are implemented and provide a model template for others to follow in implementing innovative
source control measures in other parts of the watershed, thus, resulting in greater nitrogen load reductions.

Durham and UNH wish to continue to discuss the benefits of an Integrated Permit approach with EPA and DES and
work towards to developing a permit approach that addresses the water quality objectives in a more cost-effective

 \\nhbedata\projects\52226.00\reports\Overall IPP Watershed
                                                              EX-2   Executive Summary
 Report\2014-07-10-ORIWMP-v12-Final.docx
manner while at the same time potentially achieve greater environmental benefits to result in a more positive triple
bottom-line outcome of enhanced financial, environmental and social benefits.
The watershed assessment component of this planning phase was based on an established nitrogen loading model
originally developed for the Buzzards Bay project in Massachusetts and more recently modified by the NHDES to
develop average annual nitrogen load estimates from nonpoint sources that are within the larger Great Bay
watershed. This model was refined even further as part of this effort in consultation with regional and local experts
involved with nitrogen research. The model indicates that nonpoint sources in the Oyster River watershed
contribute an average annual nitrogen load of approximately 73,440 pounds (36.7 tons), which is very similar to the
average annual load estimate calculated from existing water quality data collected in the Oyster River.
Approximately 80 percent of the estimated load is attributed to four major land use categories or human activities
including the use of lawn fertilizer, agricultural fertilizer (including manure), stormwater runoff from impervious
surfaces and nitrogen released from septic systems with each source contributed nearly equal amounts or nearly 20
percent of the total annual load. Almost half (47 percent) of the estimated annual watershed load or approximately
17.3 tons is associated with sources located within the Town of Durham and UNH’s Campus area. Excluding the
atmospheric load that falls directly on natural vegetation and surface water bodies which are considered to be
“unmanageable”, the annual nitrogen load attributed to sources located within Durham and UNH Campus that are
manageable was estimated to be approximately 14 tons (~10 tons for Durham and ~4 tons for UNH).
A Draft Nitrogen Control Plan was developed to estimate the potential nitrogen load reductions that may be
achieved through various NPS control measures using the model results and estimated removal efficiencies for a
variety of management measures. The estimated removal efficiencies were based primarily on the Implementation
documents developed for the Chesapeake Bay Watershed TMDL. The measures included in the Draft Control Plan
were estimated to reduce annual nitrogen loads by approximately 0.5 to 2.0 tons/year depending on the type and
number of control strategies and BMPs used, the geographical extent and duration of the implementation period.
To achieve the high end of the estimated load reduction range would require 3 acres of oyster bed restoration,
which accounted for nearly half of the estimated nitrogen removal and appears to be one of the most cost-effective
measures. Oyster bed restoration, however, would not improve water quality conditions in the upper portions of
the watershed. A nitrogen load reduction of 2.0 tons would more than compensate for the estimated additional
load differential if the wastewater treatment plant was upgraded to meet a seasonal average effluent limit of 5
mg/L instead of 3 mg/L, based on current discharge rates. Preliminary cost estimates indicate that achieving this
nitrogen load reduction target through NPS control measures instead of upgrading the WWTF to meet an effluent
limit of 3 mg/L could result in annual savings of between $200,000 and $300,000 depending on the selected control
strategies and as much as $3 to $4 million in savings over 20 years based on the estimated Life-Cycle costs.
Future discussions with the EPA and NHDES will be needed to reach consensus of the estimated removal credits for
the various NPS control measures included in the Draft Control Plan and to further advance the proposed integrated
permit framework and language as part of an Integrated Permitting approach. Completion of this process may
depend on the timing of when the pending MS4 Stormwater General Permit for New Hampshire is finalized.
\\nhbedata\projects\52226.00\reports\Overall IPP Watershed
EX-3 Executive Summary
Report\2014-07-10-ORIWMP-v12-Final.docxIntroduction
1.1 Report Organization
This report presents findings of several recent planning and monitoring studies that were conducted to develop the
technical framework for an Integrated Planning and Permitting approach in Durham, New Hampshire. The primary
focus of these studies was to inventory and quantify the nitrogen loads contributed from various nonpoint sources
(NPS) within the Oyster River watershed and identify the best combination of management measures that could be
used to reduce these estimated nitrogen loads delivered to the Oyster River estuary and larger Great Bay estuary.
These nonpoint sources evaluated include septic systems, chemical fertilizers used on lawns, managed turf and
agricultural fields, pet and livestock waste and stormwater runoff from impervious surfaces. The findings of these
studies are contained in this report and organized in the following manner:
Chapter 2.0 describes Durham’s Wastewater Treatment Facility and the considerations for treatment upgrades
to reduce nitrogen loads.
Chapter 3.0 summarizes recent water quality monitoring data collected in the Oyster River watershed used to
help describe baseline conditions and validate the model estimates.
Chapter 4.0 describes the watershed modeling approach used to estimate the nonpoint source loads.
Chapter 5.0 outlines various management measures identified to reduce nitrogen loads from nonpoint sources
as well as nitrogen harvesting techniques. The estimated load reductions associated with these measures were
based on literature data generated primarily by the Chesapeake Bay Watershed Program.
Chapter 6.0 describes considerations in developing a tracking and accounting procedure that will help to track
existing activities and source contributions and future actions that lead to nitrogen load reductions.
Chapter 7.0 provides recommendations to further advance the Integrated Planning and Permitting approach in
the future.
Chapter 8.0 summarizes various state and federal funding assistance programs that could be utilized to help
fund the implementation of various aspects of the proposed Integrated Permit.
1.2 Existing Durham/UNH Permit Status and Regulatory Drivers
Both the Town of Durham and the University of New Hampshire (UNH) share in the use and the costs of operating
Durham’s Wastewater Treatment Facility (WWTF), which discharges to the tidal portion of the Oyster River that
leads to the Great Bay Estuary. Durham, like many other communities in the Great Bay region, has been operating
under an administratively continued permit for this facility since it expired in 2004. The facility has a permitted
discharge rate of 2.5 million gallons per day (MGD) but currently has an average annual discharge flow of
approximately 1.0 MGD with about two-thirds of the volume coming from UNH. EPA has delayed issuing a new
wastewater discharge permit for the Durham facility to allow time to further develop an Integrated Permit
approach. Based on recent permits issued for other nearby Towns, the next wastewater discharge permit will most
likely contain a more stringent, “Limit of Technology” effluent limit of 3 mg/L for total nitrogen. The facility
currently maintains a rolling 7-month average effluent concentration that is below 8 mg/L for total nitrogen, which
is considerably lower than most if not all the other wastewater treatment facilities in the Great Bay region.
Both the Town and UNH are also subject to the requirements of EPA’s MS4 Stormwater General Permit. This permit
expired in 2008 and is expected to be renewed in the near future and perhaps by end of 2014. The DRAFT 2013
\\nhbedata\projects\52226.00\reports\Overall IPP Watershed
1-1 Introduction
Report\2014-07-10-ORIWMP-v12-Final.docxMS4 Stormwater Permit contains new provisions requiring communities to develop Water Quality Response Plans
(WQRPs) for stormwater outfalls that discharge to impaired water bodies. The entire Great Bay and all of its
tributaries are currently listed as impaired based on NHDES’ 2012 303(d) list due to several indicators that suggest
declining water quality conditions (e.g., low dissolved oxygen, increased abundance of phytoplankton and rooted
macro-algae, declining eelgrass habitat) and these declines may be linked to excessive nitrogen inputs although this
is still being studied by NHDES and has not been firmly established. College Brook, Pettee Brook and Beards Creek
are also listed as impaired due to elevated bacteria and chloride levels. The WQ Response Plans would need to
identify measures that would be used to reduce current pollutant loads from stormwater discharges located within
the regulated urbanized area and are contributing to these impaired waters. Since Durham and UNH are located in
the same watershed and already share in the costs of maintaining the WWTF as well as other infrastructure, this
presents an even more compelling reason to develop an Integrated Permit to address the potential overlapping
requirements for nitrogen load reductions between the pending MS4 permit and NPDES discharge permits. This
more holistic approach, which involves an assessment of all NPS sources within Durham’s and UNH’s jurisdiction
and not just the MS4 regulated areas is expected to be much more cost-effective and result in greater load
reductions than what would otherwise be achieved under the MS4 Program.
Recent NPDES wastewater permits issued for the Towns of Newmarket and Exeter requires their WWTF’s to meet a
seasonal average effluent limit of 3 mg/L for total nitrogen or the current “Limit of Technology.” The Limit of
Technology represents the lowest limit that can reasonably be expected given current technology. Since this
permit condition could not be readily met, both communities entered into Administrative Orders of Consent (AOC)
with EPA that outline a series of interim steps and milestones that leads to an alternative compliance path and
possibly not having to meet the LOT requirement. These interim steps focus on reducing existing nitrogen loads
through a combination of wastewater upgrades and nonpoint source control measures targeting nitrogen. The
communities agreed to meet an interim average seasonal effluent limit of 8 mg/L for nitrogen within five (5) years
and develop a Nitrogen Control Plan, complete with implementation schedule that outlines various measures that
would be used to reduce nitrogen loads from nonpoint sources. By 2023, the communities will need to submit an
Engineering Evaluation to justify why an effluent limit of 3 mg/L is not warranted given successful implementation
of various NPS control measures identified in their Nitrogen Control Plan and nitrogen levels in ambient waters are
trending lower as shown by future water quality monitoring data.
The Town and UNH are concerned with the significantly higher incremental costs involved with meeting an effluent
limit of 3 mg/L TN as well as the public health and safety issues related to the transport and onsite storage of
methanol or ethanol which may be needed as a supplemental carbon source to stimulate the biological activity
required to achieve 3 mg/L, especially in cooler months. The transport and storage of methanol or ethanol, which
are commonly used as carbon supplements, pose serious worker safety concerns as they are highly volatile and
potentially explosive. These compounds also pose environmental concerns as methanol can contribute to
greenhouse gases. The reliance on added chemicals is not considered economical or environmentally sustainable
and is not consistent with EPA’s sustainability concepts promoted in its Integrated Planning and Permitting Policy.
1.3 Durham / UNH’s Proposed Integrated Planning and Permitting Approach
As part of an Integrated Planning and Permitting process, Durham and UNH propose a balanced approach of using a
combination of nonpoint source control measures and WWTF treatment upgrades to identify the most cost-
effective and sustainable measures to reduce nitrogen loads to the Oyster River and Great Bay estuaries. To this
end, the Partners propose to optimize the WWTF treatment process to achieve a “Sustainable Limit of Technology”
that provides the greatest nitrogen reduction without using a carbon supplement and, at the same time, identify
\\nhbedata\projects\52226.00\reports\Overall IPP Watershed
1-2 Introduction
Report\2014-07-10-ORIWMP-v12-Final.docxthe most feasible and effective nonpoint source control measure as described in the proposed Draft Nitrogen
Control Plan (Section 5 of this Report). This Plan will need to be refined and finalized with additional stakeholder
input and based on results of water quality data currently being collected. This balanced approach would be
designed to meet the pending permit requirements of both the wastewater discharge permit and the MS4
Stormwater Permits in the future. As described in this Report, Durham and UNH have funded several studies to
generate the technical basis in support of an Integrated Permit Approach.
The primary principles of Durham’s/UNH’s proposed Integrated Planning and Permit Approach include:
Collaboration: Build on current research and monitoring efforts being done in the Great Bay region to make
the most efficient use of available resources and technical expertise and achieve nitrogen
reductions in a more holistic and watershed-based approach.
Cost-Effectiveness: Identify best combination of cost-effective solutions aimed at stormwater management and
nonpoint source control.
Sustainability: Achieve water quality objectives with the least amount of structural modifications,
maintenance and additional operational costs using innovative green technology.
The study results described herein will need to be discussed further with regulatory agency personnel in order to
define future permit conditions as part of an Integrated Permit approach and reach consensus on the various
nitrogen removal credits for the NPS control measures included in the Draft Nitrogen Control Plan. In is anticipated
these agency discussions would occur prior to the final MS4 Stormwater Permit being released (tentatively
scheduled for fall 2014) and prior to the pending renewal of the WWTF Permit. Since Durham is already achieving
an annual average effluent limit of 8 mg/L or better (in summer months) for total nitrogen, the renewal Durham’s
WWTF permit is not likely imminent but could occur in the next year or two.
Identifying funding sources to assist in the future implementation NPS control measures is also a priority of the
Project Partners. Potential state and federal funding assistance programs are described herein.
1.4 Examples of NPS Controls Used to Offset Wastewater Treatment
EPA has supported for over a decade the concept of using nonpoint source controls as means to restore impaired
waters and attainment of water quality standards as part of its Water Quality Trading (WQT) Policy2. EPA believes a
trading program can be a cost-effective strategy to achieve pollutant load reductions on a watershed-scale and/or
between different sources and to meet a specified load limit that was established as part of Total Maximum Daily
Load (TMDL) study. A primary benefit of a WQT Program is that it promotes innovation and can expand the
assessment of potential management measures to involve pollutant sources that would typically be evaluated
because they are not regulated. Most notably, this includes agriculture uses, which can contribute to water quality
impairments in many watersheds. A WQT program can provide a framework where farmers or other stakeholders
can monetarily benefit by using specific treatment measures and/or enhance operations to achieve pollutant
reduction credits.
EPA’s guidance document states that, “Allowing a facility to meet an established Water Quality Based Effluent Limit
(WQBEL) through trading does not necessarily constitute a less stringent effluent limitation if the facility is still
2
EPA Water Quality Trading Toolkit for Permit Writers, updated in 2009, EPA-833-R-07-004.
\\nhbedata\projects\52226.00\reports\Overall IPP Watershed
1-3 Introduction
Report\2014-07-10-ORIWMP-v12-Final.docxresponsible for the same level of pollutant reduction. In that case, trading merely offers the discharger an additional
means of achieving that limitation and must not result in a net increase in the pollutant discharged to the water
body or in a localized impairment. Similarly, allowing a facility to meet a WQBEL through trading does not
necessarily constitute a revised effluent limit under section 303(d) (4) (A) if a facility is still responsible for the same
level of pollution reduction.” A pre-TMDL trade must not cause or contribute to further impairments of the water
body according to the 301(b)(1)(C) of the Clean Water Act.
Across the country, there are a number of case study examples where nonpoint source control measures are used
in lieu of more advanced and costly wastewater treatment requirements as part of a nutrient trading and
permitting framework. One relevant example involves the phosphorus loading trading plan implemented by Alpine
Cheese Company (ACC) in Ohio for the Sugar Creek Watershed. Following the development of a phosphorus TMDL,
the state environmental protection agency (Ohio EPA) imposed more stringent phosphorus effluent limitations for
the ACC wastewater treatment facility. Recognizing the much greater costs and challenges to meet this new effluent
limit, the ACC proposed a watershed-wide nutrient trading plan that involved working with local farmers and other
nonpoint source landowners to implement Best Management Practices to reduce existing phosphorus loads. The
nutrient trading plan became integral component of the new NPDES wastewater permit. Varying nutrient reduction
credit ratios were included to account for differing effects of BMP types and source locations on load reductions
within the watershed and the plan included various contingencies for additional BMP measures if initial targeted
measures were not fully adopted. A comprehensive water quality monitoring program was also included. The
entire watershed trading program was developed in cooperation with the Ohio State University and was managed
by the local soil and water conservation district.
A similar watershed based approach was also adopted in Minnesota as a result of the Southern Minnesota Beet
Sugar Cooperative (SMBSC) wanting to build its own wastewater treatment plant, but due to an existing waste load
allocation (WLA), additional phosphorus loads could not be increased on the Lower Minnesota River. As a result,
the SMBSC had to completely offset its proposed phosphorus discharge through negotiated contracts with over two
hundred member farmers to install BMPs (e.g., cover crops, conservation tillage, etc.) to reduce their existing
phosphorus loads.
In Oregon, Clean Water Services (CWS), a utility that operates four (4) wastewater treatment facilities on the
Tualatin River, developed a Temperature Management Plan to alleviate elevated temperature effects from their
wastewater discharges. Rather than installing expensive chillers or refrigeration units for each outfall, CWS
developed a watershed based plan to reduce thermal impacts from solar radiation through riparian shading and
stream corridor plantings. The plan established a long term strategy to offset the entire wastewater thermal load
over a twenty year period. Through this planning effort, the Oregon Dept. of Environmental Quality was able to
integrate the NPDES Permits covering all four facilities and MS4 stormwater requirements into one watershed
based Integrated Permit (See Fact Sheets in Appendix A).
\\nhbedata\projects\52226.00\reports\Overall IPP Watershed
1-4 Introduction
Report\2014-07-10-ORIWMP-v12-Final.docxExisting Wastewater Treatment Facility
2.1 Existing Treatment Operations
The Durham Wastewater Treatment Facility (WWTF) serves both the Town and the University of New Hampshire.
Durham’s total population is estimated to be 14,638 according to the 2010 Census, which includes the Town's
permanent residential population and the on-campus and in-town students attending University of New Hampshire
(UNH). Approximately 80 percent of this population is currently served by the wastewater collection and treatment
system. The Town of Durham operates and maintains the wastewater treatment facility (WWTF), three pumping
stations and over 17 miles of sanitary sewers. There is approximately another 9 miles of sanitary sewer associated
with the UNH campus area that leads to the WWTF. The WWTF is located off of Route 4 and discharges to the
estuary portion of the Oyster River below the head of tide dam. A more complete description of the WWTF
infrastructure and treatment works are contained in the 2012 Draft Facilities Plan prepared by Wright-Pierce.
The WWTF’s current average daily discharge rate is approximately 1.0 million gallons per day (MGD) but is
considerably lower during the summer months when UNH is not in session. During summer months, the average
daily discharge rate is closer to 0.5 MGD or nearly half the average annual daily discharge rate (Wright-Pierce 2012).
The National Pollutant Discharge Elimination System (NPDES) Permit issued by EPA for the facility, which expired in
2004, allows for average daily discharge rate of up to 2.5 MGD. Since 2004, the facility has been operating under an
administratively continued permit and EPA is likely to renew the permit in the next year or two. EPA has indicated
that the next permit is likely to contain a stringent effluent limit of 3 mg/l for nitrogen that would be based on a 7-
month rolling average discharge concentration from April to October. An effluent limit of 3 mg/L is essentially
considered the “Limit of Technology” or the lowest level that can be reasonably expected given current technology.
This effluent limit has been included in the recent NPDES Permits issued to the Towns of Exeter and Newmarket.
As part of the Draft Facilities Plan, an evaluation was conducted to identify the treatment configurations and
upgrades that would needed to meet potential future effluent limits (Wright-Pierce, 2012). Due to facility upgrades
completed in 2005, the WWTF currently maintains a 7-month seasonal rolling average nitrogen effluent limit that is
below 8 mg/L, which is much lower than most, if not all, other facilities in the Seacoast Region. To achieve a total
nitrogen limit of either 3 or 5 mg/L, at the current and/or design flows and loads, the installation of a 4-Stage
Bardenpho nutrient removal system was recommended. The Draft Facilities Plan suggests that with reasonably
certainty an effluent limit of 5 mg/L could be met using this process, however, it was unclear whether an effluent
limit of 3 mg/L could be achieved without requiring the use of a carbon supplement such as methanol to stimulate
biological activity, especially during the cooler months. The report states that a “Biological Aeration Filter” (BAF)
may be needed to meet the lower 3 mg/l effluent limit. To gain a better understanding of the potential treatment
needs beyond the 4-stage Bardenpho process, Wright-Pierce recommended that a two-year, pilot study being
conducted to optimize the treatment process without the use of supplemental chemicals or the aeration filter.
2.2 Pilot ‘‘Optimization’’ Study
Consistent with the Draft Facilities Plan recommendations, Durham and UNH have initiated a small scale pilot study
using the proposed 4-stage Bardenpho treatment process to gain a better sense of the operational aspects and
potential effectiveness of the proposed treatment upgrade to enhance nitrogen removal. This study will start in the
summer of 2014 and extend through the summer of 2016. To complete the study, the existing four aeration tanks
at the treatment plant will be reconfigured into a two-train 4-stage Bardenpho configuration. The study results will
help to determine whether a seasonal nitrogen effluent limit of less than 5 mg/L can be feasibly achieved without
\\nhbedata\projects\52226.00\reports\Overall IPP Watershed
2-1 Existing Wastewater Treatment Facility
Report\2014-07-10-ORIWMP-v12-Final.docxthe use of supplemental carbon, and to further assess how increased flow in the future might affect nitrogen loads.
Plant operators will also gain operational experience and operational data that will be used to confirm the future
process/technology selection and final design criteria for a full-scale treatment process.
2.3 Preliminary Cost Estimates and Estimated Nitrogen Load Reductions for Possible WWTF Upgrades
to Meet and Effluent Limit of 5 or 3 mg/L
Table 2-1 presents preliminary cost estimates included in the Draft Facilities Plan that show the relative difference
in the potential construction and maintenance costs involved with upgrading the WWTF to meet a 5 mg/L effluent
limit instead of a 3 mg/L effluent limit. These cost estimates only pertain to the infrastructure needs for nitrogen
control and do not include other facility upgrades that may be needed to address flow capacity and other physical
improvements. The treatment needs and related costs are subject to change depending on the results of the pilot
study. These cost estimates are based on 2012 dollars and do not reflect any future escalation due to inflation.
Based on this preliminary cost analysis, the added costs to meet an effluent limit of 3 mg/L instead of 5 mg/L is
estimated to be approximately $650,000 per year. This includes approximately $325,000 in annual O&M costs and
approximately $330,000 in added debt service for capital costs amortized over a 20 year period. Based on a present
value comparison of Life Cycle costs over 20-year period, the difference in the two treatment levels could result in
$9.4 million in added costs (Wright-Pierce 2012).
Table 2.1: Estimated Costs for WWTF Upgrades to Achieve an Effluent Limit of 5 and 3 mg/L
Annual Total Life Cycle
(O&M) Capital Annualized Annual Cost
Process Configuration Cost1 Cost1 Capital Cost Cost Estimate2
4-stage Bardenpho (6 Aeration Tanks: 5 mg/L $ 362,000 $ 8.7 M $ 612,140 $ 971,140 $13.8 M
Same as above plus Biological Filter: 3 mg/L $ 688,000 $ 13.4 M $ 942,840 $1,680,340 $23.2 M
Difference $ 326,000 $ 4.7 M $ 330,700 $656,700 $9.4 M
Notes: 1Facility upgrade cost estimates as presented by Wright-Pierce in the July 2012 Draft Wastewater Facilities Plan (Table 6-8 on page 6-34).
The capital and annual O&M costs are presented in 2012 dollars. 2Life Cycle costs are based on 20 yr. life cycle with an interest rate of
3.5 percent.
Table 2-2 presents the relative difference in the estimated nitrogen load reductions that would occur if the WWTF
was upgraded to meet a 7-month seasonal average effluent limit of 5 or 3 mg/l as compared to the existing average
seasonal discharge concentration of 8 mg/L at the current average daily discharge rate of 1.0 MGD.
Table 2.2: Estimated Difference in Annual Nitrogen Loads with Effluent Limits of 5 and 3 mg/L
Average Seasonal Conc. Difference Conversion Daily Nitrogen Total N Load
Effluent Limit (mg/L) Factor Load (lbs/day) (7 month period)
5 mg/L 3 mg/L 8.34 25.0 5,254 lbs
3 mg/L 5 mg/L 8.34 41.7 8,757 lbs
Difference 2 mg/L -- 16.7 3,503 lbs
Notes: Load reductions are based on an equation, lbs/day = flow (mgd) x conc. (mg/L) x conv. Factor provided by Wright-Pierce 2012. Since the
effluent limits are anticipated to be on 7-month rolling average the load reductions were only calculated for 7 month period, however, additional
nitrogen reductions may occur for the rest of the year to a lesser extent. This analysis intended to provide a relative difference.
Based on this comparison of the expected load reductions for different WWTF upgrades, an additional 3,500 lbs/yr
or 1.8 tons of nitrogen can be expected to be removed if the WWTF was upgraded to meet an effluent limit of 3
mg/L instead of 5 mg/L. As discussed in Section 5.0, it is anticipated that 3,500 lbs of nitrogen per year could be
reduced more cost effectively using nonpoint source control measures within the watershed.
\\nhbedata\projects\52226.00\reports\Overall IPP Watershed
2-2 Existing Wastewater Treatment Facility
Report\2014-07-10-ORIWMP-v12-Final.docxReview of Existing Water Quality Data
This section summarizes existing water quality data previously collected in the Oyster River watershed. Nearly all of
the existing water quality data was generated from discrete grab samples collected at various locations by multiple
organizations. Although grab sampling data can be highly valuable in assessing historical trends, it does not provide
a complete assessment on how precipitation events might affect nitrogen concentrations and related loads in local
streams. As part of the proposed Integrated Planning effort, the Town and UNH funded the Water Systems Analysis
Group (WSAG) of the Natural Resources Department to conduct additional sampling using continuously recording
nitrate sensors and data soundes to help provide a better understanding of how nitrogen concentrations and loads
change spatially and over time as a result of precipitation events and seasonal influences. This data was also
intended to help support the watershed modeling effort. In 2013, nitrate sensor data was collected was from late
April to early December at several locations, however, estimates of nitrogen flux could not be fully established due
to incomplete stage-discharge curve data at select locations. In 2014, an additional data is being collected to fill the
flow data gaps and collect additional nitrogen concentration data. The results of this effort are anticipated to be
available at the end of 2014.
3.1 Status of Great Bay & Local Water Resources in Oyster River Watershed
In 2009, NHDES established a draft water quality criterion 0.3 mg/L for nitrogen in tidal waters in order to fully
support the designated uses of the Great Bay. NHDES had concluded that observations of increased algae growth,
lower dissolved oxygen levels, reduced water clarity and light transparency, and greater macro-algae abundance
were due to excessive nitrogen loading from point and nonpoint sources as these declining water quality conditions
are often symptoms of nutrient enrichment. Shortly thereafter, NHDES listed the Great Bay Estuary and many of its
sub-estuaries including the Oyster River estuary as impaired. More recently, in response to a legal challenge, a
panel of national experts conducted a peer review of the data used to support this criteria and concluded that the
available scientific data was not sufficient to clearly link nitrogen as the principal cause for the declining water
conditions in the Great Bay. It is unclear at this time, how and whether the peer review results will affect EPA’s
requirements in future permit renewals and whether NHDES will develop new criteria for nitrogen or other
pollutants that may be contributing to declining water quality.
3.2 Existing Water Quality Data in the Watershed
Existing water quality data has been collected by several volunteer and academic research groups at various
locations, frequency and time periods. The primary groups collecting water quality data include the Water Quality
Testing Committee of the Oyster River Watershed Association (ORWA), UNH’s Water Systems Analysis Group,
UNH’s Water Resource Research Center (WRRC) and the Piscataqua Region Estuaries Partnership (PREP).
NHDES (PREP) Monthly Sampling Data in the Oyster River Collected at the Head of Tide.
The Piscataqua Region Estuary Partnership (PREP) collected monthly samples in the Oyster River main stem just
upstream of the Mill Pond Dam (head-of-tide dam) along Route 108 between the years 2009 and 2011(DES
Environmental Management System). Over this time period, over forty-three (43) samples were collected and
analyzed for total dissolved nitrogen (TDN).
\\nhbedata\projects\52226.00\reports\Overall IPP Watershed
3-1 Review of Existing Water Quality Data
Report\2014-07-10-ORIWMP-v12-Final.docxTable 3.1: Estimated Nitrogen Loads Based on NH PREP Monthly Data from 2008 to 2011
Median Mean Total Estimated Total Estimated
Estimated Annual Dissolved Dissolved Total Percent
Drainage Flow N Conc. Nitrogen Nitrogen of Total
Watershed Location Area (ac) (cfs)1 (mg/L) tons/yr tons/yr N Load
Oyster River at Mill Pond
12,830 32.1 0.39 17.3 20.88 56%
Dam
Tidal Estuary Downstream
6,830 17.2 0.43 13.5 16.31 44%
of Dam
Total Watershed 19,860 49.3 -- 20.8 37.19
Notes: 1Median annual flow is based on the recorded annual flow during the 2008 to 2011 sampling period at the USGS Oyster River gauging
station and not the entire historical record. The flow during this period was generally higher than the historical average flow over the
long term records.
Oyster River Watershed Association Volunteer River Assessment (VRAP) Data
The Oyster River Watershed Association (ORWA) has been collecting water quality data since 2001 as part of the
NHDES Volunteer River Assessment Program (VRAP). The group has collected data from over twenty different sites
along the main stem and tributaries mostly within the freshwater portion but several sites are on tributaries that
drain to the tidal portion namely Reservoir Brook, Beards Creek and Johnson Creek. The data is collected on a
monthly basis during the growing season months, mainly April through October. The primary data routinely
collected consists of field measurements of physical parameters including pH, temperature, dissolved oxygen,
turbidity and specific conductance. During specific years, specifically 2001, 2002 and 2005 to 2010 that vary
somewhat by location, water quality samples were collected for laboratory analysis of specific ions including
chloride, sodium, phosphorus in phosphate, nitrogen in nitrate, ammonium, and dissolved organic nitrogen (DON),
and total dissolved nitrogen (TDN). The chemical analyses were done by the New Hampshire Water Resources
Research Center (NH WRRC) laboratory at the University of New Hampshire.
The ORWA Water Quality Committee recently completed a report summarizing all of their data collected between
years 2001 through 2011 (Colbert, et. al, 2014). The following provides a brief summary of the data focusing on the
various forms of nitrogen that analyzed at each of the stations. The graphs below were excerpted from the ORWA
report using bar graphs which show the historical average concentration for each parameter at each sampling
station as represented by the top of the bar the with on standard deviation shown by the added “whisker” above
the bar. Refer to the full report for a more detailed discussion of the data analysis and sample location maps.
Nitrate- N
Figures 3.2a and 3.2b compare the historical mean nitrate concentrations for the Oyster River main stem stations
and tributary stations, respectively. The concentrations in the main stem, in general, are considerably lower than
those measured in the tributary stations. Most of the main stations had historical means below < 0.1 mg/L except
for somewhat higher levels at the Mast Road (Route 155A) and the Footbridge Station below the UNH drinking
water reservoir. Nitrate-N levels measured at three tributary sites including Wendy’s, College, and Chesley Brooks
had historical mean values generally above 0.4 mg/L and peak concentrations above 1.0 mg/L. Chesley Brook had
the highest mean value and College Brook had standard deviation. The higher levels would appear to be indicative
of nearby nitrogen source contributions. For Chesley Brook, the likely sources would be related to either agricultural
sources or septic systems or both.
\\nhbedata\projects\52226.00\reports\Overall IPP Watershed
3-2 Review of Existing Water Quality Data
Report\2014-07-10-ORIWMP-v12-Final.docxYou can also read