Evaluating the Health of Wetlands - (Wetland Management Routine Effectiveness Evaluation) - Government ...
←
→
Page content transcription
If your browser does not render page correctly, please read the page content below
FOREST AND RANGE EVALUATION PROGRAM

Protocol for
   Evaluating the Health of Wetlands
   (Wetland Management Routine Effectiveness Evaluation)

   Version 2.1
   January 2021
Wetland Management Routine Effectiveness Evaluation – January 2021

Citation:

Fletcher, N.F., Tripp, D.B., Hansen, P.L., Nordin, L.J., Porter, M., and Morgan, D. 2021. Protocol for the Wetland Health Management Routine
Effectiveness Evaluation. Forest and Range Evaluation Program, B.C. Ministry of Forests, Lands, Natural Resources Operations and Rural
Development, Victoria, B.C.

Prepared by:
Neil Fletcher, BC Wildlife Federation
Derek Tripp, Tripp & Associates Consulting Ltd.
Paul Hansen, Ecological Solutions Group LLC
Lisa Nordin, B.C. Ministry of Forests, Lands, Natural Resources Operations and Rural Development
Marc Porter, ESSA Technologies
Don Morgan, B.C. Ministry of Environment & Climate Change Strategy
Maureen Nadeau, BC Wildlife Federation
Jason Jobin, BC Wildlife Federation
Tobias Roehr, BC Wildlife Federation

Additional Input Provided by:
Suzanne Bailey, University of Alberta
Nora Billy, St’at’imc Government Services
Wade Brunham, ERM
Darwyn John, St’at’imc Government Services
Alicia Krupek, Splitrock Environmental
Karen Kubiski, Carrier Chilcotin Tribal Council
Natasha Lukey, Okanagan Nation Alliance
Kim North, Splitrock Environmental
Daryn Scotchman, Splitrock Environmental
Crystal Wallace, Lower Nicola Indian Band

Special thanks to members of the Steering Technical Committee of the Skeena Environmental Sustainability Initiative for offering additional input
into an earlier version of this protocol.

For more information on BC Forest and Range Evaluation Program (FREP) publications, visit our web site
at:http://www2.gov.bc.ca/gov/content/industry/forestry/managing-ourforest-resources/integrated-resource-monitoring/forest-range-
evaluation-program/frepreports-extension-notes.

© 2021 Province of British Columbia
When using information from this or any other FREP publication, please cite fully and correctly.

                                                                                                                                               2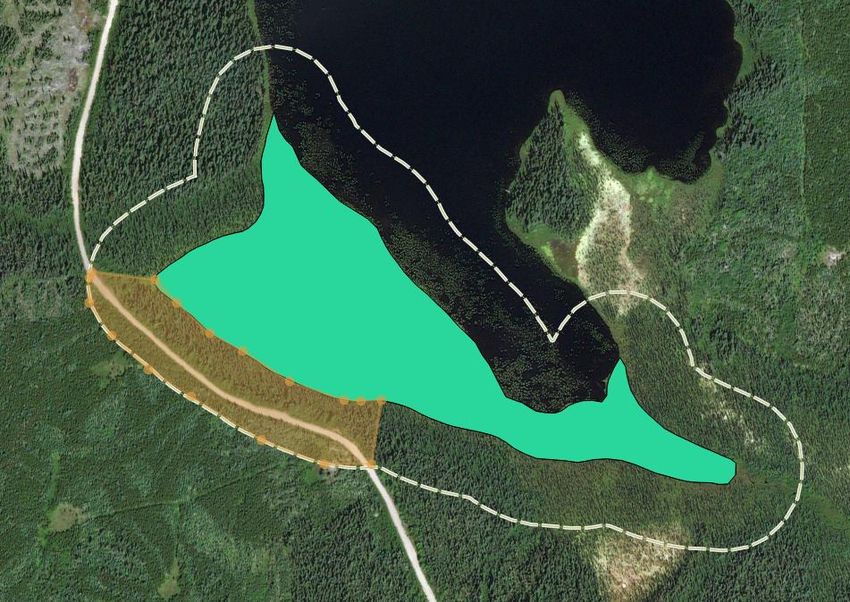
Wetland Management Routine Effectiveness Evaluation – January 2021

Table of Contents

Introduction .................................................................................................................................................. 6
   Recommended Steps for a Wetland Health Evaluation ......................................................................... 11
   Recording Data........................................................................................................................................ 22
   Health Scoring Questions ........................................................................................................................ 23
       Vegetation........................................................................................................................................... 23
           1.Vegetative cover .......................................................................................................................... 23
           2. Invasive and/or noxious spp ....................................................................................................... 23
             2.a) Invasive and/or Noxious Plant Canopy Cover ........................................................................ 23
             2.b) Invasive and/or Noxious Plants distribution .......................................................................... 24
           3. Coverage of disturbance-caused undesirable species ................................................................ 24
           4. Vegetation compared to a healthy unmanaged wetland and riparian plant communities ....... 25
             4.a) Wetland plant community structure ..................................................................................... 25
             4.b) Wetland plant recruitment, form and vigor in the wetland .................................................. 26
             4.c) Upland plant community structure ........................................................................................ 27
             4.d) Uplands plant recruitment, form and vigor ........................................................................... 27
             4.e) Long-term trajectory of the vegetation community .............................................................. 28
           5. Sufficient vegetation to minimize windthrow, maintain adequate screening, visual cover and
           LWD supply ..................................................................................................................................... 29
            5.a) Retention of non-merchantable conifer, understory deciduous trees, shrubs and herbaceous
           vegetation within 20m of the wetland edge................................................................................... 27
             5.b) Retention in the CDF, PP, BG, CWHxm, dm, ds and IDFxh, xw, and xm BEC units ................ 29
             5.c) Retention in the ESSF, MS, ICH, MH, CWHvm, mm, ms, ws and IDFdm, dk1, and dk2 units 30
             5.d) Retention in the SWB, SBS, SBPS, BWBS, CWHvh and IDFww, mw, dk3, and dk4 units ....... 30
             5.e) Percent live woody vegetation removed from wetland, other than browsing. .................... 29
           6. Heavy browsing and grazing ....................................................................................................... 28
             6.a) Heavy browsing ...................................................................................................................... 28
             6.b) Heavy grazing ......................................................................................................................... 29
             6.c) Seedlings or saplings of palatable tree and shrub species ..................................................... 29
       Soils ..................................................................................................................................................... 32
           7. Bare and compacted ground ....................................................................................................... 32
             7.a) Bare and compacted ground .................................................................................................. 33

                                                                                                                                                                        3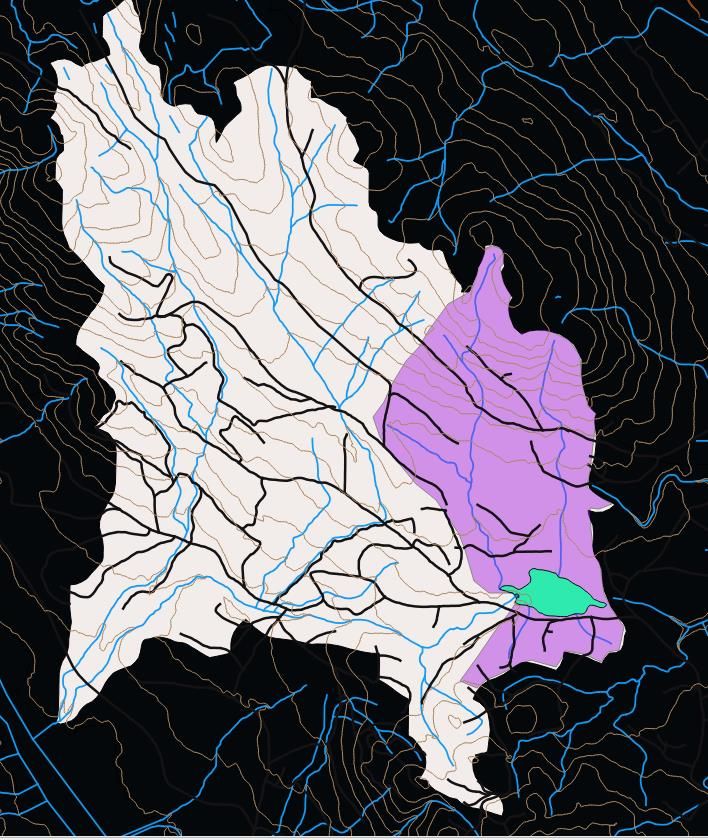
Wetland Management Routine Effectiveness Evaluation – January 2021

          7 b)Bare soil within and/or hydrologically connected ................................................................. 33
     Morphology......................................................................................................................................... 34
        8. Physically altered site .................................................................................................................. 34
          8.a) Proportion of altered topography .......................................................................................... 34
          8.b) Severity of the physical alteration ......................................................................................... 35
        9.Intact wetland woody debris processes ...................................................................................... 35
          9.a) Standing dead trees (snags) and decadent trees (dying trees) density ................................. 36
          9.b) Standing dead tree diversity .................................................................................................. 37
          9.c) Stable coarse woody debris.................................................................................................... 38
          9.d) Diversity of coarse woody debris ........................................................................................... 38
        10. Windfirm buffer ........................................................................................................................ 39
          10.a) Riparian windthrow in RMA without an RRZ or designated WTP ...................................... 37
          10.b) Riparian windthrow in RRZ or WTP...................................................................................... 40
          10.c) Wildlife Trees........................................................................................................................ 38
     Hydrology ............................................................................................................................................ 38
        11. Changes in the hydrologic regime............................................................................................. 38
          11.a) Severity of hydrologic changes ............................................................................................ 38
          11.b) Dead trees or shrubs at the wetland edge?......................................................................... 39
          11.c) Younger age class plants or trees encroachment ................................................................ 39
          11.d) Stream channel incisement.................................................................................................. 39
          11.e) Natural surface or subsurface wetted areas. ....................................................................... 43
        12. Threats to water levels in the wetland ..................................................................................... 43
          12.a) Outlet structure . .................................................................................................................. 43
          12.b) Active headcuts below or within the wetland ..................................................................... 43
          12.c) Disturbed shoreline of the wetland ..................................................................................... 43
          12.d) Deep binding rootmass ........................................................................................................ 44
     Water Quality ...................................................................................................................................... 44
        13. Water quality of the wetland ................................................................................................... 45
          13.a) Excessive nutrient loading.................................................................................................... 45
          13.b) Basic water quality parameters ........................................................................................... 45
     Landscape ........................................................................................................................................... 46
        14. Surrounding habitat .................................................................................................................. 46
          14.a) Total riparian area disturbance ............................................................................................ 46

                                                                                                                                                                 4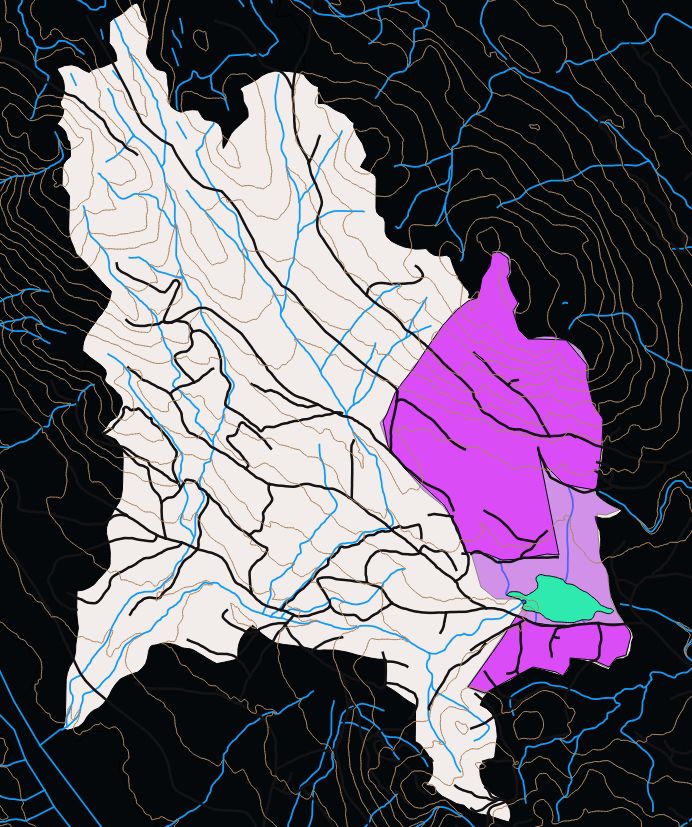
Wetland Management Routine Effectiveness Evaluation – January 2021

           14.b) Visible shoreline ................................................................................................................... 47
           14.c) Right-of-ways within 100 m ................................................................................................. 47
           14.d) Percent mature and old forest within two kilometers …………………………….…….………………..45

          15. Surface and subsurface flows to the wetland intact................................................................. 49
           15.a) Mapped and unmapped streams diversion ......................................................................... 49
           15.b) Contributing basin intercepted by roads or ROWs .............................................................. 47
   Appendix 1 – Recommended Field Sampling Sequence ....................................................................... 51
   Appendix 2 - Common invasive and noxious plants within BC ………………………………………………………….. 53

   Appendix 3 – Select list of Culturally Significant Plants to Indigenous Communities in BC ................... 56
   Appendix 4 – Wetland Indicator Status Categories ................................................................................ 60
   Appendix 5 - Minimal Targets for Mature and Old Forest Coverage...................................................... 61

List of Figures
Figure 1. A key to the different freshwater wetland ecological classes .......................................................9
Figure 2. Wetland boundaries for health assessment ..................................................................................10
Figure 3. Key to wetland riparian classification ............................................................................................13
Figure 4. Placement of transects and plots, and associated calculations.....................................................16
Figure 5. Distribution Codes for invasive species .........................................................................................24
Figure 6. Visual appearance codes for wildlife trees ....................................................................................37
Figure 7. Edatopic grid for abiotic factors and their relationship with different aquatic classes .................46
Figure 8. Map of Right of Ways within 500m buffer to identify potential vantage points...........................47
Figure 9. Example of Road impinging within 100m of wetland area ............................................................48
Figure 10. Example Spatial query within a 2 km buffer of the wetland .......................................................49
Figure 11. Contributing Basin Assessments ..................................................................................................47

List of Tables
Table 1. Riparian management distances .....................................................................................................13
Table 2. Description of Dominant Upland vegetation Strata Around Perimeter of Wetland…………………….16
Table 3. Transect Information………………………………………………………………………………………………………………….19
Table 4. Organic Soils Classification Table based on the Von Post Scale ......................................................22
Table 5. Example of a completed vegetation plot table ...............................................................................23
Table 6. List of Common disturbance-increaser species in BC .....................................................................26
Table 7 Structures and Vegetation Form, Vigor, and Recruitment within wetland ....................................28
Table 8. Structures and Vegetation Form, Vigor, and Recruitment upland .................................................28
Table 9. Snags and Coarse Woody Debris Indicators ....................................................................................37
Table 10. Tree Diameter Classes ...................................................................................................................38
Table 11. Decay Classes for Coarse Woody Debris .......................................................................................39

                                                                                                                                                            5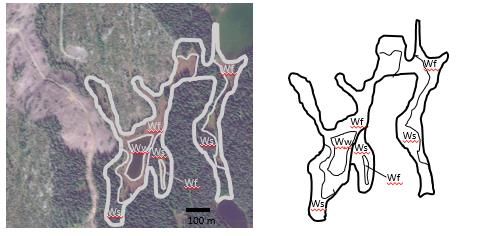
Wetland Management Routine Effectiveness Evaluation – January 2021

Introduction

This guidance document provides supplementary details to the BC Ministry of Forests, Lands, Natural
Resource Operations and Rural Development (FLNRORD) field form for evaluating the health of wetlands.
Field technicians are expected to read this protocol prior to using the wetland health evaluation form in
the field. This document provides information on site selection, sampling protocol, and interpretation of
the questions in the form. Technicians are encouraged to refer to this document when evaluating their
first few wetlands of the year. Reviewing the document on a regular basis will help calibrate
interpretation skills.

The Resource Planning and Assessment Branch within the Ministry of Forests, Lands, Natural Resource
Operations and Rural Development (FLNRORD) and the Ecosystems Branch in the Ministry of
Environment and Climate Change Strategy (ENV) developed this Wetland Health Assessment Form and
Protocol to complement their current suite of monitoring tools within the Forest and Range Evaluation
Program (FREP). One example of a well-established FREP tool is the Riparian Management Routine
Effectiveness Evaluation Field Form with the associated Protocol, which assesses stream/riparian
condition. The objective of this FREP Wetland Health Assessment Form and Protocol is to allow for
persons with basic working knowledge of wetlands to evaluate the health of wetlands within or in
proximity to industrial development activities (e.g., forestry). Field evaluators may be forest and range
practitioners, First Nation’s stewardship members, consultants, land managers, or other land users.

This Wetland Protocol is a coarse-level filter for assessing the health of wetlands. The assessment form is
intended to be completed mainly in the field, promote consistency among users, gather pertinent data to
inform the health of the wetland, and be cost effective as a tier 2 approach for monitoring (i.e., relatively
quick to use in the field (1-4 hours). One of the advantages of the protocol is that it is a relatively low-cost
method to assess wetlands in the field and can enable comparative analysis among numerous sites. A
wetland flagged with poor health may require further inspection, or a more detailed analysis may be
required to investigate a wetland more thoroughly or to meet other objectives of land managers.

A healthy wetland is a measure of its capacity to perform a number of functions in the environment.
Society assigns value to many wetland functions as they can support both healthy landscapes and healthy
communities. Although not all wetlands perform the same functions, some of the functions include:
sediment trapping, shoreline maintenance, wave energy dissipation, water storage, aquifer or stream
recharge, maintenance of biotic diversity, carbon cycling and storage, nutrient cycling and absorption,
and primary productivity. The values we derive from these functions may include: flood control, clean
water, and provision of food and medicinal products. In order for a wetland to perform these functions
effectively, it requires healthy vegetation, intact soils, specific hydrologic regimes, and an appropriate
connectivity to the broader landscape. This protocol helps categorize the health of a wetland as: properly
functioning; functioning, but at risk; functioning, but at high risk; or not properly functioning.

There are many wetland evaluation protocols in North America that quantify a wetland’s functioning
condition or assess its health, but none that have been formally and broadly adopted by the Province of
BC. This protocol represents the first to be developed at a provincial scale for measuring wetland health.
For clarity, the protocol does not quantify specific measurable processes of a wetland (e.g., the amount of

                                                                                                               6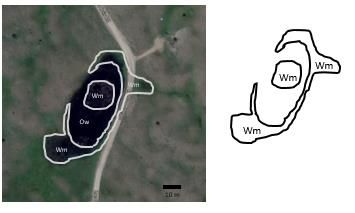
Wetland Management Routine Effectiveness Evaluation – January 2021

flood retention of a particular wetland), which requires a separate inventory framework. Instead, it
focuses on observed or potential impacts that would affect a wetland’s ability to perform functions.
The development of this protocol is adapted from several existing protocols. Contributing or supporting
literature includes:

    •   Riparian Area Management: A User Guide to Assessing Proper Functioning Condition and
        Supporting Science for Lentic Areas. TR 1737-16 1999 Revised 2003. USDA and Bureau of Land
        Management.
            o This guide provides a solid foundation for assessing wetland health and recommends a
                variety of tools and approaches. The lead author, Don Pritchard, helped establish and
                popularize the concept of Proper Functioning Condition. However, the indicators within
                the document rely on a team of experts reaching consensus in order to determine the
                health of the site. Many of the indicators recommended in this document made their way
                into the FREP riparian protocol, but additional thresholds and associated guidance were
                developed to ensure consistency among users.
    •   Riparian Management Effectiveness Evaluation Field Form and Protocol. 2017. B.C. Ministry of
        Forests, Lands, Natural Resource Operations and Rural Development.
            o This protocol, developed by the Forest and Range Evaluation Program (FREP), was closely
                reviewed for elements to transfer. It is expected that field crews completing the riparian
                protocol will also complete the wetlands protocol. The format for the FREP wetlands
                form is similar to the riparian version for ease of use and to promote consistency. Several
                of the indicators that relate to riparian areas are the same or slightly modified for the
                wetlands protocol.
    •   Alberta Lentic Wetland Health Assessment Survey; and Alberta Lotic Wetland Health Assessment
        Survey for Streams and Small Rivers. 2014. Alberta Riparian Habitat Management Society.
            o These two protocols, managed in Alberta by the Alberta Riparian Habitat Management
                Society, were developed by Paul Hansen and other experts working with the Ecological
                Solutions Group LLC. Modified versions of the protocol have been applied in
                Saskatchewan and numerous US states by land managers, as well as by Canadian and US
                federal agencies. The indicators and protocols have been refined over 20 years, where
                thresholds and weighting of indicators were developed by a group of experts using the
                Delphi method. In lieu of a BC wetland health assessment standard, these protocols have
                been used ad-hoc at a regional scale in BC by FLNRORD, BC Parks, the Nature
                Conservancy of Canada, and several consultants. Most of the applications have been on
                range land in the interior; however, according to the lead author, Paul Hansen, the forms
                were designed to be used for broad application and have been tested on the BC coast
                with satisfactory transferability. In several cases, where the thresholds for indicators in
                the FREP form did not exist, a threshold for a Yes or No was derived from the Alberta
                protocols. At the time of the development of this current FREP protocol, three separate
                initiatives in BC were attempting to integrate the Alberta Lentic and Lotic protocols into a
                BC framework. A key difference is that questions in the FREP version also consider natural
                disturbances, as opposed to only human-caused impacts, so data on the natural
                variability of wetland health may be determined. With permission from Paul Hansen,
                several of the guidance question indicators were replicated, and modified as needed,
                from these two Alberta protocols.

                                                                                                          7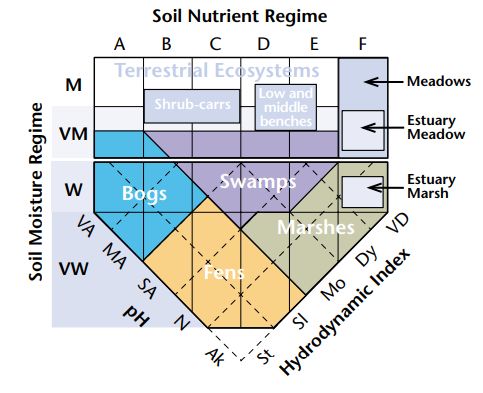
Wetland Management Routine Effectiveness Evaluation – January 2021

Wetland Delineation

The delineation of the wetland polygon is a critical step in the FREP Wetland Health Assessment as many
of the indicator questions are heavily influenced by the defined polygon unit. For example, the percent
cover of invasive species will change dramatically with substantial changes in the assessment area. The
boundaries can be determined pre-field and adjusted in the field. A copy of recent high-resolution aerial
imagery with an overlay of the boundary will improve the assessment in the field. The evaluator may
choose the measuring tool on Google Earth imagery, ArcMap, FREPmap (for government staff) or QGIS to
draw a polygon boundary and calculate the area. To get started, provincial wetland layers are available
from the BC Data Catalogue, such as wetlands in the Freshwater Atlas and in the Vegetation Resource
Inventory. As a word of caution, these wetland boundaries may poorly resemble what is found on the
ground, as they are generally created from remote imagery. If available, wetlands may be better
delineated on imagery or the forest site plan for a cutblock, and the boundaries refined after field
verification. FLNRORD stewardship officers may also be able to calculate wetland areas using the online
FREPmap tool that includes recent SPOT imagery. On-the-fly calculations are possible with mobile map
apps, such as Avenza. In the near future, drones may serve as a very helpful tool to gather real time data
(i.e., both wetland delineation and determining values for some of the indicators). Ensure to save
screenshots of any variances in wetland boundaries, that you can then include in your data submission.

In some cases, the evaluator may find that the boundaries need to shift once they get out to the field. The
natural boundaries between an upland area and a wetland can generally be determined by a distinct
change in vegetation of water-dependent (obligate) or water-tolerant (facultative) species to more
terrestrial plant species. The presence of hydric soils (i.e., gleying or mottling of mineral soils within the
first 30 cm, the presence of poorly decomposed organic soils (e.g., peat), or a near surface water table
can also help delineate the terrestrial/wetland boundary. At the interface of the wetland and deeper
water, such as a lake, the wetland is delineated as the vegetated zone with greater than 10% rooted
vegetation and less than 2m depth in mid-summer. Any modifications of the boundaries in the field
should be included with the assessment.

In some cases, where heavy disturbance has occurred, the boundaries of the wetland may not match the
natural observable boundaries. The evaluation relies on understanding the potential area of wetland prior
to any disturbances. If there has been soil deposited into the wetland or a decline in water level (and thus
a retraction of the wetland area), the evaluator will need to consider the historical context of where the
wetland would have been prior to the disturbance to evaluate the impacts. This is one of the more
challenging parts of the protocol to consider, especially in heavily modified areas. Old aerial imagery,
traditional or community knowledge, or onsite evidence of disturbance may help to determine the
historic extent of the wetland. The evaluator will need to take detailed notes and provide a rationale for
any changes in the boundary of the assessment area.

The evaluator may choose to only complete an assessment of a portion of a wetland. One reason to do so
may be to subsample a wetland that is too large to feasibly assess. Again, the evaluator will need to
provide details and document their rationale for modifying the boundary.

The interpretation of the various ecological classes and plant associations within the wetland will help the
evaluator answer some of the questions (e.g., Question 4. “Is the vegetation of the entire polygon
generally characteristic of what the healthy unmanaged wetland and riparian plant communities are

                                                                                                            8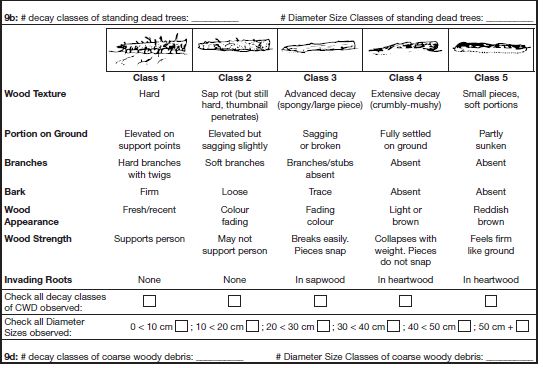
Wetland Management Routine Effectiveness Evaluation – January 2021

normally?”). Field crews should become familiar with using the book, Wetlands of British Columbia: a
guide to identification (2004), which provides substantial detail of many of BC’s most common wetland
plant associations and often indicates typical progressions between plant associations of wetter and drier
sites. However, the book does not contain all wetlands and the assessor will encounter sites that do not
conform to the descriptions. Some wetlands may be in transition between two plant associations, while
others are not documented. More recent field guides to ecosystem classification may provide additional
detail to plant associations in specific regions.

At a minimum, the field evaluator should become familiar with the various freshwater ecosystem classes:
bogs, fens, marshes, swamps, and shallow water. Figure 1 provides a key to the different wetland
ecological classes. Patterns of vegetation can often be observed from remote imagery, and differences in
patterns often indicate a change between plant associations or wetland ecological classes. For the
purposes of this assessment, the evaluator may not need to break the wetland into the various classes,
but knowledge of the various types within it can aid in interpretation. See Figure 2 for examples of
established wetland boundaries.

Figure 1. A key to the different freshwater wetland ecological classes (Source: Mackenzie 2012.
Biogeoclimatic ecosystem classification of non-forested ecosystems in British Columbia. B.C. Min. For.,
Res. Br., Victoria, B.C. Tech. Rep. 068.). The “surface tier” mentioned in the chart is 40 cm thick excluding
any loose litter, crowns of sedges and reeds, or living mosses. Shallow organic soils over mineral soil or

                                                                                                                9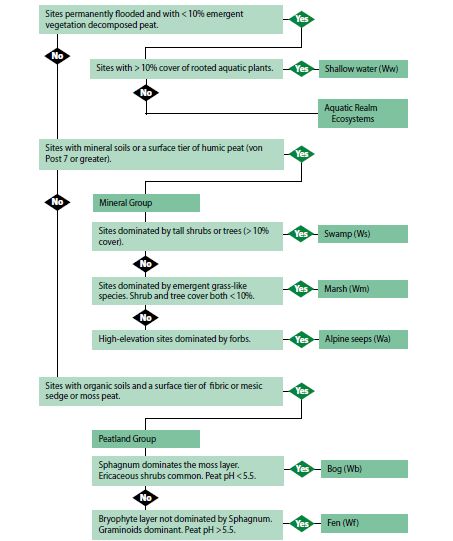
Wetland Management Routine Effectiveness Evaluation – January 2021
bedrock may have only a surface tier. Of note: in rare cases, some swamps may also contain mesic soils
(e.g., Ws05).
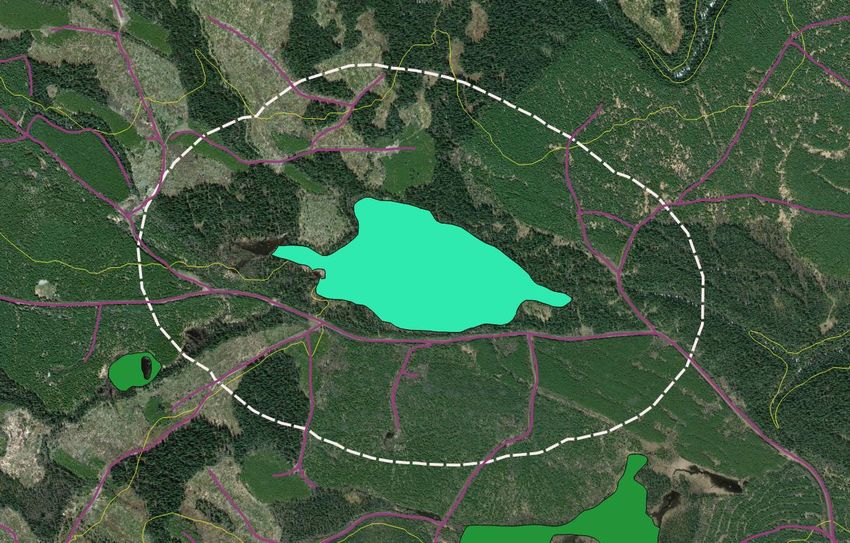
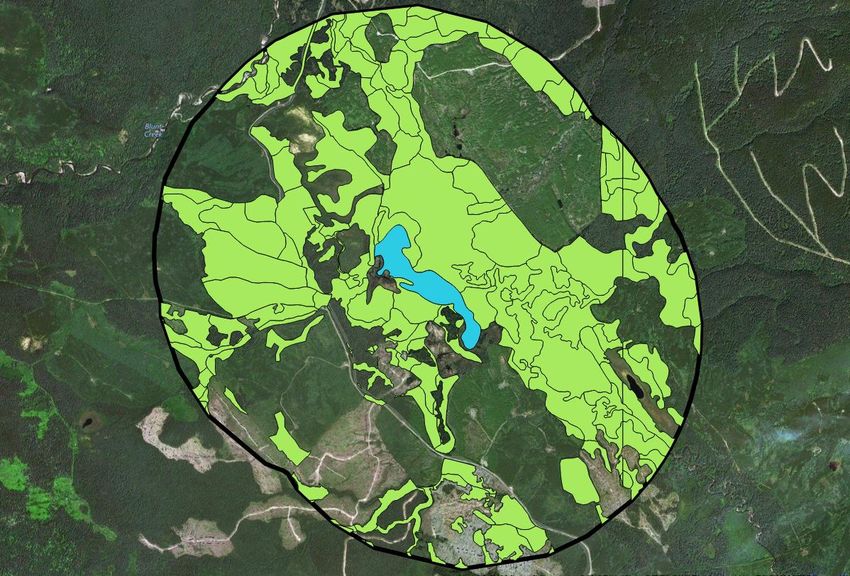
Figure 2. Examples of Wetland boundaries established for the health assessment with wetland ecological
classes identified. For the purposes of this assessment, in most cases, the boundaries should be
established to the extent they would be pre-disturbance. In the example shown at the top of this figure, a
road was constructed over a portion of the wetland, and the original extent of the wetland was estimated
on the northeast section of the wetland.
10Wetland Management Routine Effectiveness Evaluation – January 2021
Recommended Steps for a Wetland Health Evaluation
The following guidance is provided to help complete the first few sections of the field form. Review the
recommended field sampling sequence in Appendix 1 for an efficient order of progressing through tables
and checklists once in the field.
STEP 1 – OFFICE REVIEW AND PREPARATION:
Conduct an office review of the wetland polygon area before going out into the field. Complete the
information in Tables 1 to 3 (T.1-T.3) of the field form to the best of your ability. Many of the questions in
this section can be completed in the office but may need to be revised once you arrive in the field.
Useful GIS layers include topographic information (to delineate the contributing basin of the wetland),
stream layers, tenure boundaries (range, aggregate, recreation, utilities, etc.), biogeoclimatic information,
forest age classes (i.e., from the Vegetation Resource Inventory), cutblocks, and right-of-ways (e.g., roads,
pipelines, etc.). Good quality remote imagery will also be useful to complete some sections, such as
identifying any mass wasting that may have occurred.
Contact the licensee of the cutblock associated with the wetland to inform them of the intention of
entering their operating area, invite them to attend, and request their site plan and any other related
information to help with the assessment. The licensee may be able to also inform you of any gates or
decommissioned roads that would be important for planning your site visit. It is important to read over
the forestry site plan for the wetland of interest, as well as the land use plan if possible. This will ensure a
general overview of what management strategies were prioritized and how the wildlife/land was
considered.
Wetland Information (T.1.1)
Wetland ID – A unique identifier for the wetland (found by querying the spatial information).
Source of wetland polygon – Select or describe the source that best reflects the most accurate
boundaries of the wetland (you may need to confirm this once in the field). Sources may include
the Freshwater Atlas (FWA), site plans, the Vegetation Resource Inventory, digitized layers
defined by the user, etc.
Biogeoclimatic Ecosystem Classification (BEC) – record the BEC for the area.
Natural Disturbance Type (NDT) – record the natural disturbance type (e.g., NDT1). This will be
needed to help answer Q14, and can be found by cross-referencing the BEC sub-zone and variant
in the Biodiversity Guidebook. (https://www.for.gov.bc.ca/hfd/library/documents/bib19715.pdf )
If unknown, both BEC and NDT can be found by following these 5 steps:
1. Launch iMap BC: https://maps.gov.bc.ca/ess/hm/imap4m/
2. Zoom to wetland location of interest.
Note: If you are unsure where your wetland is, open up the wetlands layer within the Freshwater
Atlas which “may” include the wetland of interest or at least help better orient yourself. Do this
by clicking under tab “Data Sources”, select “Add Provincial Layers”. In the pop-up “Add/Remove
Map Information”, click to expand options under “Base Maps”, then click to expand options
within “Freshwater Atlas”, then select “FWA – Wetlands – Colour Theme” and press OK
11Wetland Management Routine Effectiveness Evaluation – January 2021
3. Select tab “Data Sources” and select “Add Provincial Layers”
4. In the pop-up “Add/Remove Map Information”, click to expand options under “Forest
Grasslands and Wetlands”, then click to expand options within “BEC Analysis –
Zones/Subzones/Variants – All”, then select “BEC Analysis – Zones/Subzones/Variants –
Coloured Themes” and press OK
5. Under the “Find Tab”, select the icon labeled “Point” (it has an icon of a cross-hairs with a blue
circle with the letter “i”), then hover your cursor over the wetland of interest, and then left
click. A side bar will appear labeled Identify Results. Select the “BEC Analysis –
Zones/Subzones/Variants – Colour Theme”. The BGC for the area you selected will appear
(e.g., Interior Douglas Fir), click on the symbol “>”, next to the listed BGC, and details for the
BGC will appear. Record both the BGC Label including the variant (e.g., IDFxh1), and the
Natural Distrubance Type (e.g.,NDT4). Put these in the appropriate fields of the form.
Total Wetland Size – Record in square meters (note: 1 ha = 10,000 m2)
Hydrogeomorphic System – Select from estuarine, fluvial, basins & hollows, seepage slopes,
lacustrine, ponds & potholes, and marine. Refer to Mackenzie and Moran 2004, (p41) for a
descriptor of each type.
Wetland is hydrologically connected to a stream? – Record yes or no.
Helpful tip: Calculate wetland size information on page 3 of the field form. The field evaluator must
document Wetland Size, Total Polygon Assessed, and Total Upland Area (10 m buffer) (See pg 16 of the
protocol for further information). These values represent the actual wetland size and assessed area as the
field evaluator may be required to make adjustments once they visit the site and determine the true
boundaries and any access issue. It is helpful, however, to measure these values using desktop tools prior
to going into the field, and then adjust if modifications are necessary. This will allow the field evaluator to
make many of the subsequent calculations in the field that require these values.
First Nations Information (T.1.2)
List all First Nations territory in which the wetland is located and contact the chief(s) or band offices (as
appropriate). The Province of BC’s Consultative Area Database can help you determine which First
Nations may have an interest in a particular wetland. Explain the objective of conducting a wetland
health assessment and invite interested individuals to participate in the field-based component.
Opening Information (T.1.3)
Complete this section if the wetland is within 2 riparian management area (RMA) widths of a cutblock.
District – The official three-letter code for the natural resource district (e.g., DCR for Campbell
River Natural Resource District).
Opening ID – The unique 5-7 digit code from RESULTS (used each year in the random selection of
cutblocks for sampling).
Licensee – The company that holds the forest license for the block.
Forest License – The forest license recorded for the cutblock in RESULTS.
12Wetland Management Routine Effectiveness Evaluation – January 2021
Block – The designation used by the licensee on their logging plan or site plan map.
Harvest Year – The year timber in the selected block was harvested along the sample reach.
Harvest Location – The location of harvesting in the block relative to the sample wetland; record
north, east, south, and/or west, as applicable.
Wetland Riparian Class on Plans – Record the wetland riparian class (W1-W5 or unclassified
wetland) indicated on the logging plan and/or site plan map.
Wetland Riparian Class in Field – In most cases, this is the same as the wetland riparian class on
the logging plan. Record a different wetland riparian class only if it was misclassified. Wetland
riparian classes are defined in Figure 3. Note: A wetland complex (W5) must consist of two or
more individual wetlands with overlapping riparian management areas and a combined wetland
area of 5 ha or more.
Record the riparian management area (RMA), riparian reserve zone (RRZ), and riparian
management zone (RMZ) in metres (see Table 1).
Figure 3. Key to wetland riparian classification (Source: Forest Practices Code Guidebook: Riparian
Management Area Guidebook 1995).
Wetland Riparian Class RMA (m) RRZ (m) RMZ (m)
NCW 0 0 0
W1 50 10 40
W2 30 10 20
W3 30 0 30
W4 30 0 30
W5 50 10 40
Table 1. Associated riparian management distances from edge of wetland based on wetland riparian class
from the B.C. Riparian Management Area Guidebook. Note: NCW = non-classified wetland.
13Wetland Management Routine Effectiveness Evaluation – January 2021
Riparian/Buffer Retention Information (T.1.4)
Riparian/Buffer Retention – Record the following attributes related to the wetland buffer. The buffer can
have 3 potential treatments: full retention, partial retention, or no retention. If you feel the information
on riparian retention in T.1.4 does not adequately describe the condition of the riparian area, please add
a sketch of the riparian area on page 16 of the field form. A photograph or two of the riparian area can
also be invaluable in describing the riparian conditions.
Length of wetland perimeter within assessment polygon (m): Record in meters the length around
the wetland edge.
Length along wetland perimeter with full treed retention (m): Record in meters the length of the
perimeter where the riparian area has had no harvesting.
Average width of full treed retention present (from wetland edge) (max 100m): Record the width
of full retention or record 100 m if the width is greater than 100 m.
Length along wetland perimeter with partial retention (m): Record in meters the length of the
perimeter where the riparian area has had recent partial/selective harvesting.
Average width of treed retention present with partial retention (from wetland edge - max 100 m):
Record the width of partial retention or record 100 m if the average width is greater than 100 m.
Average treed retention present with partial retention (% of basal area): Record % of basal area
remaining.
Length along wetland perimeter with no retention (m): Record in meters the length of the
perimeter where clearcut harvesting is adjacent to the wetland boundary.
Description of dominant upland vegetation strata around perimeter of wetland (T.1.5)
Table T.1.5 of the field form is used to stratify abutting upland areas in order to place sampling transects
and to describe the associated upland characteristics. The evaluator will want to stratify the perimeter to
represent major differences in the land-base abutting the wetland that may positively or negatively
influence the functioning condition of the wetland.
Upland Descriptor for Vegetation Strata and Age – Provide a descriptor for dominant vegetation
types within 100 m perpendicular to the wetland perimeter. For example, if the first 30 m of the
upland area from the wetland edge is treed retention and the next 70 m is recent cutblock, record
recent cutblock. Descriptors may include: recent cutblock; young/mature/old coniferous;
young/mature/old deciduous; young/mature/old mixed forest; lake/pond abutting; stream/river
abutting; grassland, other.
Disturbance: Record disturbance type. For example, if the upland descriptor was “young forest” ,
it may be because it was burned. If that is the case, record “recent fire” for disturbance type.
Descriptors may include: recent cutblock, old cutblock, recent fire, insect infestation, log sort –
landing, road within 100 m, other.
14Wetland Management Routine Effectiveness Evaluation – January 2021
Width – Record the approximate distance the dominant vegetation type extends beyond the
wetland perimeter. If it extends beyond 100 m, then record 100 m.
Length Along Wetland Perimeter – Record the length of the wetland perimeter occupied by the
dominant vegetation type.
Fraction along wetland perimeter- This is the fraction that is composed of your upland type. If
your total perimeter is 800m and the cutblock is along 200m, the fraction is 0.25 (or 25%).
Number of Transects – Record the number of transects to be documented within the wetland for
each strata. For wetlands 45% of the perimeter occupied, place two transects in the wetland – one in each type. For
wetlands with two dominant vegetation types, but one type occupies less than 45% of the
wetland perimeter, then place two transects in the dominant upland type and one in the less
dominant. For wetlands with greater than three dominant vegetation types, place a transect in
each vegetation type that occupies >10% of the perimeter.
Location of Transect Along Perimeter Section – To place transects within the stratified vegetation
types, use a random number generator that will mark the location of the transect along the
wetland perimeter. The FREP Wetland Filemaker App will automatically do this for you.
Otherwise, if the cutblock portion occupies 204 metres of the wetland perimeter, then select a
random number between 0 and 204. Using this example, a random number can be generated
very quickly in Microsoft Excel by typing in a cell “=randbetween(0,204)”, which will randomly
generate a number between the two numbers specified. For consistency, set smaller numbers to
larger numbers in a clockwise direction around the wetland perimeter.
Upland Descriptor Disturbances (s) Width Length Fraction Number of Location(s) of
for Vegetation (e.g., insects, (m) along along Transects transects along
Strata and Age road, cutblock) perimeter wetland perimeter section
(m) perimeter
Mature Road 100 370 0.54 1 345 x x
Coniferous Forest
Cutblock Recent Cutblock 80 212 0.31 1 198 x x
Young Mixed Old Cutblock 100 105 0.15 1 32 x x
Forest
Table 2. Example of T.1.5: Description of Dominant Upland vegetation Strata Around Perimeter of
Wetland.
Other Developments (T.1.6)
Describe the contributing basin upstream of the wetland and estimate the percent that has been
developed. You can use the tools provided in ArcGIS, QGIS, Google Earth, FREPmap (government only), or
15Wetland Management Routine Effectiveness Evaluation – January 2021
a georeferenced pdf to draw polygons and calculate the areas of both the watershed and the
development to help estimate this value. Include road right-of-ways, agriculture pastures, existing
cutblocks, transmission lines, and any other man-made features when calculating the area of
development.
Number of Road Crossings – Three numbers are asked for: the number of road crossings within
the polygon being assessed (including the 10m upland area), the number of road crossings in the
wetland, and the number of crossings on any upstream tributaries that flow into the wetland.
Percent of Watershed Developed Upstream – Delineate the watershed area above the wetland
polygon being assessed using topographic map layers and/or imagery and estimate the total
percent area developed to date.
Main Development – Record the main human activity present in the watershed area above the
sample polygon (e.g., roads, forestry (except roads), agriculture, recreation, mining, oil and gas,
transportation, utilities, other, none).
Landscape Indicators (T.2)
Prior to heading out to the field, several of the health indicator questions can be estimated in the office.
Refer to the landscape section starting on page 44 in this document for completing section T.2. on the
form.
Supplementary Management Observations (T.3)
Section T.3 in the form contains supplemental management observations that can be observed either in
the office and/or while on site.
Do the boundaries on the site plan for the wetland coincide with observations in the field?–
Record Y or N.
Was there retention around other wetlands observed on the block? Record Y or N – this may be
best observed from a combination of map and field observation.
Is four-wheel drive access blocked on roads within 100 m from the wetland edge? Record Y or N.
If rangeland is present, were measures taken to reduce/block livestock access to the wetland
edge? Record Y or N. For example, are there any recent fences or logs that appear to purposefully
block or control access to the wetland?
STEP 2 – FIELD BASED OBSERVATIONS
Field surveyors are strongly encouraged print, or take an electronic copy, of the 2-page instructions in
Appendix 1 to take into the field for an efficient step-by-step process to gather field-based
observations.
Once in the field, before starting any measurements, first confirm the wetland is a wetland, the wetland
polygon boundary is accurate/appropriate, and the wetland is within two riparian management areas.
At the top of the FIELD SAMPLING INFORMATION page (pg 3):
16Wetland Management Routine Effectiveness Evaluation – January 2021
Check the box for whether sampling is representative of the entire wetland or a portion of the wetland. If
only a partial area of a wetland was selected, provide a description on page 18 as to where the wetland
polygon was segmented, and provide a rationale for why the partial wetland was selected (e.g., large size,
change in management regimes, access blocked, etc.). The entire wetland may not be feasible to assess
due to access barriers (e.g., extremely dense brush, deep channels, other safety concerns). After
reviewing the site from the office or the field, the evaluator may determine that the wetland poses access
barriers and adjust the total polygon assessed.
Total Polygon Assessed – Record in m2. For the purposes of this evaluation, the Wetland Polygon
Assessed includes the 10 m spatial buffer for some questions. This measurement is the wetland assessed
size plus the 10 m upland size. This can be calculated using QGIS or FREPmap (for government employees)
by drawing a wetland polygon, then creating a 10m buffer and drawing a polygon around the outer
boundary and calculating total area using the GIS tools.
10 m Upland Size – Record in m2. This is the area of the 10 m buffer around the wetland to be assessed.
Use the previous value for total assessed area and subtract the area that only represents the wetland to
derive 10m upland size.
Wetland Assessed Size – Record in m2 (will be different if only a portion of the wetland is assessed as part
of this evaluation).
Transect Placement
As per instructions on page 14 of this guide, place up to three transects in the wetland. At least one of
the transects should enter the wetland upslope of the cutblock to be evaluated. If there is variability in
upland seral or ecosystem communities (e.g., young, old, mixed forest, grassland, other) that are greater
than 10% along the perimeter, distribute the other transects to best represent the next two most
dominant communities (See Figure 4a). Less dominant ecosystems can be “clumped” if needed. Selection
of where to place the transects can often be determined from reviewing aerial imagery but may need to
be adjusted if there are barriers in the field.
17Wetland Management Routine Effectiveness Evaluation – January 2021
Figure 4. Placement of transects and plots, and associated calculations. A) Simple wetland where the
entire wetland is part of the total polygon assessed. B) Only a portion of the wetland is assessed due to a
barrier to access. C) Placement of plots into the wetland are located to represent major changes in
vegetation or seral stage.
For each transect, record the percent of dominant ecosystem type or seral stage that is represented in
the upland section in table T.4.1 in the field form. This should match what was recorded in T.1.5. on page
1 of the form. Use this percentage and the percent length of the transect (i.e., in comparison to all
transects at your site) to estimate the weighted fraction that will be needed for calculating weighted
averages of transect data in T.7.1
UTM Coordinates at Wetland Edge Transect Transect is representing
Weighted Fraction
UTM Easting Northing Bearing wetland influenced from
Fraction (Fa) Fa =
Upland Fraction
(Fb) From T 1.5.
into upland strata area composed
WF = (Fa+Fb)/2
Zone Trans. Length
Wetland of:
End Type1
(0-360˚)
TL/TTL
T1 10U 665396 5601259 12˚ Mature Coniferous Forest Ww 53 0.35 0.54 0.44
T2 “” …401 ….264 211˚ Cutblock Ow 30 0.20 0.31 0.25
T3 ““ …311 …387 345˚ Young Mixed Forest E 70 0.45 0.15 0.3
Total Transect Lengths (TTL) (m) 153 1 1
Table 3. Example of completed T.4.1 Transect Information. Ww = Shallow open Water, Ow = Other, E =
End of 50 m transect.
Beginning at the edge of the wetland, record the UTM coordinates for the transect in table T.4.2 on page
3 of the field form. NOTE: after writing the full coordinates for the first transect, additional GPS
coordinates can be truncated so that there is only a need to record the last 3 or 4 digits of the Northing
and Easting when the other numbers are not changing.
The first 10 m of the upland area surrounding the wetland is included in many of the evaluation
questions. Walk at a right angle 10 m upslope from wetland edge. In the vegetation plot, T.4.3, record %
invasive and % disturbance increasers (record plot as U1 for the first upland transect).
18Wetland Management Routine Effectiveness Evaluation – January 2021 Importance of buffers around wetlands. Buffers around wetlands can provide visual screening for large ungulates and thus provide security from predators (including hunters), limit livestock accessing the site, improve habitat complexity for species that require multiple habitat needs (including many amphibians, flycatchers, cavity nesters, etc.), and reduce sedimentation from upstream erosion. As wetlands provide numerous resources and life needs, they are often part of wildlife movement corridors. Wildlife and human trails are often found around the perimeter of wetlands within the upland portion. Culturally modified trees to mark trails and other signs of human use are of historic and ongoing value to archaeologists and First Nation communities. After recording buffer parameters, use a rotary tape and walk into the wetland at a right angle from the wetland edge. While completing the transect, walk either: 50 m (i.e., to the end of the rotary tape) or, until you are approximately midway into the wetland (which may occur in smaller wetlands), or until you are unable to go further because of a barrier. Barriers may include: shallow open water, deep water marshes, wetlands that are suspected to have thin mats of soil floating above open water (and pose a safety risk), or deep channels. If you encounter a barrier, record the transect end type in table T.4.1 (i.e., C = channel, Ww = shallow open water, Ow = open water (where aquatic or submergent is
Wetland Management Routine Effectiveness Evaluation – January 2021

of the organic soil and squeeze it in one hand as hard as you can. While doing so, pay attention
to the colour and amount of water and peat that is extruded between your fingers, and then
make observations about the remaining fragments using Table 4 on the next page. Select the
description that best matches your soil sample and categorize it as per the VP Classification.
Mark ‘Y’ in the appropriate soil column in table T.4.2 of the field form. The determination of
these soil properties aids in the classification of wetlands primarily between swamps/marshes
and bogs/fens (see Figure 1 in this guide). Swamps and marshes typically have humic or mineral
soils, whereas fens and bogs are often associated with mesic or fibric organic soils. Of note,
some swamps can occasionally have mesic soils (e.g., Ws05).

Depth to water – If water is present in the soil pit, record the depth to water in cm. Use positive
numbers if the water is below the surface. Alternatively, record a negative number (by putting a
minus sign in front of the number) if the water is above the surface.

pH and temperature – Use a recently calibrated pH meter to measure pH and record the
temperature in degrees Celsius.

Wetland class and wetland plant association - these determinations can be made by considering the soil
type and pH in combination with the vegetation plot information in T.4.3 of the field form. Use Figure 1 in
this guide to determine the wetland class. Refer to Wetlands of British Columbia: A Guide to
Identification (W.H. Mackenzie and J.R. Moran, 2004) to determine the wetland plant association. For
bogs, fens, marshes and swamps, the plant associations can be determined by using the two reference
tables that are at the start of their respective chapters in the aforementioned publication. The first table
organizes wetland plant associations by biogeoclimatic zone and their relative frequency. The second
table organizes wetland plant associations by typical percent cover of plants occupying a particular
wetland plant association. If the evaluator cannot identify the appropriate class or association, then label
“?” for undetermined.

                                                                                                         20
Wetland Management Routine Effectiveness Evaluation – January 2021
Plant
VP Classification Decomposition Water Peat Escape
structures
Clear or light yellow-
1 None Unaltered
Fibric Peat
brown
2 Almost none Light yellow-brown
No peat
escapes
3 Very weak Distinct Turbid brown
4 Weak Strongly brown turbid
Mesic Peat
Clear but Very strongly brown
Some peat
5 Moderate becoming turbid. Some peat
escapes
indistinct suspension
Somewhat Muddy with much Approx. ⅓ of
6 Moderately strong
indistinct suspended peat peat escapes
Indistinct but Approx. ½ of
7 Strong Strongly muddy
recognizable peat escapes
Very Strong.
Humic Peat
Remnants are resistant Thick mud with little Approx. ⅔ of
8 Very indistinct
to decomposition water peat escapes
(e.g., roots and wood).
Almost Almost all peat
9 Almost complete
unrecognizable escapes
No water
All peat
10 Complete Unrecognizable
escapes
Table 4. Organic soils classification based on the von Post scale.
Completing the Vegetation Plot Information Table
A full plant list is not necessary when filling out table T.4.3 of the field form. In each plot, focus on a few
of the most dominant wetland plants (so that you can determine the wetland plant association in
T.4.2.), invasive and disturbance increaser species (so that you can answer indicator Questions 2a and
3), and plants of cultural importance. For each plant, record the percent cover. Mark “N” if there is poor
form, vigor or recruitment. Poor form may include observations of atypical plant structure or physical
damage. For instance, when sedge hummocks are over browsed, the crown may be damaged, and they
may look irregular as opposed to well-rounded. Poor vigor would include atypical colour (e.g., browning
or yellowing), stunted growth, or disease. Poor recruitment includes lack of younger age classes. Also,
check off if the plant is an invasive weed (Appendix 2), a disturbance increaser (Table 6 in this guide), or
plant of cultural value (Appendix 3). Your region may have lists of weeds that are more appropriate for
your study area. Local First Nations may also wish to provide a revised list of culturally significant plants
to monitor. Table 5 below provides an example of the completed table.
21You can also read