NBFI Monitor No 6 / August 2021 - EU Non-bank Financial Intermediation Risk Monitor 2021
←
→
Page content transcription
If your browser does not render page correctly, please read the page content below
NBFI Monitor
No 6 / August 2021

EU Non-bank Financial
Intermediation Risk Monitor 2021
Contents

Executive summary                                                                                 3

1      Overview                                                                                   6

       1.1     Developments in main aggregates                                                    6

       Box 1 UK withdrawal from the EU and statistics in the NBFI Monitor                         9

       1.2     Overview of risks and vulnerabilities                                              10

       1.3     Engagement in certain risky activities                                             16

       1.4     Recent developments in the EU policy framework (regulatory update)                 18

2      Special features                                                                           20

       2.1     Commercial real estate – liquidity and leverage risks in investment funds          20

       2.2     Insurance – role in non-bank financial intermediation                              25

       2.3     Archegos, Greensill and GameStop – relevance for EU financial stability            33

3      Entity-based monitoring                                                                    36

       3.1     Developments in the EU investment fund sector                                      36

       3.2     Other financial institutions                                                       48

4      Activity-based monitoring                                                                  55

       4.1     Derivatives                                                                        55

       4.2     Securities financing transactions                                                  57

       4.3     Securitisation                                                                     60

       Box 2 Upcoming ESRB report on securitisations                                              61

5      Statistical overview                                                                       62

       5.1     Statistical classification for investment funds and other financial institutions   62

       5.2     Developments in main aggregates                                                    63

       5.3     Entity-based monitoring                                                            68

       5.4     Activity-based monitoring                                                          78

EU Non-bank Financial Intermediation Risk Monitor 2021 No 6 / August 2021
Contents                                                                                           1
Abbreviations 81 Imprint and acknowlegements 83 EU Non-bank Financial Intermediation Risk Monitor 2021 No 6 / August 2021 Contents 2
Executive summary

The year 2020 – the review period for this edition of the EU Non-bank Financial
Intermediation (NBFI) Risk Monitor – was dominated by the coronavirus (COVID-19)
pandemic, which highlighted vulnerabilities in the NBFI sector. The review period was
characterised by an unprecedented contraction in economic output and extreme volatility in
financial markets. At the height of the market turmoil in March 2020, certain types of investment
funds, notably corporate bond funds and non-government money market funds (MMFs), saw a
strong increase in investor redemption requests coupled with a deterioration in the liquidity of their
assets. As a result of extraordinary measures taken by governments, central banks and supervisory
authorities in the European Union (EU) to support the economy in the face of the pandemic,
financial markets stabilised. By the end of the year, asset valuation in fixed income and equity
markets had reached pre-pandemic levels and above. Corporate bond funds, equity funds and
MMFs recorded high inflows, especially in the third and fourth quarters. Since then, valuations have
continued to increase across asset classes, also reflecting an improved economic outlook. The
developments during 2020 highlighted some of the vulnerabilities identified in previous editions of
the NBFI Monitor and the need to adjust the regulatory framework to address them.

This report considers a range of systemic risks and vulnerabilities related to non-bank
financial intermediation, including those stemming from interconnectedness, liquidity and
leverage. The monitoring universe of this report includes all investment funds and so-called other
financial institutions (OFIs). The size of this monitoring universe is measured by assets under
management (AuM) in investment funds and OFIs, and thus excludes the assets of banks,
insurance corporations and pension funds, as well as central counterparties with a banking licence.
In the EU (euro area), this measure stood at €39.4 trillion (€36.7 trillion) in the fourth quarter of
2020, an increase of 1.5% (0.5%) compared with the end of 2019. This growth suggests that the
monitoring universe has recovered from the initial effects of the pandemic, which in the first quarter
of 2020 led to a quarter-on-quarter fall in asset values held by EU investment funds and OFIs (-
3.1%), as well as to outflows. This year, following the United Kingdom’s withdrawal from the EU,
most of the charts and statistics presented in this report do not include UK data (Box 1). While the
size of the monitoring universe is important for monitoring purposes and might contribute to the
degree of systemic risk, it is not, in itself, a sufficient measure of it. Against this background, this
report considers a broad range of risks and vulnerabilities.

The assessment of risks and vulnerabilities considers both structural and cyclical risks.
There are four key cyclical risks that emerged as a result of the impact of the COVID-19 pandemic
and that will require close monitoring: (i) uncertainty about the pace of economic recovery; (ii) rising
indebtedness, increased credit risk and risks from associated rating downgrades; (iii) decoupling of
the real economy and financial markets; and (iv) the fragile nature of liquidity in some markets. In
addition, several structural risks identified in previous editions of the NBFI Monitor require ongoing
monitoring, including through the development of improved risk metrics as new data become
available. These include (i) excessive risk-taking, liquidity transformation, and risks associated with
the use of excessive leverage among some types of investment funds and OFIs; (ii) domestic and

EU Non-bank Financial Intermediation Risk Monitor 2021 No 6 / August 2021
Executive summary                                                                                          3
cross-border interconnectedness and the risk of contagion across sectors and within the non-bank
financial system; and (iii) risks related to the low interest rate environment. 1

Liquidity and maturity transformations within the investment fund sector remain a source of
risk going forward. While MMFs’ assets have recovered and funds have substantially increased
their liquid holdings, they remain exposed to the low liquidity of the private money markets they
invest in, as seen in March 2020. Bond funds have further extended the duration of their portfolio,
exposing them to additional interest rate risk, and their cash holdings have declined further. The
credit ratings of their bond holdings have also deteriorated slightly, pointing to an increase in credit
risk. Similarly, real estate funds having an asset-liability mismatch remain exposed to liquidity risk.

The NBFI Monitor 2021 includes three special features, which cover real estate funds, the
insurance sector’s engagement in financial intermediation activities and three isolated
events that occurred in early 2021 and showed how leverage and concentration risks can
materialise.

•     Analysis of Alternative Investment Fund Managers Directive (AIFMD) data shows that some
      real estate funds offer daily redemptions without long notification periods, while investing in
      illiquid assets. In addition, liquidity buffers have fallen to their lowest levels since 2017.
      Liquidity risk in real estate funds is further amplified by vulnerabilities in the commercial real
      estate (CRE) market in certain countries: long-term trends (such as the low interest rate
      environment) have contributed to increases in valuations, which exposes the CRE segment to
      the risk of a sharp price correction. In addition, valuation difficulties due to the lack of
      transactions make the CRE segment more vulnerable.

•     With assets of €9.4 trillion as of the fourth quarter of 2020, the EU insurance sector is an
      important investor that contributes to non-bank financial intermediation in the EU. A special
      feature focuses on three aspects of insurers as non-bank financial intermediaries: (i) credit
      intermediation, (ii) interconnectedness with non-banks, and (iii) interconnectedness across
      markets via derivative positions. Overall, insurers engage moderately in the risky activities
      monitored in this report, but given the size of the sector and its interconnectedness with banks
      and other non-banks, insurers could contribute to the propagation of risks.

•     Three notable but isolated events in 2021 have shown how risks around interconnectedness,
      liquidity and leverage can materialise even when markets are buoyant. First, in early 2021, the
      stock prices of a few US firms on which some investment funds made significant short
      positions, most importantly GameStop, increased rapidly. This increase was due to a large
      number of investors creating exposures to the company either by purchasing the stock or by
      acquiring call options on the equity, but also to procyclical effects stemming from short sellers
      covering their positions and dealers hedging their sales of options by purchasing the
      underlying stocks, which resulted in price amplification. Second, the following month, a
      European bank supervisor froze the assets of Greensill Bank owing to possible balance sheet
      manipulation. The bank belonged to a supply chain finance group that acquired trade
      receivables. Those purchases were funded by the bank and by repackaging the receivables
      into notes, with additional credit guarantees provided by insurers, which were subsequently

1
    See “Lower for longer – macroprudential policy issues arising from the low interest rate environment”, ESRB, June
    2021.

EU Non-bank Financial Intermediation Risk Monitor 2021 No 6 / August 2021
Executive summary                                                                                                   4
sold to EU investment funds. Insurers refused to renew the guarantees of the bonds due to
increased concerns about the ability of clients to pay the receivables, which resulted in the
suspension of redemptions for funds exposed to those notes. Third, at the end of March, the
US family office management company Archegos collapsed, as the firm was unable to meet
variation margin calls on highly concentrated leveraged positions on stocks acquired through
derivatives. Counterparties had to liquidate the equities, resulting in large losses for some. All
three of these events show how risks around leverage and liquidity can crystallise. In addition,
interconnectedness between different institutions can result in an underestimation of risks by
individual institutions. While these particular events did not have systemic consequences, they
illustrate how a materialisation of risks can quickly propagate through the financial system.
EU Non-bank Financial Intermediation Risk Monitor 2021 No 6 / August 2021
Executive summary 51 Overview The NBFI Monitor 2021 mainly focuses on developments during 2020, which were dominated by the coronavirus (COVID-19) pandemic. In the first half of 2020, growth of the European investment fund and OFI sectors was negatively affected by the effects of the pandemic, limiting temporarily their ability to provide financial intermediation to non-financial corporations (NFCs). For larger NFCs that can access capital markets, non-bank lending has become integral to the management of their liquidity and funding needs. Because of the flexibility that non-bank financial intermediation provides, these NFCs can issue new securities as the need for cash arises, at least in non-crisis times. This flexibility allows them to avoid costs linked to the holding of excess liquidity. Non-bank financial intermediaries, in particular investment funds, have increased their duration and hold an important share of lower-rated NFC debt exposures, amplifying the likelihood of losses and outflows if corporate credit risk rises materially. In a low interest rate environment in which investors search for yield, increased risk-taking is an expected outcome. However, increased risk-taking, possibly coupled with herding behaviour and mispricing of risks, can also threaten the resilience of the non-bank financial sector if risks materialise. This report examines the growth of vulnerabilities that could arise from non-bank financial intermediation, e.g. liquidity and maturity transformation, leverage and interconnectedness within the financial system. 1.1 Developments in main aggregates The COVID-19 pandemic caused major disruptions in global and EU economic activity, which resulted in severe price and liquidity dislocation in many markets. The COVID-19 crisis posed unprecedented challenges for global economies. EU gross domestic product (GDP) fell by 3.7% and by 11.4% quarter-on-quarter in the first and second quarters of 2020, according to Eurostat. As markets tried to find equilibrium in the early stages of lockdowns across the United States and Europe, severe price and liquidity dislocation occurred in many markets. At the peak of the dislocation in March 2020, central banks in the euro area globally expanded liquidity operations and launched targeted asset purchases to ensure the transmission of their monetary policy. Although liquidity strains in financial markets subsequently eased, the measures taken by central banks were not designed to, and did not, eliminate the underlying vulnerabilities. After an increase in 2019, net finance raised by euro area NFCs decreased in 2020 as a result of the pandemic. Financing obtained by NFCs in the form of direct bank loans increased in the first half of 2020, as granting of bank loans was supported through government guarantees. Both debt securities and unlisted shares recovered as a source of funding for NFCs in the second quarter of 2020, while net finance raised through the issuance of listed shares decreased, especially in the fourth quarter of 2020 (Chart 1/Chart A-1). This may reflect a preference for share buyback programmes rather than the issuing of new stock due to a lack of investment opportunities. Debt securities and listed shares issued by NFCs are mainly held by non-bank financial institutions, with a smaller share held by banks. In some EU jurisdictions, the non-bank financial sector is also an important source of funding for households. For example, in the Netherlands, 35% of new mortgages are provided by pension funds, insurers and mortgage funds. EU Non-bank Financial Intermediation Risk Monitor 2021 No 6 / August 2021 Overview 6
Chart 1 (Chart A-1 in the statistical overview)
Net finance raised by euro area non-financial corporations

(EUR billions)

           Bank loans                  Unlisted shares
           Debt securities             Total
           Listed shares

1,000

  800

  600

  400

  200

    0

 -200
        2006   2007   2008   2009   2010   2011   2012   2013   2014   2015   2016   2017   2018   2019    Q1     Q2     Q3     Q4
                                                                                                          2020   2020   2020   2020

Sources: ECB Quarterly Sector Accounts (QSA) and ESRB calculations.
Note: The latest observation is for the fourth quarter of 2020.

The size of the EU non-bank financial sector declined in the first quarter of 2020, reflecting
price and volume effects, but recovered by the end of the year. The size of the EU (euro area)
non-banking sector decreased to €37.6 trillion (€35.5 trillion) in the first quarter of 2020, compared
with €38.9 trillion (€36.5 trillion) at the end of 2019 (Chart A-2). AuM in investment funds decreased
significantly throughout the first half of 2020, affected by valuation losses during the first quarter
(Chart A-4.1). OFIs, on the other hand, saw a much more limited decrease in total assets over the
six-month period (Chart A-4.2). The assets included in the non-banking sector (including insurance
corporations and pension funds (ICPFs)) make up 53% of the assets of the overall financial sector
(i.e. including the European System of Central Banks (ESCB)). In 2020, the relative size of the
ESCB increased from 9% to 12%, due to its exceptional monetary operations. For all sectors but
the OFI sector, total assets increased overall in 2020, showing that financial markets did more than
just recover from the pandemic. Despite its decrease in total assets, the OFI sector remains the
largest non-bank sector with €22.3 trillion, followed by non-MMF investment funds with €14.9
trillion, ICPFs with €13.2 trillion and MMFs with €1.4 trillion (Chart A-3.1 and Chart A-3.2). The
countries with the five largest non-bank financial sectors in the EU (by size: Luxembourg, the
Netherlands, Ireland, Germany and France) make up 84% of the monitoring universe (Chart A-7).

EU Non-bank Financial Intermediation Risk Monitor 2021 No 6 / August 2021
Overview                                                                                                                              7
Chart 2 (Chart A-2 in the statistical overview)
Assets under management in EU and euro area investment funds and other financial
institutions
(EUR trillions and annual growth rates)
EU AuM (right-hand scale) Euro area growth rate (left-hand scale)
Euro area AuM (right-hand scale) Euro area growth rate – transactions-based (left-hand scale)
EU growth rate (left-hand scale)
35% 50
30%
40
25%
20%
30
15%
20
10%
5%
10
0%
-5% 0
2004 2006 2008 2010 2012 2014 2016 2018 2020
Sources: ECB and ECB calculations.
Note: The latest observation is for the fourth quarter of 2020.
Amid the liquidity strains during the first quarter of 2020, the share of the total funding of the
banking sector provided by non-bank financial entities increased significantly and was
reflected by higher deposits. Wholesale funding provided by non-bank financial entities to the
banking sector increased by 8.1% year-on-year to €2.6 trillion in the first quarter of 2020 from €2.4
trillion in 2019 (Chart 3). Much of the increase in debt securities issued by banks was attributable to
purchasing of certificates of deposits (+55.4%) and OFI deposits (+17.4%) by MMFs, while banks’
funding through securitised assets net of retained securitisations decreased by 8.5%. Data on
European securitisation issuance (including placed and retained securitisations) by collateral type
showed that total issuances in 2020 were lower than those in 2019 for commercial mortgage-
backed securities (-59%), collateralised debt obligations (-44%), residential mortgage-backed
securities (-23%) and loans to small and medium-sized enterprises (-68%). Meanwhile, total
issuances of asset-backed securities increased (+45.5%) (Chart A-33 and Section 3.3). The share
of simple, transparent and standardised (STS) securitisations increased to 40% of total issuances
in 2020 compared with 33% in 2019, according to the Association for Financial Markets in Europe
(AFME). 2
2
See “Securitisation Data Report – Q4 2020”, AFME.
EU Non-bank Financial Intermediation Risk Monitor 2021 No 6 / August 2021
Overview 8Chart 3 (Chart A-8 in the statistical overview)
Wholesale funding provided by non-bank financial entities to the banking sector
(EUR trillions and annual growth rates)
Growth rate (year-on-year, right-hand scale) Residual OFI debt securities
OFI deposits Securitised assets net of retained securitisations
MMF deposits As share of banking sector (right-hand scale)
IF debt securities
MMF debt securities
3 10%
8%
6%
4%
2
2%
0%
-2%
1
-4%
-6%
-8%
0 -10%
Q1 Q2 Q3 Q4 Q1 Q2 Q3 Q4 Q1 Q2 Q3 Q4 Q1 Q2 Q3 Q4 Q1 Q2 Q3 Q4 Q1 Q2 Q3 Q4 Q1 Q2 Q3 Q4 Q1 Q2 Q3 Q4 Q1 Q2 Q3 Q4
2012 2013 2014 2015 2016 2017 2018 2019 2020
Sources: ECB and ESMA calculations.
Box 1
UK withdrawal from the EU and statistics in the NBFI Monitor
Most of the statistics presented in this report no longer include UK data, reflecting the
withdrawal of the United Kingdom from the EU and the European Economic Area (EEA) on
31 January 2020. The United Kingdom decided to withdraw from the EU and the EEA with effect
from 31 January 2020. UK data have therefore been excluded from the statistics of this report.
Time series have been recalculated without the United Kingdom to ensure comparability. In some
cases, however, UK data are still included or mentioned. The sections on hedge funds, private
equity funds and private debt funds still refer partly to the United Kingdom because some statistics
refer to 2019. The securitisation section also includes UK commercial data.
The UK non-bank sector is important, with AuM equivalent to 20% of EU 27 AuM. Chart A
shows that the United Kingdom’s outstanding AuM in Q4 2020 stood at €7.3 trillion. Compared with
the EU 27 figure, UK AuM have not been as affected by the pandemic. The United Kingdom is the
main home country of hedge funds, as well as of “residual OFIs” (Chart A-7 of the previous edition),
and this is where the impact shows most, besides aggregated EU figures.
EU Non-bank Financial Intermediation Risk Monitor 2021 No 6 / August 2021
Overview 9Chart A
Assets under management in investment funds and other financial institutions
(EUR trillions and annual growth rates)
Euro area AuM (right-hand scale) EU growth rate (left-hand scale)
Non-euro EU AuM (right-hand scale) Euro area growth rate (left-hand scale)
UK AuM (right-hand scale) UK growth rate (left-hand scale)
80% 50
60%
40
40%
30
20%
20
0%
10
-20%
-40% 0
2004 2006 2008 2010 2012 2014 2016 2018 2020
1.2 Overview of risks and vulnerabilities
From a macroprudential perspective, a growing non-bank financial sector brings benefits in
terms of increased risk-sharing across the financial system, but it can also result in new
risks and vulnerabilities. The expansion of the non-bank financial sector in recent years has been
accompanied by an increase in liquidity transformation and maturity transformation, combined with
a pick-up in leverage for some entities. Such risk-taking has created vulnerabilities which need to
be monitored and assessed, taking into account interconnectedness within the financial system, as
well as the role of non-bank financial institutions in funding the real economy more broadly.
Figure 1 provides an overview of the potential risks and vulnerabilities arising from non-bank
financial intermediation in the EU.
EU Non-bank Financial Intermediation Risk Monitor 2021 No 6 / August 2021
Overview 10Figure 1
Risks and potential vulnerabilities in the EU non-bank financial sector
The economic outlook for investment funds and other financial institutions is challenging for 2021, while market conditions
are benign
Economy Credit risk Decoupling Liquidity
Uncertainty around pace and High indebtedness levels Risk of sharp market Improvements compared to
extent of economic recovery, due to COVID-19 pandemic; correction due to gap Q1 2020 but fragile market
both in the EU and globally expected rise of defaults between asset valuations structure
and economic recovery
Structural risks and potential vulnerabilities in the EU non-bank financial sector
Liquidity, leverage Interconnectedness Lower for longer
Risk-taking, liquidity risk, pricing Interconnectedness and the risk of Increased share of negative yielding
uncertainty, and risks associated with contagion across sectors and within the assets; rates expected to stay lower for
leverage among some types of investment non-bank financial sector, including longer
funds and other non-bank financial domestic and cross-border linkages
institutions
Source: ESRB.
Besides these vulnerabilities, data gaps still prevent an effective risk assessment in some
parts of the non-bank financial sector and some markets in which it invests, such as short-
term funding markets. Vulnerabilities can build up unnoticed among entities where statistical
information is not readily available or not sufficiently granular. Such gaps need to be closed,
existing data reporting frameworks improved, and consistent metrics developed. There are in
particular gaps related to some short-term funding markets in the EU, notably in terms of the size of
and activity on secondary markets. EU MMFs invest mainly in commercial paper (CP) and
certificates of deposit (CDs). While the reporting requirements under the Money Market Fund
Regulation (MMFR) provide information on MMF exposures, little information is available on the
size of those markets, especially for CP, which tends to be fragmented across jurisdictions. 3 In
addition, the COVID-19 crisis has shown that the liquidity of short-term funding markets can
deteriorate substantially. Data on secondary market activity for these markets are very scarce,
however, including trading volumes and bid-ask spreads.
1.2.1 Cyclical risks
Economy
Medium-term uncertainty has risen after a difficult year for the EU economy. After a sharp
decline at the beginning of 2020, economic activity rebounded in the second quarter as economies
reopened, before falling again at the end of the year due to a second wave of infections. The
beginning of 2021 brought positive news as the vaccine rollout started, but operational difficulties
have prevented Europe from fully benefiting from its positive effects. The medium-term outlook
3
See “Issues note on systemic vulnerabilities and preliminary policy considerations to reform MMFs”, ESRB, July 2021.
EU Non-bank Financial Intermediation Risk Monitor 2021 No 6 / August 2021
Overview 11remains highly uncertain, as scarring effects could have a permanent impact on economic output
and because of the risk of multiple waves of COVID-19 variants.
Credit risk
Credit risk has risen as corporate and public sector debt have ballooned. Leverage in the
corporate sector has increased, with firms taking on more debt to cover their fixed costs amid a
steep decline in income during the lockdown. Strong public intervention, through credit guarantees
or direct purchases of corporate bonds by central banks, has helped maintain funding costs at low
levels. While default rates have remained low, they may increase, especially for sectors most
impacted by the pandemic. As corporate restructuring takes place, losses could materialise on
financial sector balance sheets as well as for governments. 4
Decoupling
The decoupling between a strong increase in asset prices and an uneven economic
recovery raises the risk of a disorderly market correction. After a sharp decline in March 2020,
asset prices have surged across markets, with end-2020 valuations above pre-pandemic levels.
Such a rebound might reflect public support measures, as well as market expectations of a quick
recovery in economic activity. Given the uncertainty around the medium-term outlook and the pace
of the economic recovery underway across sectors and countries, markets remain subject to the
risk of a disorderly correction. Sharp falls in asset prices could lead to a surge in volatility and a
reduction in market liquidity, which would further amplify shocks within the financial system.
Liquidity risks
See the paragraph below that covers liquidity risks from a structural and cyclical perspective.
1.2.2 Structural risks
Risk-taking, liquidity risk and risks associated with leverage
After the market turmoil, liquidity and duration risks have increased in some parts of the
European non-bank financial sector, including investment funds. During the market turmoil of
March 2020, investment funds increased their liquid holdings by raising cash buffers to be able to
meet redemption requests from investors. Some funds suspended redemptions, due mainly to
either valuation uncertainty (real estate funds) or outflows (corporate bond funds). 5 As market
conditions normalised, bond funds resumed their credit intermediation and maturity transformation
4
See “Prevention and management of a large number of corporate insolvencies”, ESRB, April 2021.
5
See “Report on the Recommendation of the ESRB on liquidity risk in investment funds”, ESMA, November 2020.
EU Non-bank Financial Intermediation Risk Monitor 2021 No 6 / August 2021
Overview 12activities by investing in longer-dated bonds. Credit ratings of bonds held also decreased,
potentially reflecting downgrades (Chart 4). Liquidity buffers of real estate funds fell to their lowest
level since 2017. The current vulnerabilities in the CRE market of certain countries, including the
risk of a sharp price correction and valuation difficulties due to the lack of transactions, may trigger
liquidity risks as described in the special feature of this report on CRE.
Chart 4
Average rating of bond fund holdings (left panel) and liquidity transformation of bond and
real estate funds (right panel)
(percentages of total assets)
Q1 2019 Bond funds
Q1 2020 Real estate funds
Q4 2020
45% 80%
40%
70%
35%
30% 60%
25%
50%
20%
15% 40%
10%
30%
5%
0% 20%
AAA – A BBBexposures during the turmoil and as direct funding decreased. Since then, synthetic leverage has
contracted further but financial leverage has picked up, as hedge funds have increased repo
funding. 7
Interconnectedness and the risk of contagion
Interconnectedness of non-bank financial institutions can be significant across three
dimensions. First, direct and indirect exposures within non-bank financial institutions can be
important. Second, exposures between non-banks and credit institutions can be sizeable. Finally,
non-bank financial institutions can also display strong cross-border interconnectedness. 8
Non-bank financial institutions are closely connected with the banking sector through direct
exposures. Investment funds, MMFs and OFIs represent an important source of wholesale funding
for the banking sector. As a consequence of the liquidity stress in March 2020, deposits by OFIs
and MMFs surged by 80% in 2020 (Chart A-8). Bank-issued deposits account for about half of the
wholesale funding provided by these institutions. The other half consists of bank-issued debt
securities held by these institutions, including securitised assets. On the other hand, financing
provided to non-bank financial institutions through loans, debt securities and equities issued by
non-bank financials also accounts for about 8% of banks’ total assets (Chart A-9). In turn, deposits
with euro area credit institutions from euro area non-bank financials account for 6.3% of bank
liabilities (Chart A-10). In addition, non-bank financial institutions are exposed to banks as
counterparties for non-centrally cleared derivatives and SFTs. From a counterparty risk
perspective, banks may borrow a security from counterparties and post cash to counterparties as
collateral, or enter into derivatives transactions with counterparties. Regarding funding risk, banks
increasingly rely on non-bank financial institutions such as MMFs for short-term funding.
Nevertheless, the maintenance of such funding from MMFs to banks may not be sustainable under
stressed market conditions, as witnessed in March 2020 when non-banks used MMFs as a source
of liquidity. An abrupt withdrawal of MMF funding to banks may lead to market disruptions that
could spill over to other parts of the financial system and the non-financial corporate sector.
Non-bank financial institutions are also closely connected with each other through direct
exposures, including across borders. This is the case within the fund sector and between the
fund sector and the insurance and pension fund sector. In the euro area, ICPFs are the largest
investors in investment funds, holding 27% of funds’ shares 9 (see the special feature on insurance
corporations). Similarly, non-bank financial institutions are the largest holder of MMF shares within
the euro area.
Indirect exposures can arise through ownership structures in financial conglomerates,
involving banks, insurers and asset management companies. Banks and insurance companies
in the EU are often connected with large asset management companies within financial
conglomerates. These links can help to optimise liquidity between the parent company and
7
See “Report on Trends, Risks and Vulnerabilities”, ESMA, March 2021.
8
See Abad et al., “Mapping exposures of EU banks to the global shadow banking system”, Journal of Banking and
Finance, May 2021.
9
See “Macroeconomic and sectoral statistics – euro area, who-to-whom detail”, Statistical Data Warehouse, ECB.
EU Non-bank Financial Intermediation Risk Monitor 2021 No 6 / August 2021
Overview 14affiliated institutions and provide long-term benefits in terms of revenue and risk diversification.
However, during stress periods, the interlinkage, e.g. through credit lines and contingency
arrangements between the holding company and the affiliated institutions, can create contagion
between the affiliated institutions and to the holding company. Interdependencies also exist with
respect to revenue streams and confidence effects.
Indirect interlinkages between banks, insurance corporations and non-bank financial
institutions can result from common asset exposures. For example, euro area banks and bond
funds tend to invest in the same securities. Large common exposures between banks, investment
funds and insurers increase the risk of amplifying market stress, if they have to liquidate a large or
illiquid part of their portfolios simultaneously. In the asset management sector, the rise of passive
investments has also resulted in more funds being exposed to the same indices. Investors holding
the same assets may then suffer mark-to-market losses in their balance sheet, which can prompt
further outflows and fire sales (affecting market liquidity more broadly).
Non-banks are also exposed to the rest of the world though their holdings of foreign
securities. Within the euro area, investment funds account for more than half of the holdings of
foreign (long-term) debt securities. Such exposures provide first and foremost diversification
benefits outside of the euro area. When exposures are concentrated, they can also propagate
shocks from other countries. Shocks to other countries might spill over to the EU financial sector
through their impact on funds’ returns. In addition, a range of financial institutions obtain funding in
foreign currencies in global markets, making them exposed to vulnerabilities in short-term funding
markets, as witnessed in March 2020 when USD short-term markets faced intense turmoil and
central banks increased the volume of foreign exchange swaps.
Lower for longer
The low interest rate environment can increase vulnerabilities within the non-bank financial
sector. Low rates can lead to business model and profitability challenges, thus encouraging further
risk-taking and use of leverage. 10 In addition, the low interest rate environment puts at risk the
future performance of equity and bond portfolios, especially if they are exposed to corporations
whose financial viability depends on a continued availability of low interest rates or on fiscal support
measures.
Low rates also encourage further risk-taking, which can exacerbate risks related to liquidity
and leverage. In a low interest rate environment, investors targeting absolute nominal returns have
to increase their exposure to higher-yielding assets (by increasing credit risk, maturity risk or
liquidity risk) and/or use leverage to amplify their returns. It is therefore key to monitor such
developments and ensure that the savings vehicles chosen by investors have built-in safeguards to
limit those risks and reduce the transmission of shocks to the financial system. Indeed, as investors
take on more liquidity, credit and maturity risk, any abrupt change in interest rates can result in
large losses on fixed income instruments. In addition, an increase in the discount rate would also
10
See “Lower for longer – macroprudential policy issues arising from the low interest rate environment”, ESRB, June
2021.
EU Non-bank Financial Intermediation Risk Monitor 2021 No 6 / August 2021
Overview 15lower equity valuations, and if it were to occur in a disorderly fashion, such changes could lead to a sharp decline in valuations across asset classes. Low rates pose greater challenges, especially for some segments of the MMF industry. For MMFs using amortised cost (around 55% of EU MMFs), low rates and negative rates on government debt make it very challenging to maintain a stable NAV. In this context, EUR constant net asset value (CNAV) MMFs have almost disappeared as they cannot maintain a stable NAV while being invested almost exclusively in debt instruments with negative yields. 1.3 Engagement in certain risky activities The monitoring framework considers how non-bank financial entities are involved in certain risky activities and how these activities might have an impact on financial stability. Table 1 provides an overview of such risky activities carried out by the entities considered in this report, including liquidity and maturity transformation, leverage, interconnectedness with the banking system and credit intermediation. The level of engagement in these activities does not necessarily translate into a measure of risk. The assessment of the level of engagement in Table 1 is informed by descriptive statistics and market intelligence, but is ultimately judgement-based. It is reviewed and updated on an annual basis and incorporates improved data availability (e.g. under the AIFMD and the Securities Financing Transactions Regulation (SFTR)) and regulatory developments. A more detailed entity-based analysis is presented in Section 2, while activity-based monitoring is covered in Section 3. Hedge funds, financial vehicle corporations (FVCs), as well as security and derivative dealers (SDDs), have a pronounced engagement in the risky activities considered in this report. The engagement of equity funds is low on average, and hence equity funds are not further discussed in Section 2. Bond funds, private debt funds and MMFs, as well as special-purpose entities (SPEs) and financial corporations engaged in lending (FCLs), have a medium engagement. Mixed funds, private equity funds and exchange-traded funds (ETFs) have a low engagement, on average, at the entity level. EU Non-bank Financial Intermediation Risk Monitor 2021 No 6 / August 2021 Overview 16
Table 1
Mapping of activities to entity types
Other financial
Investment funds institutions
Bond
Private equity funds4
MMFs funds
Private debt funds
Real estate funds
Equity funds
Hedge funds
Mixed funds
Sovereign
Corporate
LVNAV
CNAV
VNAV
SDDs
SPEs
FVCs
FCLs
ETFs
Market size
EA AuM
0.1 0.6 0.6 3.6 3.3 3.8 0.4 0.8 0.9 0.8 n.a 2.1 n.a n.a 0.5
(EUR trillion)
Summary assessment
Engagement
Risk transformation activities
Credit intermediation
Maturity transformation
Liquidity transformation
Leverage2
Market activities1
SFTs
Derivatives
Reuse of collateral
Interconnectedness
Interconnectedness3
Notes: The table summarises the assessment of engagement, where the colours of the circles reflect the intensity of the
possible institutional engagement in the relevant areas of activity, according to the coding specified in the notes below. The
colouring is judgement-based and informed by market intelligence and quantitative evidence.
1) Market activities through which risk transformation can be undertaken by investment funds and OFIs can take various forms.
The list focuses on those market activities deemed to be most susceptible to risks.
2) Leverage refers to financial leverage and not to leverage that is created synthetically through the use of derivatives.
3) Direct and indirect interconnectedness with the banking system based on asset and liability data and staff assessment.
4) While credit intermediation and leverage at the fund level may be low, private equity funds can facilitate credit and leverage in
the financial system by engaging in leveraged buyout transactions. Market size data come from the Invest Europe report on
2019 European Private Equity Activity. FVCs stands for financial vehicle corporations (non-retained securitisations), FCLs for
financial corporations engaged in lending, SDDs for security and derivative dealers, CNAV for constant net asset value, VNAV
for variable net asset value and LVNAV for low-volatility net asset value. The geographical coverage of the table refers to
entities domiciled in the EU. Owing to data limitations and a lack of consistent data, the assessment does not distinguish
between consolidated and non-consolidated entities. Colour coding: =pronounced engagement; =medium engagement;
=low engagement; =unlikely or insignificant engagement.
EU Non-bank Financial Intermediation Risk Monitor 2021 No 6 / August 2021
Overview 171.4 Recent developments in the EU policy framework (regulatory update) The European Commission adopted a Capital Markets Recovery Package on 24 July 2020. The package contained targeted adjustments to the Prospectus Regulation, MiFID II and securitisation rules. The Prospectus Regulation was amended mainly to establish a new temporary “EU Recovery prospectus”. This shorter prospectus will make it easier for companies to raise capital to meet their funding needs, while ensuring adequate information is provided to investors. The MiFID II rules were amended to simplify information requirements in a targeted manner, while safeguarding investor protection. To facilitate the use of securitisation in the post-COVID-19 economic recovery, the existing EU framework for STS securitisations was extended to cover on- balance-sheet synthetic securitisations, and regulatory obstacles to the securitisation of non- performing exposures (NPEs) were removed. The package was adopted by co-legislators in early 2021. On 24 July 2020, the European Commission also adopted a proposal to amend the Benchmark Regulation. The aim of the amendments (adopted by co-legislators in early 2021) was to ensure that when a benchmark is phased out, it does not significantly disrupt the functioning of financial markets in the EU, nor pose a systemic risk to the financial system. Ahead of the replacement of the euro overnight index average (EONIA) in 2022, the European Securities and Market Authority (ESMA) launched a consultation seeking feedback on the publication of the compounded euro short-term rate (€STR) by the ECB. This consultation ended in mid-September, and its results were included in the draft Regulatory Technical Standards under the Benchmark Regulation published on 29 September 2020. On 27 October 2020, ESMA issued a public statement confirming that EU credit rating agencies would be able to endorse credit ratings elaborated in the United Kingdom after the end of the transition period. On 6 May 2020, ESMA approved the extension of registrations of four trade repositories to include SFT reporting under the SFTR, i.e. repurchase transactions, securities or commodities lending and securities or commodities borrowing transactions, buy-sell back or sell-buy back transactions and margin lending transactions. Several Member States (AT, BE, ES, FR, GR, IT) implemented short-selling bans during the COVID-related high volatility episode. In addition, ESMA issued a decision to enhance market monitoring that temporarily lowered the threshold under which the holders of net short positions in shares traded on an EU regulated market must notify the relevant national competent authority (NCA). This was reduced from when the position reaches or exceeds 0.2% to 0.1% of the issued share capital. The decision was renewed in June, September and December 2020. Regulators at EU and international level are assessing vulnerabilities in the MMF sector and are considering reforms to increase resilience to future crises. In this context, ESMA published a consultation document in April 2021 on the potential need for the review of the MMF Regulation. In the meantime, ESMA published updated guidelines on stress tests for MMFs, including modifications of the risk parameters provided by the ESRB and the ECB, to take account of MMFs’ experience during the COVID-19 crisis. EU Non-bank Financial Intermediation Risk Monitor 2021 No 6 / August 2021 Overview 18
In response to the ESRB’s recommendation, ESMA coordinated a supervisory exercise with
a focus on investment funds exposed to corporate debt and real estate assets. Results
showed that, in general, corporate debt and real estate funds were able to maintain their activities
when faced with redemption pressure and valuation uncertainty. Funds were also broadly able to
keep their portfolio structure constant. This was supported by the redemption shock lasting a short
period of time and against the backdrop of unprecedented monetary and fiscal support measures.
The supervisory exercise helped ESMA to identify five priority areas to enhance the preparedness
of investment funds for future market stress: (i) continued supervision to ensure alignment between
investment funds’ investment strategy, liquidity profile and redemption policy; (ii) closer supervision
of investment funds’ liquidity risk assessments, including liquidity stress testing; (iii) additional
specifications on how liquidity profiles should be reported under the AIFMD; (iv) the need for the
availability of a common set of liquidity management tools (LMTs) for fund managers in both UCITS
and AIFs; and (v) further supervisory work to ensure that management companies’ valuation
procedures cover all market situations, including valuation approaches for stressed market
conditions.

As a follow-up to the 2017 ESRB recommendation on liquidity and leverage in investment
funds 11, ESMA published guidelines on setting leverage limits under Article 25 of the AIFMD.

The Commission also conducted public consultations on the renewed sustainable finance
strategy (launched on 8 April), as well as reviews of the Solvency II Directive (launched on 1 July),
the rules for European long-term investment funds (launched on 19 October), and the AIFMD
(launched on 22 October) in 2020.

11
     Recommendation of the European Systemic Risk Board of 7 December 2017 on liquidity and leverage risks in
     investment funds (ESRB/2017/6).

EU Non-bank Financial Intermediation Risk Monitor 2021 No 6 / August 2021
Overview                                                                                                        19
2 Special features
This year, the NBFI Monitor includes three special features on CRE, insurance and three
idiosyncratic events that took place in 2021. These special features provide a deeper dive into
certain topics of relevance for the Monitor. The special feature on CRE assesses liquidity and
leverage risks in investment funds on the basis of vulnerabilities in the CRE market segment due to
the pandemic outbreak. As opposed to the entity-based section on real estate funds, it is forward-
looking. The special feature on insurance looks at the role of insurers in non-bank financial
intermediation, as those institutions were not previously covered by the Monitor. The last special
feature on GameStop, Greensill and Archegos highlights the relevance of these cases for the
monitoring of financial stability and how leverage, concentration and liquidity risks can materialise
and spread through the financial system.
2.1 Commercial real estate – liquidity and leverage risks in
investment funds
The outbreak of the coronavirus crisis in Europe saw a sharp and extended decline in CRE
market activity, with market indicators pointing towards a substantial price correction. There
were 50% fewer transactions in EU CRE markets in the last three quarters of 2020 than in the
same period of 2019 (Chart 5, left panel). The literature shows that this type of drop in transactions
typically precedes price corrections and was also seen at the start of the global financial crisis. 12
Indeed, the share of investors seeing EU markets in a downturn increased from less than 20% to
more than 60% over the course of 2020. 13 The beginning of a correction is also visible in standard
CRE price indices, despite low underlying transaction numbers and the backward-looking
methodologies of these metrics (Chart 5, right panel).
12
Dorinth W. van Dijk, David M. Geltner, Alex M. van de Minne, The Dynamics of Liquidity in Commercial Property Markets:
Revisiting Supply and Demand Indexes in Real Estate, The Journal of Real Estate Finance and Economics, July 2020.
13
According to RICS data, which include BG, CZ, DE, IE, GR, ES, FR, HR, IT, CY, HU, NL, AT, PL, PT and RO.
EU Non-bank Financial Intermediation Risk Monitor 2021 No 6 / August 2021
Special features 20Chart 5
Indicators suggest a substantial price correction may follow the current decline in CRE
activity
(top left: number of transactions; top right: price index, 2005 Q1 = 100)
2018 Prime commercial property (office)
2019 Prime commercial property (retail)
2020 Prime commercial property (total)
EU CRE transaction numbers Aggregate price index developments
2,000 300
1,800
250
1,600
1,400
200
1,200
1,000 150
800
100
600
400
50
200
0 0
Q1 Q2 Q3 Q4 2005 2007 2009 2011 2013 2015 2017 2019 2021
Sources: RCA (left panel) and JLL (right panel).
Notes: Left panel: EU sample includes full EU 27. The data for Q4 2020 are preliminary, and the overall figures may rise once
up-to-date information is available. Right panel: Sample includes BE, CZ, DK, DE, IE, GR, ES, FR, IT, LU, HU, NL, AT, PL, PT,
FI and SE.
Investment funds play an important role in European CRE markets, making them highly
exposed to a COVID-19 price shock and also giving them the capacity to amplify it. Chart 6
shows that, in 2019 and 2020, investment funds acted as buyers for more than 50% of the value of
EU CRE transactions. A comparison with their share as sellers also shows that funds act as net
buyers in this market, together with ICPFs. Funds’ steady market share as buyers since the
outbreak of the crisis suggests that they are currently withdrawing from the market at the same rate
as other investors (Chart 6).
EU Non-bank Financial Intermediation Risk Monitor 2021 No 6 / August 2021
Special features 21Chart 6
Investment funds are important players in European CRE markets: share of EU transactions
by buyer and seller type
(percentage of transaction volume)
Investment fund Insurance and pension fund
Private investor Other
Bank
Share of EU transactions by buyer type Share of EU transactions by seller type
100% 100%
90% 90%
80% 80%
70% 70%
60% 60%
50% 50%
40% 40%
30% 30%
20% 20%
10% 10%
0% 0%
2019 Q2-Q4 2020 2019 Q2-Q4 2020
Source: RCA.
Note: Sample includes full EU 27. The “private investor” category refers to companies whose control is in private hands and
whose business is primarily geared towards operating, developing or investing in CRE.
2.1.1 Vulnerabilities stemming from liquidity mismatches
Liquidity mismatches remain a key vulnerability in the open-end CRE fund sector. 14 At the
end of the fourth quarter of 2020, open-ended CRE funds revealed a liquidity mismatch due to
offering investors shorter redemption periods than portfolio assets could be liquidated (Chart 7, left
panel). The short-term portfolio liquidity (up to a month) was 10 percentage points lower than
investor liquidity. Since 2017, this share has remained largely unchanged. The liquidity mismatch is
more pronounced for funds permitting daily share redemptions by investors, which account for one-
third of CRE funds with any liquidity mismatch. Owing to the economic significance of funds with
daily redemption frequencies, the liquidity mismatch of these funds remains a key vulnerability.
According to ESMA, these funds account for 50% of all CRE funds in Europe 15. Instruments to
mitigate risks stemming from liquidity mismatches are liquidity buffers or LMTs.
The decrease of liquidity buffers to a three-year low in 2020 may have reduced funds’
resilience to large redemptions. Liquidity buffers, consisting of cash and cash equivalents, are
available to funds to meet redemption obligations or to repay existing debt. Since the beginning of
2017, liquidity buffers have steadily decreased to nearly 2.5% of NAV in the fourth quarter of 2020
14
The ESRB defines CRE as any income-producing real estate, which means that all real estate funds fall under the ESRB
definition. AIFMD data are reported under Directive 2011/61/EU on alternative investment fund managers and
corresponding amendments. Charts and analyses on alternative real estate investment funds are based on data provided
by NCAs to ESMA under the AIFMD and shared with the ESRB. The reporting period of the data is the fourth quarter of
2020. For French funds third quarter 2020 data are used due to data unavailability for the fourth quarter of 2020.
15
See “Report: Recommendation of the European Systemic Risk Board (ESRB) on liquidity risk in investment funds”,
ESMA, November 2020
EU Non-bank Financial Intermediation Risk Monitor 2021 No 6 / August 2021
Special features 22(Chart 7, right panel). Declining holdings of cash were observed in almost all countries. In 2020,
funds’ liquidity positions deteriorated, especially during the third quarter when cash was likely used
to meet (the albeit limited) redemption requests. In some cases, real estate funds made use of fund
suspensions and other LMTs directly at the onset of the COVID-19 pandemic, and the ESRB
emphasised the widespread use of LMTs in May 2020. 16 17 However, ESMA notes that LMTs for
funds are not harmonised across Europe and their availability is still limited in some jurisdictions. 18
This poses challenges for the consistent application of such tools.
Chart 7
Liquidity transformation profile (left panel) and liquidity buffers in open-ended commercial
real estate funds (right panel)
Portfolio
Investor
100% 5.0%
Cash and cash equivalent over NAV
90%
80% 4.5%
70%
60% 4.0%
46%
50%
40% 31% 3.5%
45%
30% 23%
19%
16%
20% 11% 31% 3.0%
10%
9% 14%
0% 6% 7% 2.5%
1 day or 2-7 days 8-30 31-90 91-180 181-365 More Q1 Q2 Q3 Q4 Q1 Q2 Q3 Q4 Q1 Q2 Q3 Q4 Q1 Q2 Q3 Q4
less days days days days than 365
2017 2018 2019 2020
days
Sources: AIFMD, CSDB and ESRB calculations.
Notes: Left panel: The graph shows the cumulative distributions of portfolio liquidity and investor liquidity for non-closed-ended
real estate funds. Portfolio liquidity is defined as the percentage of a portfolio capable of being liquidated within the given period.
Investor liquidity is defined by the breakdown of NAV depending on the shortest period within which the invested funds could be
withdrawn, or investors could receive redemption payments. Right panel: The graph shows the real estate fund sector’s average
percentage share of liquidity buffers at the sector’s cumulative NAVs. Liquidity buffers cover cash and cash equivalents,
government bonds with maturity below one year, money market share investments and cash management by collective
investment undertakings.
2.1.2 Vulnerabilities stemming from leverage
Owing to an overall increase in leverage, real estate funds increased their exposure to
property price fluctuations. Leverage, defined as AuM/NAV 19, has increased on average by
2 percentage points to 137% of NAV since the beginning of 2017. 20 This dynamic is mainly driven
by open-ended funds (Chart 8, left panel). While closed-ended funds kept their leverage level
16
See “Report: Recommendation of the European Systemic Risk Board (ESRB) on liquidity risk in investment funds”,
ESMA, November 2020.
17
See “ESMA Annual Statistical Report: EU Alternative Investment Funds 2020”, ESMA, January 2020.
18
See “Report: Recommendation of the European Systemic Risk Board (ESRB) on liquidity risk in investment funds”,
ESMA, November 2020.
19
The ratio serves as a proxy for leverage from an economic perspective. It is closely related to gross leverage, which is
defined as the gross exposures excluding cash in the currency of the AIF, divided by the NAV.
20
This is different than the figure reported in Section 3.1.3 due to the use of different sources of data (AIFMD and Statistical
Data Warehouse).
EU Non-bank Financial Intermediation Risk Monitor 2021 No 6 / August 2021
Special features 23constant on average over time, open-ended funds increased leverage by 3 percentage points to
137% in the fourth quarter of 2020. Open-ended funds still apply leverage to a smaller degree than
closed-ended funds. However, in contrast to closed-end funds, these funds are additionally
exposed to risks associated with liquidity transformation, which may increase their vulnerabilities. 21
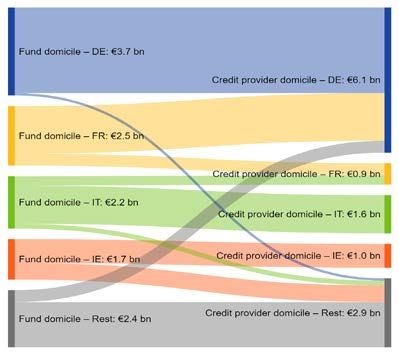
Higher leverage increases funds’ interconnectedness with the rest of the financial system,
as it provides an indirect contagion channel between funds and their credit providers. At the
end of the fourth quarter of 2020, real estate funds borrowed €67 billion (10.2 % of NAV).
Counterparty information is reported by funds for the five largest sources of borrowings, which
amount to €12.5 billion (19% of all borrowings). Credit institutions are by far the largest credit
providers (81%), followed by financial auxiliaries (17.5%). In most countries, credit is provided by
locally domiciled intermediaries (Chart 8, right panel). This implies that parts of any spillover effects
through credit provisioning during a CRE market downturn would occur between funds, banks and
financial auxiliaries within the same jurisdiction. Significant cross-border linkages exist for French
and Irish funds. 22
Chart 8
Leverage of open-end and closed-end funds (left panel) and credit provision by jurisdiction
(right panel)
(left panel: left-hand scale: closed=end funds; right-hand scale: open-end funds; percentages)
Closed-end funds
Open-end funds
160% 141%
139%
155%
137%
135%
150%
133%
131%
145%
129%
140% 127%
Q1 Q2 Q3 Q4 Q1 Q2 Q3 Q4 Q1 Q2 Q3 Q4 Q1 Q2 Q3 Q4
2017 2018 2019 2020
Sources: AIFMD, CSDB and ESRB calculations.
Notes: Left panel: The blue line shows the weighted average leverage (AuM/NAV) of closed-end funds. The yellow line shows
the weighted leverage of open-end funds. Leverage is weighted by funds’ AuM. Right panel: Percentage of AuM for non-closed-
end funds. This group includes open-end funds and funds of unspecified type. The graph shows the credit line linkages for real
estate funds between the funds’ domiciles (left layer) and the legal jurisdictions of credit providers (right layer). Rest subsumes
all other countries to achieve data confidentiality.
21
Compare also the Central Bank of Ireland’s Financial Stability Review 2020:1.
22
This pattern remains unchanged if one considers the parent company jurisdiction of the funds’ direct credit providers.
EU Non-bank Financial Intermediation Risk Monitor 2021 No 6 / August 2021
Special features 24You can also read