WP/20/157 - International Monetary Fund
←
→
Page content transcription
If your browser does not render page correctly, please read the page content below
WP/20/157

   Financial Inclusion: What Have We Learned So Far?
                          What Do We Have to Learn?

       by Adolfo Barajas, Thorsten Beck, Mohamed Belhaj, and Sami Ben Naceur

IMF Working Papers describe research in progress by the author(s) and are published
to elicit comments and to encourage debate. The views expressed in IMF Working Papers
are those of the author(s) and do not necessarily represent the views of the IMF, its
Executive Board, or IMF management.
© 2020 International Monetary Fund                                                            WP/20/157

                                        IMF Working Paper

        Institute for Capacity Development and Monetary and Capital Markets Department

     Financial Inclusion: What Have We Learned So Far? What Do We Have to Learn?

    Prepared by Adolfo Barajas, Thorsten Beck, Mohamed Belhaj, and Sami Ben Naceur 1                    0F

             Authorized for distribution by Valerie Cerra and Mahvash Saeed Qureshi

                                             August 2020

    IMF Working Papers describe research in progress by the author(s) and are published to
    elicit comments and to encourage debate. The views expressed in IMF Working Papers are
    those of the author(s) and do not necessarily represent the views of the IMF, its Executive Board,
    or IMF management.

                                               Abstract

The past two decades have seen a rapid increase in interest in financial inclusion, both from
policymakers and researchers. This paper surveys the main findings from the literature,
documenting the trends over time and gaps that have arisen across regions, income levels,
and gender, among others. It points out that structural, as well as policy-related, factors, such
as encouraging banking competition or channeling government payments through bank
accounts, play an important role, and describes the potential macro and microeconomic
benefits that can be derived from greater financial inclusion. It argues that policy should aim
to identify and reduce frictions holding back financial inclusion, rather than targeting specific
levels of inclusion. Finally, it suggests areas for future research.

JEL Classification Numbers: G2; G3; O16

Keywords: Financial Inclusion, Financial Development, Fintech, Economic Growth, Income
Inequality, Financial Frictions

Authors’ E-Mail Addresses: ABarajas@imf.org, Thorsten.Beck.1@city.ac.uk,
MBelhaj@imf.org, SBenNaceur@imf.org

1
 The authors thank Valerie Cerra, Barry Eichengreen, Mahvash Saeed Qureshi, Majid Bazarbash, Aidyn
Bibolov, Héctor Cárcel Villanova, Esha Chhabra, Nicolas End, Yingjie Fan, Purva Khera, Elena Loukoianova,
Ken Miyajima, Sumiko Ogawa, Andrea Presbitero, Kevin Wang Wagner, and seminar attendees at the Institute
for Capacity Development for valuable comments on earlier versions of this paper.
3

                                                                 Contents                                                                  Page
Abstract .........................................................................................................................................2
    I. INTRODUCTION ................................................................................................................5
    II. WHAT IS FINANCIAL INCLUSION? ............................................................................5
               A. Signs of Improvement, With Some Recent Challenges ............................................6
               B. Structural Conditions and the Financial Possibilities Frontier ..................................8
               C. How to Interpret “Gaps” in Financial Inclusion......................................................10
    III. WHY DOES FINANCIAL INCLUSION MATTER? .................................................12
               A. Financial inclusion as a dimension of broad financial development ......................13
               B. Some Suggestive Results for Financial Inclusion at the Macro Level ....................14
               C. Possible Tradeoffs Between Financial Inclusion and Financial Stability ...............15
               D. Channels through which financial inclusion can affect key economic outcomes...16
               E. Financial Frictions, Microfinance, and Poverty Traps ............................................19
               F. Benefits from Payments Services ............................................................................20
    IV. FINANCIAL INCLUSION OF HOUSEHOLDS .........................................................21
               A. How and Why is Financial Inclusion Important for Households? ..........................21
               B. What is the State of Household Financial Inclusion Around the World? ...............22
               C. Policies to Enhance Households’ Financial Inclusion ............................................23
               D. A Primer on Financial Education and Capability ...................................................26
    V. MSME FINANCIAL INCLUSION .................................................................................28
               A. What sets MSMEs apart? ........................................................................................29
               B. Benefits and Costs of MSME Financial Inclusion ..................................................29
               C. Public Policies to Foster MSME Financial Inclusion .............................................31
               D. The Role of Competition and the Private Sector ....................................................32
               E. The Role of Key Regional and International Organizations ...................................34
    VI. CONCLUSION ................................................................................................................34

    Figures
    1: Household Financial Inclusion ............................................................................................44
    2. Mobile Money and Accounts in Financial Institutions ........................................................44
    3. Financial Inclusion and Real GDP Per Capita—Cross-Country Correlation ......................45
    4. Stylized Financial Possibility Frontier .................................................................................45
    5. Mobile Money and Financial ............................................................................................46
    6: Financial Inclusion Observed Levels Compared to Structural Benchmarks .......................47
    7. Financial Inclusion and Financial Depth .............................................................................47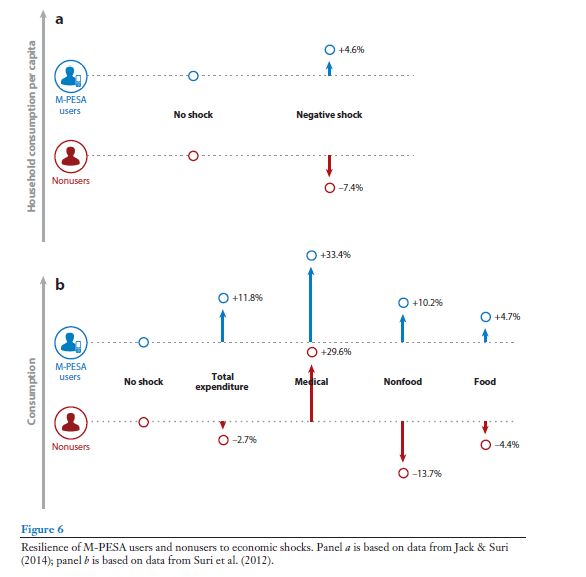
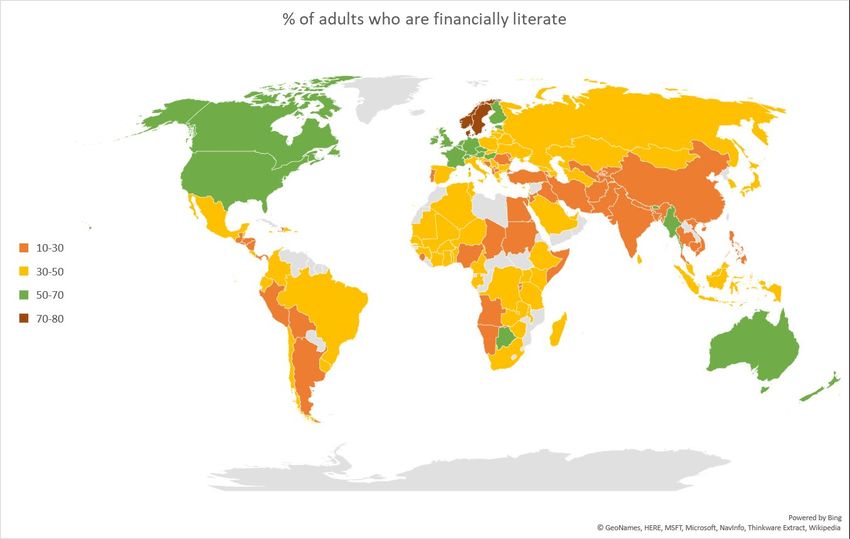
4 8. Estimated Impact of Increases in Financial Inclusion and Financial Depth on ...................48 9. Finance and Occupational Choice in the DNJTU (2015) Model .........................................48 10. Simulated Effect of Reducing the Financial Inclusion Friction () ..................................49 11. Risk Sharing through M-Pesa (Mobile Money) in Kenya .................................................49 12. Reported Reasons for Not Having a Bank Account ..........................................................50 13. Nearly Half of All Unbanked Live in Just Seven Countries ..............................................50 14. Financial Literacy Around the World ................................................................................51
5

I. INTRODUCTION

Financial inclusion has received increasing attention from both researchers and policymakers
in the past two decades as a potential source of benefits to the economy. On the research side,
study of financial inclusion is partly a logical next step from the literature originating in the
early 1990s, which uncovered positive micro and macroeconomic impacts from more
efficient financial service provision in general. 2 For example, the broad process of financial
                                                                    1F

development has been shown to promote economic growth at the national, industry, and firm
levels, as well as to enhance productivity growth and capital accumulation. It has also been
shown to reduce income inequality and is strongly associated with poverty alleviation. As
this chapter will discuss, financial inclusion can be thought of as an aspect of financial
development, and therefore potentially is associated with many of the benefits that are
derived from this process.

As a result, policymakers have taken notice and action as well. According to the World
Bank’s 2014 Global Financial Development Report, about 50 countries had adopted explicit
policies to boost financial inclusion. In its analysis of policy frameworks in 55 emerging
market economies, the Economist Intelligence Unit’s Global Microscope reported that about
two-thirds of these countries had explicit national financial inclusion strategies in 2014. By
2019, all but one of the analyzed countries had them.

The purpose of this paper is to give an overview of the trends and drivers of financial
inclusion that incorporates the main findings from the research conducted to date, including
the key insights that can be of use to policymakers seeking to design strategies that will help
to promote financial inclusion to its greatest advantage for the economy. Section II provides
a working definition of financial inclusion that has proved useful for empirical work, takes
stock of orders of magnitude and recent trends in the data, and introduces concepts that help
to ascertain when there is an economically meaningful gap in financial inclusion. Section III
reviews the main findings of theoretical and empirical research on the impacts of financial
inclusion. Sections IV and V zero in on two major areas in which financial inclusion is of
particular relevance: households’ access and use of financial services, and the financing of
micro, small, and medium-sized enterprises (MSMEs). Section VI concludes and identifies
directions for future research.

II. WHAT IS FINANCIAL INCLUSION?
There are many possible ways in which financial inclusion has been defined, each of which
touches to some degree on one of several aspects: access of the population to financial
services, the degree of use of these services, and their quality and cost. When searching for a
workable definition that can be measured relatively consistently in a broad group of
countries, the World Bank’s 2014 Global Financial Development Report opted for the
following: the proportion of individuals and firms that use financial services. Of course, the
different aspects are interrelated. For example, banking services will be used more
extensively by the population the greater the ease of access—availability of ATMs or
branches—the lower the cost, and the greater the quality of services. Consequently, measures

2
    See for example, Levine (2005); Beck, Demirgüç-Kunt, and Levine (2007), and Beck Levine and Loayza, (2000).
6
of use are likely to reflect access, cost and quality, and vice versa. To the extent that more
detailed data on specific aspects of financial inclusion are available either within or across
countries, the definition can be broadened to incorporate access, quality, and cost dimensions
as well.
A. Signs of Improvement, with Some Recent Challenges
By most measures, financial inclusion has increased during the past decade. One prominent
data source for measuring financial inclusion is the World Bank’s Global Findex, a survey of
about 150,000 households across 140 countries, covering account holdings, credit and
savings activities, and whether wages or government transfers are paid directly into accounts.
The Findex survey was first conducted in 2011, and has been conducted every three years
since. One of its most often cited indicators, the percentage of adult population holding a
bank account, 3 has experienced an impressive increase from a worldwide average of 51
2F
percent in 2011 to 69 percent in 2017, its most recent observation (Figure 1). 4 However, this 3F
still leaves an estimated 1.7 billion adults worldwide without an account, in other words,
unbanked. Also, borrowing activities by households from formal financial institutions have
not matched the same pace of inclusion, registering a much milder increase, from 9 to 11
percent if credit card use is excluded, and from 22 to 23 percent if it is included.
The data reveal other salient features, among them, sizable differences across regions and
income levels. First, a key component of the increase in financial inclusion has been the
result of a fintech innovation, the adoption of mobile money accounts, mostly in Sub-Saharan
Africa, and to a lesser degree in South Asia. In Sub-Saharan Africa, over one-fifth of the adult
population now uses mobile money accounts, compared to 4 percent worldwide. While one
might expect a strong negative correlation between the proliferation of mobile money and the
use of conventional bank accounts, as the former substitutes for the latter, Figure 2 shows
that this is generally not the case. Kenya, the country with the highest mobile money
penetration, at 73 percent, does contrast visibly with Singapore, a country with much greater
account holding and only 10 percent of adults with mobile money accounts. However,
Namibia also has high mobile money penetration (43 percent) together with above-average
account holding, while Chad has little presence of either. Finally, a large number of countries
with widely varying levels of account holding have very little presence of mobile money. 5 4F
Second, as one might expect, levels of both account holding and borrowing are markedly
higher in richer countries. For example, on average, account holding exceeds 90 percent in
high income countries, compared to 70 percent in the emerging and developing regions with
the highest levels, East Asia and Pacific and South Asia. Differences in the use of bank
borrowing are even more pronounced; 55 percent in high income countries compared to 24
percent in Europe and central Asia. Finally, it is notable that, across all regions and income
levels, borrowing activity is much less widespread than account holding; even in rich
3
Account holding refers specifically to whether the respondents reported having an account (by themselves or together with someone else)
at a bank or another type of financial institution or report personally using a mobile money service in the past twelve months.
4
Similar upward trends can be observed in financial inclusion indicators for firms (from the World Bank Enterprise Surveys) and from the
percentage of the adult population who are depositors or borrowers from banking institutions (from the IMF Financial Access Survey).
5
Based on supplier-side data from the IMF’s Financial Access Survey, Espinosa-Vega and others (2020) find that mobile money
penetration is negatively correlated with measures of access to traditional banking services, such as the number of ATMs per 100,000
adults. They also find a positive correlation with a broad index of enabling regulatory environment for mobile money.7 countries, an adult is over four times as likely to have an account than to borrow from a formal financial institution. This brief look at the Global Findex data reveals different dimensions of the use of financial services by households: account holding, borrowing, and mobile money. This paper will also review other data sources related to firms’ use of financial services, as well indicators of access. It is important to note that, at this point, the different dimensions are not being compared against each other, for example, by judging whether borrowing or account holding matters more for assessing overall financial inclusion. As the paper will show, much of the empirical literature examining the determinants or impacts of financial inclusion takes this approach, by focusing on individual dimensions and in a microeconomic setting. However, other studies have taken multi-dimensional approach, creating composite indicators of financial inclusion from different sources and weighing each dimension by its statistical contribution to the total variation of the composite. The first to take this approach was Svirydzenka (2016), who used a principal components methodology to construct a composite indicator of financial development (FD), a sub-component of which was itself a composite indicator of financial access (FA), combining aspects of household and firm access to services provided by financial institutions (FIA) and markets (FMA). Blancher and others (2019) used a similar procedure to construct a composite measure for small and medium SMEs, and Loukoianova and Yang (2018) constructed composite indices based on individual indicators from the IMF’s Financial Access Survey of financial institutions (FAS). Sahay and others (2020) constructed indices of access to and usage of digital as well as traditional financial inclusion. All of these studies have used their measures in regressions aimed at assessing the macroeconomic impact of financial inclusion. Recent developments surrounding the COVID-19 crisis present challenges, but also opportunities for financial inclusion going forward. First, the severe setbacks suffered by the real economy, both directly from the virus and as a result of the lockdowns and social distancing measures introduced, have weakened a wide spectrum of borrowers’ ability to repay and, consequently pose challenges for the survival of many financial institutions. There are indications that these pressures have been particularly great for non-bank institutions such as microfinance lenders, who have experienced recent collapses in repayment rates, 6 thus 5F generating great uncertainty about their viability going forward. This has the potential to leave a large number of SMEs without access to finance. Fintech startups have been similarly affected, with venture capital and investors forced to withdraw funding. 7 On the positive 6F side, the need for rapid deployment of government transfers to households and firms has made more urgent the transition away from cash and into bank accounts and digital payments. As cash transactions can be a medium of transmission of COVID-19, there are also indications that individuals are accelerating their shift away from cash transactions, with potential benefits for financial inclusion down the road. The recent expansion of mobile money 6 See, for example, https://www.economist.com/finance-and-economics/2020/05/05/for-microfinance-lenders-covid-19-is-an-existential- threat. 7 Zachariadis, Ozcan, and Dinckol (2020).
8

accounts in many developing countries allows for easier risk sharing among families and
friends, 8 and an easier push-out of government support programs through mobile money
               7F

networks, as the example of Togo has shown. 9                         8F

B. Structural Conditions and the Financial Possibilities Frontier
To some extent, the differences observed across countries, regions, and income levels are due
to structural conditions in the economy. If one considers that extending financial services to a
wide swath of the population entails certain costs, and that these costs are likely to exhibit
economies of scale, then it stands to reason that financial inclusion will be naturally higher in
countries in which structural conditions are such that the per-person costs of providing
financial services are lower.

One major structural condition is the income level; banks and other financial institutions will
find it more cost-effective to provide services to higher-income potential customers, and
therefore higher-income countries should be expected to have higher levels of financial
inclusion, as reflected in the income group comparisons in Figure 1. More broadly, there is a
positive association 10 between a country’s income per capita and different measures of
                              9F

financial inclusion, as illustrated in Figure 3, which shows a selection of financial inclusion
indicators, from three sources. The first, of account holding and borrowing by individuals,
obtained from the Global Findex database and reported in Figure 1, has the highest
correlation with income per capita, with a coefficient of over 0.70. The second type of
indicator is focused on firms and is obtained from the World Bank’s Enterprise Surveys
(WBES). Two indicators are shown: the percentage of firms that reported using bank credit
and the percentage not identifying lack of finance as a major obstacle to their business. The
third type of indicator involves supply-side information from the IMF’s Financial Access
Survey (FAS), which collects data on access to and use of financial services across the
globe. 11 The number of borrowers per 1,000 adults, and the extension of financial
         10F

infrastructure—branches and ATMs—to the population, both of which are also shown to be
positively correlated with income.

In addition to the level of income, other structural conditions would include the size of the
population and its density, as well as demographic factors, such as young and old age
dependency ratios, all of which are likely to influence the cost effectiveness of providing
financial services to the population.

8
  Section II.F reviews evidence of how mobile money can enhance risk sharing.
9
  See https://novissi.gouv.tg/en/home-new-en/
10
   It should be mentioned that the relationship between financial inclusion and income is likely to contain causality in both directions. Just
as in the finance-growth literature surveyed by Levine (2005), care should be taken to account for reverse causality when estimating
regressions that are meant to capture causal relationships.
11
   Espinosa-Vega and others (2020) provide a ten-year retrospective of the FAS. They show trends in the data, documenting how financial
inclusion has expanded over the past decade in different regions, and by different modalities (for example, bank branches vs mobile and
internet banking) and income levels, as well as identifying major gaps that persist, for example, between income level, size of firms, or by
gender.
9
The relationship between structural conditions of an economy and its level of financial
inclusion can be represented graphically, as in Figure 4. 12 A country’s structural conditions
11F
are shown along the horizontal axis, the more conducive to financial inclusion, the further to
the right. For example, a relatively rich country with a large and densely distributed
population, Country A, is compared to a poor country with a small and disperse population,
Country B. Thus, the structural conditions in A are more conducive to financial inclusion than
in B (SCA > SCB), and therefore B would be expected to have greater financial inclusion. This
is represented by the structural benchmark (SB) line, showing the expected levels of financial
inclusion for each level of structural conditions. A country’s actual level of financial
inclusion can differ from its structural benchmark due to non-structural factors, such as its
policies. For example, A lies under the SB line, therefore it underperforms its structural
benchmark (it has a positive financial inclusion gap), possibly as a result of policies have
hindered or failed to facilitate financial inclusion—say, an excessive reliance on state-owned
banks, or an inability to provide macroeconomic stability 13— relative to other countries with
12F
similar structural characteristics. On the other hand, B overperforms its benchmark (negative
gap), possibly due to successful pro-financial inclusion policies, such as facilitating greater
banking competition or reducing barriers for individuals to open accounts.
An optimal level of financial inclusion would be obtained when polices succeed in extending
financial services to a broad segment of the population, and have done so in an efficient and
sustainable manner. This level is given by the second line, the Financial Possibilities
Frontier (FPF). Thus, B still has room to improve its policies to reach the FPF. Finally, there
may also be a situation in which financial inclusion becomes excessive. 14 A third country, C, 13F
may have experienced an expansion in financial inclusion beyond the frontier, but this level
is neither desirable nor sustainable in the long run. Episodes such as the U.S. subprime crisis
come to mind, where mortgages were extended to an ever-wider pool of borrowers that
became increasingly risky, with little capacity to repay. Thus, one could say that financial
inclusion in the U.S. mortgage market had become excessive prior to the crisis. 15 14F
Note that innovation can reduce the costs of providing financial services, effectively shifting
upward the SB line, and potentially the FPF as well. The rapid proliferation of mobile money
in some countries is evidence of this. Figure 5 shows two measures of account holding by
individuals in 2017, one excluding mobile money and one including it, and plots them
against the country’s GDP per capita. Both indicators display the expected positive
relationship with GDP per capita, but once mobile money is included, the position of some
countries changes markedly. While high-income countries are relatively unaffected, as they
approach universality in account holding, several low-income countries where mobile money
has taken hold—a selection of which is displayed as red points in the figure—shift upward
12
Adapted from Barajas, Beck, Dabla-Norris, and Yousefi (2013). Note that a similar analysis can be carried out for other dimensions of
financial development, such as financial depth. Many of the ideas underlying this analysis were also discussed in Beck and de la Torre
(2007).
13
Sections IV and V review the lessons drawn from the empirical literature assessing which policies are associated with greater financial
inclusion of households and small and medium-sized enterprises.
14
The concept of excessive financial inclusion is related to the “too much finance” phenomenon, which has been applied to aggregate
private sector credit extended by the banking system. Arcand, Berkes and Panizza (2015) show that, beyond a certain level, this credit
ceases to have a positive impact on economic growth, and may even become detrimental.
15
The graphical representation of Figure 4 is highly stylized; the relationship between structural conditions and financial inclusion, as well
as the FPF, need not be linear, and the position of both lines would necessarily shift according to the indicator being represented. For
example, the degree of account holding will tend to approach universality as structural conditions become more conducive to inclusion,
whereas both lines will be well below 100 percent in the case of use of bank credit.10 noticeably. For example, after including mobile money, Uganda and Zimbabwe exhibit levels of account holding markedly greater than the level predicted by their income, and Kenya, at over 80 percent, approaches the level of countries with many times its income per capita. Using the World Bank’s Finstats platform, observed levels of a wide range of indicators of financial development can be compared easily to benchmarks based on structural characteristics. As described in detail in Feyen, Kibuuka, and Sourrouille (2019), the benchmarking exercise consists of two steps. First, quantile regressions are run for each of 46 indicators of financial depth, inclusion, or performance on a set of structural explanatory variables reflecting income level, demographics, and special circumstances. 16 Then the 15F predicted median from this regression provides the structural benchmark against which the indicator in a given country at a given time can be compared. If the observed value of the indicator is above (below) the structural benchmark, one can say that the country is overperforming (underperforming) relative to what is typical for countries of similar structural conditions. 17 16F Figure 6 illustrates the comparison for two emerging economies (India and Colombia) and two indicators, the percentage of account holding and the percentage of firms with a loan or line of credit with a formal financial institution. India, as a result of a massive government effort in recent years, managed to increase the percentage of account holders from 35 to 80 percent between 2011 and 2017, well surpassing its structural benchmark of 40 percent. However, firms’ use of bank credit, at 21 percent in 2014, is well below the 35 percent level predicted by India’s structural conditions. Colombia presents a contrasting case, with account holding underperforming its structural benchmark in 2017 while credit to firms appears to overperform. 18 17F C. How to Interpret “Gaps” in Financial Inclusion So far, the discussion has been entirely descriptive; the paper has shown that, across several measures, countries can differ quite dramatically in their levels of financial inclusion, and that such differences are due in part to structural differences that may facilitate or hinder financial inclusion. Data on financial inclusion reveals various gaps: for example, between rich and poor countries, between partial and universal inclusion (particularly in the case of account holding), and between the observed levels and the structural benchmarks for a given country at a specific time. How should one interpret these gaps? Does the existence of a gap necessarily signal that there is a shortfall or deficiency that policymakers must aim to close? In other words, is more financial inclusion necessarily better? The simple answer is no, more financial inclusion is not necessarily better, and not all gaps need to be eliminated. In terms 16 The full set of structural variables includes economic development (GDP per capita and its square); population factors (total population and its density); demographic factors (young and old age dependency ratios); “special circumstances” (dummies for oil exporters, offshore financial centers, transition countries, and landlocked countries); and the global cycle (time fixed effects). 17 The Finstats database created by Feyen, Kibuuka, and Sourrouille (2019) provides observed values as well as estimated structural benchmarks for the 46 indicators. Using the Finstats Dashboard, graphical comparisons between observed levels and benchmarks, such as those shown in Figure 5, can be generated very easily. 18 Note that, although the structural benchmarking regressions control for the global cycle, an individual country may seem to over- or underperform due to its own cyclical factors.
11

of the FPF framework, there are strong reasons why the level of financial inclusion of a
Country C may be excessive or not desirable from a macroeconomic point of view. These
reasons are discussed below.

First, not all firms and households need all financial services. Consider that the Global
Findex reveals that some financial exclusion is voluntary, that is, some individuals choose
not to use financial services. For example, in Lithuania, a high-income country with a
relatively high level of financial inclusion, while 83 percent of adults reported having a bank
account in 2017, 8 percent stated that they did not have a bank account because they had
access through another family member, and another 3 percent felt they had no need for
financial services. An additional 1 percent cited religious reasons, a response that tends to be
particularly high in countries with large Islamic populations. 19 Regarding Lithuanian firms, in
                                                                                            18F

the Enterprise Survey in 2013 about 33 reported having a bank loan or line of credit—very
close to the global average—while 54 percent responded that they had not applied for bank
credit because they had no need for it. 20 There may be a case for policy to affect voluntary
                                                          19F

exclusion, for example by encouraging financial education so that individuals may better
understand the potential benefits of using financial services, or by providing financial
services that are more compatible with individuals’ religious beliefs. But there is an open
question as to the cost effectiveness of these types of policies, 21 and it may be true that some 20F

individuals or firms simply do not need financial services.

As for involuntary exclusion, there is a strong case against policymakers attempting to drive
it to zero in all cases, for two main reasons: risks and costs. In the credit market, some
borrowers may be too risky. As this market is characterized by having information
asymmetries—lenders (banks) do not have perfect information on potential borrowers’
riskiness—a situation emerges which was first described by Stiglitz and Weiss (1981). Banks
will voluntarily choose to limit the interest rate charged on loans and ration borrowers out of
the market, even some who would be willing to pay a higher rate. As a result of adverse
selection, the lender knows that increasing the lending rate will only increase the riskiness of
borrowers, thereby reducing her profits from lending. Thus, there will be an optimal
maximum interest rate at which she will be willing to lend, even if it leaves some demand
unsatisfied. A key point is that this an equilibrium or rational outcome arising from the
conditions that lenders face. Thus, lack of inclusion in this case does not necessarily warrant
a policy action to close the gap. In fact, it would be detrimental to society to include
borrowers that are too risky.

Costs are also relevant. Related to the discussion of the financial possibilities frontier, some
individuals or firms might be excluded due to the high costs of providing services to them.
Focusing on the credit market, if transaction costs are large, lenders would need to charge a
higher rate to cover them, and the quantity of credit in the economy would be small, as there
19
   For example, religious reasons were cited as the reason for not having in account in 12 percent of respondents in West Bank and
Gaza, Pakistan, and Tajikistan, 10 percent in the Philippines and Tunisia, and 7 percent in Turkey.
20
   One possible reason for the reported lack of need for domestic bank loans in Lithuania is the direct support offered by the EU to SMEs
through the Lithuanian Operational Program.
21
   Section IV discusses financial education and capability in greater detail. Fernandes and others (2014) and Miller and others (2014)
conduct meta analyses of studies of financial education programs and find that there is limited effectiveness in changing financial
behaviors of individuals, for example, the likelihood of saving or planning for retirement. Note that these studies generally do not address
cost considerations.
12 would be fewer potential borrowers with projects whose return is high enough. Furthermore, also excluded are individuals with demand for very small loans, since providing these loans has an important fixed cost component. Inclusion will then have spatial or geographic characteristics driven by costs, as some remote areas will not have a branch, for example, because the fixed cost cannot be covered by the low demand. That said, innovation can change the landscape of financial inclusion dramatically by reducing the fixed costs needed to provide some financial services. The examples cited of low-income countries recently boosting account holding through mobile money reflect this fact quite clearly, and it is becoming clear that some financial services, such as basic transactions and payments, can approach universality without undue costs or risks. The structural benchmark-FPF framework can serve as a useful guide to policymakers to assess a country’s financial inclusion, providing a first pass comparison with peer countries. Evidence of underperformance with respect to the structural benchmark would suggest exploring the types of policies that have been successful in the overperforming peer countries. For example, Indian firms’ use of credit—21 percent compared with the structural benchmark of 35 percent— should suggest an examination of policies in the peer countries. However, beyond the structural benchmark, the exact optimal level of financial inclusion— the FPF—is not known in practice. Therefore, while 35 percent could serve as an initial target, it is much more challenging to determine an optimal or appropriate long-term target. One major takeaway from the theoretical and empirical literature is that, rather than to target financial inclusion directly, policy should therefore focus its attention on involuntary exclusion driven primarily by frictions in the markets, and should aim to enact policies that reduce these frictions. One such friction is imperfect or incomplete information, as highlighted in the credit market example above. To the extent that it is both possible and cost-effective, a policy that helps to improve information on prospective borrowers—setting up a credit registry, for example—can help expand access to credit safely. Other common frictions include weak contract enforcement and property rights, and lack of competition. De la Torre, Gozzi, and Schmukler (2017) offer a useful criterion for assessing whether lack of access to finance constitutes an economically meaningful problem: “…when an investment project that would be internally financed by the agent (that is, the firm or an individual) if she had the required resources does not get external funding…” In other words, as a result of credit market frictions, a wedge arises between the return required by the lender (external) and that required internally by the borrower, potentially excluding otherwise worthy borrowers. Relatedly, one recent study by Claessens and Rojas-Suárez (2020) offers another useful framework for diagnosing financial inclusion problems and then focusing on policy action. Focusing on digital financial services, it proposes a “decision tree” approach that uses country-specific information as well as cross-country benchmarks of indicators to determine which constraints are likely to be most binding for a particular country and, consequently, where policy should direct its interventions. III. WHY DOES FINANCIAL INCLUSION MATTER? Implicit in the discussion up to now is that financial inclusion matters, that is, that it has a
13

potentially beneficial impact on the economy. However, determining what happens in the
economy when more individuals and firms have access to and use financial services is not
trivial, and much research activity has been directed at answering this question, both in
theoretical and empirical work, and both at the micro and macroeconomic levels. This
section will take stock of the main findings to date, focusing on a selection of studies that
provide a useful overview of the main effects of financial inclusion on economic outcomes,
and critically, the channels through which these effects come about.

A. Financial Inclusion as a Dimension of Broad Financial Development
Critical to understanding why and how financial inclusion matters is to recognize that
finance, or financial development, matters. As reviewed by Levine (2005), finance has a
positive impact on the economy through the critical functions it undertakes: (i) to produce
information; (ii) allocate capital to productive uses; (iii) monitor investments and exert
corporate control; (iv) mobilize and pool savings; (v) facilitate trading, diversification, and
management of risk; and (vi) ease exchange of goods and services. Note that these functions
can be carried out not only by banks and other financial institutions, but also by financial
markets, such as those for bonds or equity. Theoretical research has uncovered linkages
between these functions and a variety of positive economic outcomes, such as higher
economic growth and productivity. Thus, one can define a country’s level of financial
development as the extent to which the functions above are being carried out.

Empirical research has sought to provide evidence of these positive linkages, and therefore
has relied on indicators that measure, at least approximately, the level of financial
development. Until recently, the types of indicators used by this research have reflected
mostly the size or scale of financial activity: for banking, the ratio of credit to the private
sector to GDP, and for markets, the ratio of stock market capitalization or volume of
transactions per year to GDP. These measures are termed indicators of financial depth, and
are certainly related to financial development. For example, a country in which private credit
and/or the volume of stock market transactions is very small clearly cannot be mobilizing a
significant amount of savings, nor allocating capital, producing information about borrowers
or issuers, or offering risk management tools for firms and individuals. Indeed, Levine
(2005), and more recently, Popov (2018), review evidence from cross-country panel
regressions showing that both financial depth measures are positively and significantly
related to higher rates of long run economic growth, capital accumulation, and productivity,
and that these relationships are likely to be causal, that greater depth leads to these better
outcomes. However, more recent research has uncovered evidence supporting a “too much
finance” hypothesis, whereby the relationship between growth and financial depth tends to be
hump-shaped rather than unambiguously increasing, and thus weakens at very high levels of
financial depth. 22   21F

Work by Rajan and Zingales (1998) takes the finance-growth analysis one step further, to

22
   Arcand, Berkes, and Panizza (2015) find that the positive link between depth in banking and growth is not unlimited, and at
sufficiently high levels of depth—private credit to GDP exceeding 100 percent—the growth benefits begin to wane and may even
become negative. Relatedly, Cecchetti and Kharroubi (2015) show that rapid growth of the banking sector can also have a negative
impact on productivity. Rousseau and Wachtel (2017) show that the incidence of financial crises weakens the finance growth
relationship as well.
14

investigate a possible channel through which finance affects growth. They find that greater
financial depth allows a country to ease the financing constraints of those sectors that
naturally depend more heavily on external financing as opposed to their own funds.
Therefore, through this mechanism the financially dependent sectors may grow faster in
countries with greater financial activity. Furthermore, Beck, Demirgüç-Kunt, and Levine
(2007) present evidence that financial depth is also associated with other beneficial
outcomes: lower income inequality and a smaller percentage of the population living in
poverty, and Zhang and Ben Naceur (2019) confirm these positive outcomes from
improvements in several indicators in addition to depth measures: greater stock market
turnover, lower interest margins, and higher regulatory capital ratios of banks, although they
also find that financial liberalization may have adverse effects on income equality and
poverty.

Financial inclusion constitutes an additional dimension of financial development. Financial
depth indicators, such as private credit to GDP, are imperfect and incomplete proxies for
financial development. It is possible for two countries to have identical levels of banking
depth, but with one country allocating the same volume of credit to a handful of large,
protected firms, while a second one distributes the funds more broadly across a wide range of
firms and individuals. The critical financial functions—allocating capital, producing
information, exerting corporate control—may be carried out more effectively in the second
country. So greater financial inclusion is related to greater financial development, controlling
for the level of financial depth, and may provide additional benefits.

Of course, financial inclusion should be associated to some degree with financial depth;
generally, if a country mobilizes a large amount of funds, it is more likely to provide services
to a large percentage of individuals and firms. However, this correlation is not perfect, as
Figure 7 shows. Three financial inclusion measures are displayed together with the ratio of
credit by banks and other financial institutions to GDP: the percentage of individuals with
bank loans, the percentage of firms with a bank loan or line of credit, and the coverage of
ATMs throughout the population. Several pairs of countries are highlighted in red to show
that, although financial inclusion does tend to be greater in countries with greater banking
depth, countries with similar depth can diverge quite dramatically in terms of financial
inclusion. For example, in Bosnia and Herzegovina and Israel, banks and other financial
institutions provide credit equal to about sixty percent of GDP, yet in Israel in 2017 an
individual was more than three times as likely to borrow from a formal financial institution
than in Bosnia and Herzegovina. This suggests that financial development is more advanced
in Israel than in Bosnia and Herzegovina, and that financial depth alone might be
understating the possible benefits accruing from financial activity in Israel. One can also
make similar comparisons between pairs of countries sharing the same level of depth but
differing quite strikingly in the use of credit by firms, or in the availability of ATMs, as
Figure 6 shows.

B. Some Suggestive Results for Financial Inclusion at the Macro Level
Viewed as a dimension of financial development, or as an additional piece of information
useful in assessing a country’s level of financial development, it follows that financial
inclusion should have a measurable impact on macroeconomic outcomes such as long-term
15

growth, enhancing income equality, or reducing poverty. A small but growing literature
examines the possible empirical links between financial inclusion and these outcomes,
analogous to the previous body of work focusing on the macroeconomic implications of
financial depth.
Regarding the link with economic growth, the logical step would be to re-estimate the
standard growth regressions using financial inclusion indicators in place of, or in addition to,
financial depth measures. However, a main obstacle has been the lack of time observations;
at most, the IMF FAS offers annual observations since 2004, the Findex has only three
observations per country over 2011-2017, and the WBES also offer limited time
observations which, in addition, are non-synchronous from country to country.
Facing these limitations, Sahay and others (2015) use several FAS indicators as well as the
Svirydzenka (2016) composite indicators and interact them with the private sector credit-
GDP ratio. Their results suggest that financial inclusion does have a measurable impact on
10-year growth, above and beyond that of financial depth. 23 As Figure 8 illustrates, the
                                                                       22F

impact of depth on growth increases with the level of financial inclusion, measured by ATM
coverage or the percentage of firms not considering lack of finance to be a significant
obstacle. That is, Israel would be expected to derive greater growth benefits from finance
than Bosnia and Herzegovina. The findings are also consistent with a “too much finance”
hypothesis, with the growth impact weakening with increases in both financial inclusion and
depth. Given the limited time series, however, this result is more suggestive than definitive in
uncovering a financial inclusion-long run growth nexus.

Turning to broader issues of economic inclusion, Cihák and others (2020) also obtain
encouraging results linking financial inclusion to lower inequality, based on panel
regressions for 105 countries over the 2004-15 period. Payments services, as approximated
by ATM coverage, are found to be associated with lower inequality, as measured by the
GINI coefficient. Furthermore, this relationship is significantly stronger when economic
growth is faster, when the financial system is more stable, and when financial depth is lower.
For credit—the share of borrowers in the population—the differences in the negative
financial inclusion-inequality relationship are even more stark; while at low levels of depth
this relationship is relatively strong, it weakens at progressively higher levels of depth, and
eventually reverts, meaning that at high levels of depth an expansion in use of credit can
increase inequality. Using composite measures, Loukoianova and Yang (2018) also find
beneficial effects of financial inclusion, reducing inequality and poverty in addition to
increasing economic growth.

C. Possible Tradeoffs between Financial Inclusion and Financial Stability
Finally, there has been empirical work exploring the relationship between financial inclusion
and financial stability. This is motivated partly by the “too much finance” hypothesis, which
argues that one reason why the finance-growth relationship exhibits the hump shape is
because very large financial systems tend to become more prone to instability and crises. It is
also related to work by Schularick and Taylor (2012) and others who find that rapid

23
     Sahay and others (2020) find similar beneficial effects on economic growth for adoption of digital payments.
16 expansions in credit are often precursors to financial crises. Given that one sees a similar weakening relationship between financial inclusion and growth as inclusion increases, the question then is whether there is a tradeoff between financial inclusion and financial stability. On the positive side, Han and Melecky (2013) find a stabilizing effect of greater inclusion in bank deposits; countries in which a larger share of the population had access to deposits prior to the 2008 global financial crisis suffered significantly smaller withdrawals when the crisis hit. Mehrotra and Yetman (2015) show that consumption volatility tends to be lower in countries where there is a larger percentage of adults that have accounts and save in formal financial institutions. Other studies have found more mixed results. In a panel data setting including a sample of 150 countries, Cihak, Mare, and Melecky (2016) examine the inclusion-stability relationship more broadly, using measures of account ownership, payments, savings, credit, and insurance services, which they then relate to different indicators of financial stability. They find that the relationship is complex, with instances of tradeoffs between the two—in particular, with regard to expansions in credit access—but also instances of synergies between some aspects of financial inclusion and stability, primarily during non-crisis times. They also find that the relationship is also affected by country characteristics, such as financial openness, tax rates, education, and credit information depth. Sahay and others (2015) and Cihák and others (2020) focus on credit inclusion, and find that the relationship with financial stability depends crucially on the quality of bank regulation and supervision. If high, then no tradeoff emerges; bank credit can be expanded to a greater share of the population without endangering financial stability. If regulatory and supervisory is low, however, then the tradeoff does emerge, credit inclusion will come at a cost of lower financial stability. More recently, Ahamed and Mallick (2019) obtained more encouraging results. From an international sample of 2,635 banks in 86 countries, financial inclusion was found to contribute to a more stable banking system, an effect that is more pronounced when banks are mostly funded by deposits, display low marginal costs, and operate within a strong institutional environment. D. Channels through which Financial Inclusion Can Affect Key Economic Outcomes As discussed earlier in the context of the Rajan and Zingales (1998) study, a main consequence of financial activity is that it eases financing constraints to individuals and firms, thereby providing possibilities that would not be available if these agents were limited to their own funds. Dabla-Norris, Ji, Townsend, and Unsal (2015 and 2019)—hereafter, DNJTU—develop a theoretical model that traces out key channels through which financial activity and financial inclusion ultimately affect economic outcomes. 24 In the stylized 23F economy they describe, individuals differ in their initial wealth and their managerial talent or productivity, and decide on whether to become a worker or an entrepreneur by comparing how much they could earn in each activity. Entrepreneurship can be profitable, but only after spending a certain upfront cost, and this profitability will depend on the individual’s talent as 24 As the authors point out, their model is in the tradition of macro-development models incorporating heterogeneous agents and financial frictions (Banerjee and Newman, 1993; Gine and Townsend, 2004; and Bauer and Shin, 2011, 2013). However, their model is unique in that it incorporates multiple financial frictions faced by economic agents.
17

well.
Figure 8, taken from DNJTU, summarizes the impact of finance and financial inclusion,
specifically related to credit. The panel on the left represents a situation in which no credit
exists, termed the “savings regime”. Four types of agents emerge. First, “unconstrained
workers”, individuals with very limited managerial ability, who therefore will opt to be
workers regardless of their initial wealth. Some individuals have sufficient talent to become
entrepreneurs, but because of their limited wealth, lack the capital required and must remain
workers. These are the “constrained workers”. Another group have sufficient talent and
initial wealth to become entrepreneurs, but may not have sufficient wealth to operate their
firms at the optimal scale (“constrained entrepreneurs”), while those in a fourth group are
wealthy enough to be able to do so (“unconstrained entrepreneurs”). With credit—the “credit
regime”—some talented individuals are able to invest in the required capital and become
entrepreneurs, thereby shrinking the portion of constrained workers and expanding that of
entrepreneurs. As illustrated in the panel on the right, the portion of unconstrained
entrepreneurs also expands. Credit also allows some entrepreneurs to increase their scale of
production to the optimal level.

It follows that introduction of credit will increase the level of entrepreneurship, allowing
talented but constrained individuals to become entrepreneurs, and to increase the scale of
production of the incumbent businesses. Therefore, overall GDP will most certainly increase,
while effects on productivity and income distribution are a bit more complex and ambiguous.
While some entrepreneurs are able to increase their productivity by reaching the optimal
scale, access to credit also introduces small-scale firms that are initially not very productive,
while the average entrepreneurial talent is likely to increase. Individuals becoming
entrepreneurs will benefit, as will workers through upward pressure on wages—there is now
a smaller supply of workers relative to entrepreneurs—but wealthy entrepreneurs who had
been constrained will benefit as well.

Beyond the extremes depicted in Figure 9, three main frictions inhibit an economy from
increasing the availability and scale of credit. The first is a credit access or entry cost friction
that must be borne in order to obtain credit, reflecting such factors as the distance to the
nearest bank, the documentation required, lack of knowledge about credit, cultural
constraints, lack of trust in banks, discrimination, and others. Equivalently, in countries with
very low levels of financial inclusion, it is very costly for a large segment of the population to
access financial services such as credit. A second friction is related to weak contract
enforceability, that facilitates individuals’ incentive to abscond with a portion of the loan and
not invest it productively. In response, banks impose a collateral constraint, thus limiting the
amount of leverage taken on by their borrowers. While prudent, this action also limits the
quantity of credit or financial depth, therefore some entrepreneurs may not be able to reach
their optimal scale. The final friction is related to efficiency of financial intermediation, as
reflected in the spread between the rate charged on loans and the rate paid on deposits. 25 By                                  24F

increasing the cost of credit, this friction reduces the profitability derived from debt-financed
activity, and will therefore inhibit both the entry of new entrepreneurs and the scaling up of

25
     Note that this is not the same as the interest rate charged for the loan, which will be related to a different friction.
18 production by constrained entrepreneurs. 26 25F By calibrating the model to reflect country-specific characteristics, DNJTU simulate the effects of reducing each of these frictions on key outcomes, including GDP, productivity, income distribution and risk of default. Figure 10 shows one such simulation for three emerging economies (Malaysia, the Philippines, and Egypt) resulting from the reduction in the financial inclusion friction (denoted by ψ). In all countries, greater access to credit leads to greater economic activity, although total factor productivity (TFP) declines as a result of the entrance of small-scale firms. On net, income distribution improves, and there is little effect on either interest spreads or nonperforming loans, as leverage does not become troublesome. DNJTU show how the results vary depending on initial conditions; for three low-income countries, for example, the initial levels of financial inclusion are substantially lower, and it takes a larger reduction in the friction to bring about a noticeable entry of new entrepreneurs. As a result, initially TFP does not fall but income distribution worsens as the prime beneficiaries are wealthier entrepreneurs who are able to borrow to increase their scale of operation. Recall that one key message derived from the literature is that pro-inclusion policies should focus on alleviating or removing frictions that inhibit access to financial services. The DNJTU framework allows one to simulate the impacts of such policies, and to compare different strategies, such as reducing financial frictions one at a time, or all three together. DNJTU (2019) derive several lessons from these simulations. First, different policies have different impacts depending on the country, that is, there is no “one size fits all” policy for increasing financial inclusion. Second, because of how the frictions interact with one another, the friction that is most binding for a country may not be obvious from the descriptive data. For example, with only 6.7 percent of firms having access to credit, it would seem that in Pakistan the entry cost would be the most binding, but simulations show that it is the collateral constraint that is most binding, as its reduction produces the greatest gains to the economy. Third, even if all income groups benefit from the policies, income distribution may be become more unequal—the Gini coefficient increases. Finally, country conditions affect the overall strategy, whether to reduce one friction—the most binding—or to pursue a more balanced approach. While the empirical literature cited in the previous section has explored the relationship between financial inclusion and financial stability, theoretical work generally has not, although the DNJTU model does provide some useful insights. Note that as individuals move into the credit regime, leverage is introduced as well; in the savings regime, all investment was undertaken with internal funds. With leverage, there is now also the possibility of borrowers’ default. Indeed, the model shows that facilitating finance is often accompanied by 26 In DNJTU (2019), the description of the three frictions was refined relative to DNJTU (2015). The “financial inclusion” friction, became the broader “credit access” or “entry cost” friction, recognizing that all three frictions are related to financial inclusion. The “financial depth” friction became “collateral constraint”, also recognizing that all frictions affect financial depth. Finally, the 2015 paper had related the efficiency friction to an asymmetric information problem; lenders know their borrowers only imperfectly, who may also have a strategic incentive to default on their loans. In response, lenders will have to monitor borrowers’ behavior, involving a cost that will be passed on to borrowers through higher lending rates, and therefore a wider intermediation spread arises. The 2019 study views this friction more broadly, as reflecting inefficiency in intermediation in general, part of which may be due to high monitoring cost.
You can also read