STAKEHOLDER ENGAGEMENT ON INEQUALITY TRENDS IN SOUTH AFRICA- A multidimensional diagnostic of inequality - ACEIR
←
→
Page content transcription
If your browser does not render page correctly, please read the page content below
STAKEHOLDER
ENGAGEMENT ON
INEQUALITY TRENDS
IN SOUTH AFRICA –
A multidimensional
diagnostic of inequality
Summary of the stakeholder event
on inequality in South Africa

11 February 2020
Philippi
Cape Town
ABOUT THIS PUBLICATION
This summary relates to the publication of the report Inequality Trends in South Africa – A
multidimensional diagnostic of inequality and captures the information presented and the
discussions at a stakeholder engagement held on 11 February 2020 at Philippi, Cape Town.
The event was held in partnership with Statistics South Africa; the Southern Africa Labour
and Development Research Unit, University of Cape Town; the Agence Française de Dével-
oppement, and the European Union Research Facility on Inequalities; and was facilitated by
the African Centre of Excellence for Inequality Research.
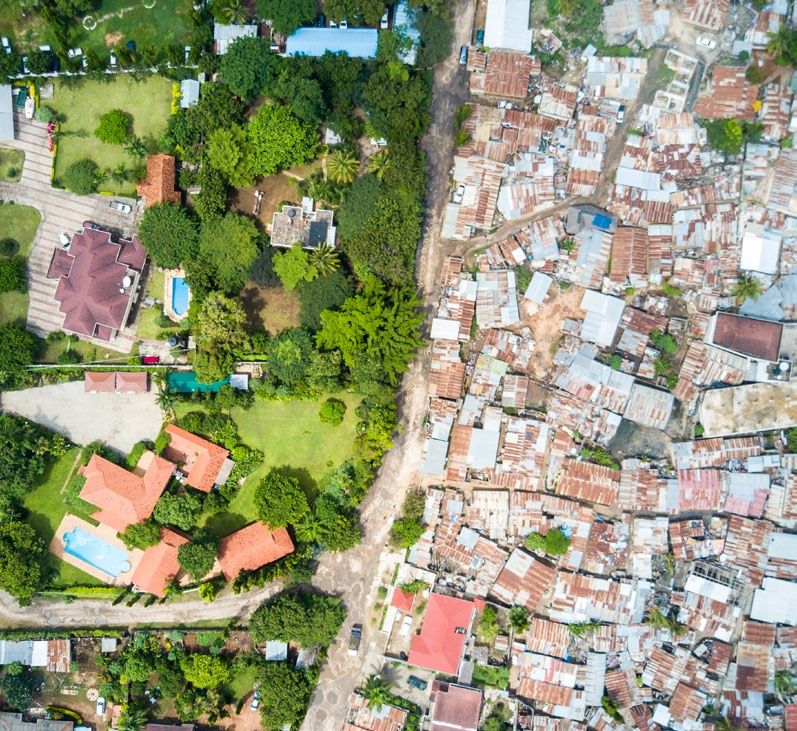
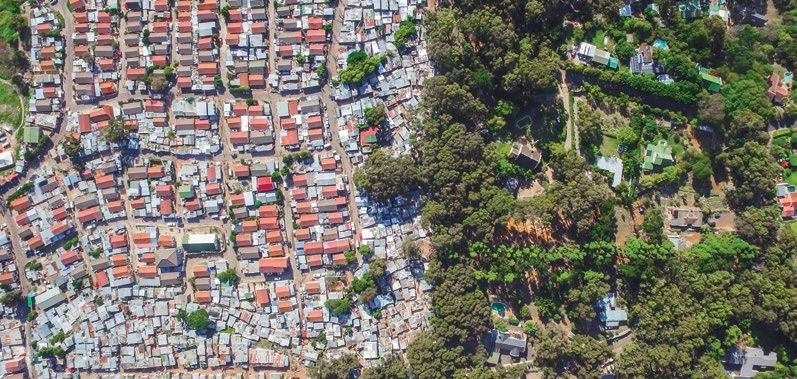
Photographs in the report are used with permission from Johnny Miller, Unequal Scenes:
https://unequalscenes.com/
Contact details
Haajirah Esau
African Centre of Excellence for Inequality Research
c/o SALDRU
School of Economics
Middle Campus
Stanley Road
University of Cape Town
Rondebosch
Cape Town
7701
Tel: +27 (0)21 650 5715
Haajirah.Esau@uct.ac.za
www.aceir.org.za
2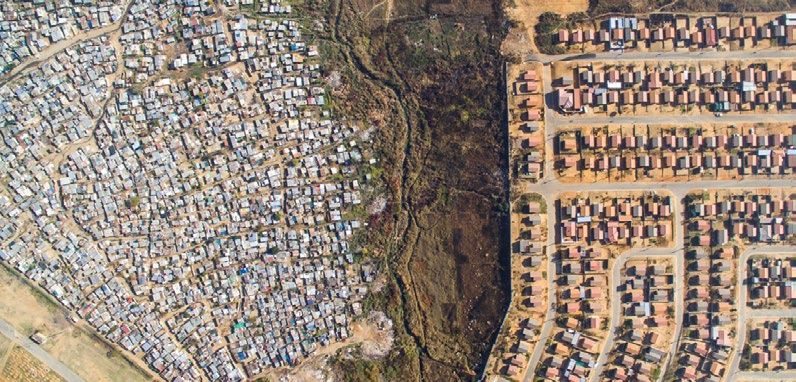
CONTENTS

ABOUT THIS PUBLICATION.......................................................................................2

ABBREVIATIONS.........................................................................................................4

1. EXECUTIVE SUMMARY........................................................................................5

2. INTRODUCTION................................................................................................10

3. EVENT PROGRAMME........................................................................................12

4. SETTING THE SCENE........................................................................................14

5.	RESEARCH FINDINGS AND DISCUSSIONS....................................................17
     5.1     Economic inequality............................................................................................. 17
     5.2     Labour market inequality..................................................................................... 23
     5.3     Social inequality ................................................................................................... 26

6.	STAKEHOLDER PERSPECTIVES AND DISCUSSIONS.....................................30
     6.1     Policy framework................................................................................................... 30
     6.2     Economic inequality............................................................................................. 32
     6.3     Gender inequality................................................................................................. 36
     6.4     Energy access inequality...................................................................................... 42
     6.5     Spatial inequality.................................................................................................. 46

7.	CONCLUSION AND WAY FORWARD..............................................................49
     7.1     Where do we go from here?................................................................................ 49
     7.2     Logging ideas for action...................................................................................... 50
     7.3     Closing remarks.................................................................................................... 52

8. ADDENDUM.......................................................................................................53
     8.1     About the diagnostics report.............................................................................. 53
     8.2     About ACEIR (event host).................................................................................... 54

9.    FIGURES.............................................................................................................55

                                         Stakeholder Engagement on Inequality Trends in South Africa                                    3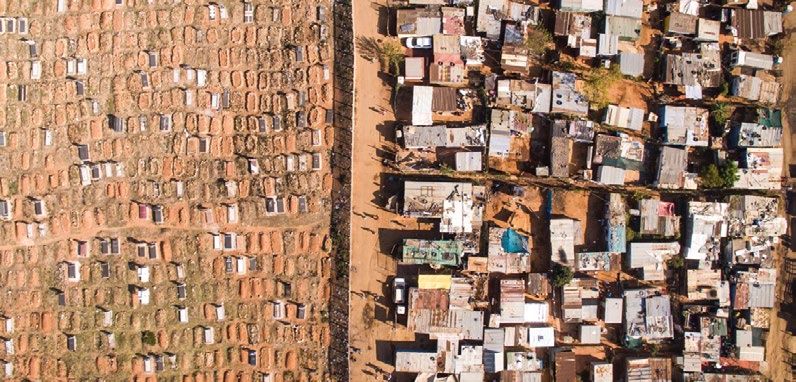
ABBREVIATIONS
    ACEIR 		   African Centre of Excellence for Inequality Research
    AFD 		     Agence Française de Développement
    ARUA 		    African Research Universities Alliance
    CEO		      Chief Executive Officer
    COCT       City of Cape Town
    DBSA 		    Development Bank of Southern Africa
    DDM		      Distributed Development Model
    EEA 		     Employment Equity Act
    ESSA 		    Employment Services of South Africa
    EU 		      European Union
    GHS		      General Household Survey
    IES		      Income and Expenditure Survey
    INEP 		    Integrated National Electrification Programme
    IPP 		     Independent Power Producer
    LCS		      Living Conditions Survey
    LFP 		     Labour Force Participation (rate)
    LINES 		   Low-Income Energy Services
    NDP 		     National Development Plan
    NEA		      Not Economically Active
    NIDS		     National Income Dynamics Study
    NPC 		     National Planning Commission
    OECD 		    Organisation for Economic Co-operation and Development
    PALMS		    Post-Apartheid Labour Market Series
    QLFS		     Quarterly Labour Force Survey
    SACN 		    South African Cities Network
    SALDRU     Southern Africa Labour and Development Research Unit
    SAMPI 		   South African Multidimensional Poverty Index
    SARS 		    South African Revenue Services
    SA-TIED    Southern Africa – Towards Inclusive Economic Development
    SDGs 		    Sustainable Development Goals
    SEM 		     Sustainable Energy Markets
    Stats SA   Statistics South Africa
    YES 		     Youth Employment Service

4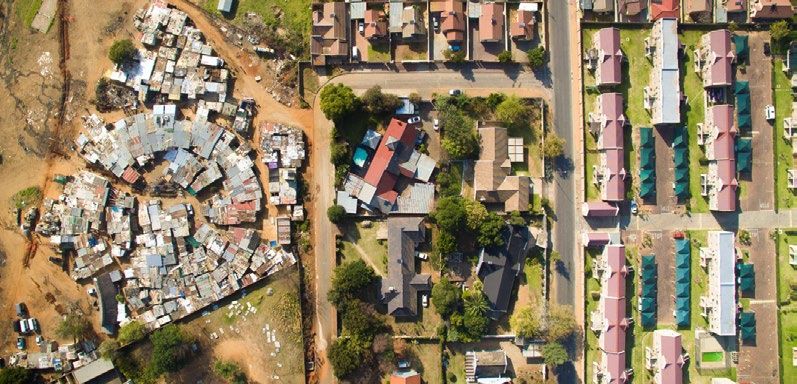
1. EXECUTIVE SUMMARY
It is widely accepted that South Africa’s persistently high levels of inequality are not only a
humanitarian crisis, they are also unsustainable and curb the country’s growth potential. Yet,
despite extensive research coupled with well-targeted government policies, efforts to re-
verse inequality over the past decades have failed to deliver meaningful progress.

Researchers and policymakers increasingly have to re-think their approaches to this intracta-
ble problem, taking into account the multidimensional nature of inequality and the impor-
tance of collaboration in addressing these.

To this end, on 11 February 2020 – symbolically as the 30th anniversary of Nelson Mandela’s
release from prison – stakeholders from across the country, and from all sectors, gathered in
Philippi, Cape Town, to begin the process of forging a new agenda for action.

Hosted by the African Centre of Excellence for Inequality Research (ACEIR), the event sought
first to present high-level research findings from a comprehensive new report on the multi-
dimensional nature of poverty in South Africa; and invited stakeholder engagement to map
out a way forward.

Believing that data is the foundation of informed national dialogue, ACEIR works with Statis-
tics South Africa (Stats SA) to take stock of and collate the data and, crucially, to democratise
this process by making the data publicly available for local research and discussion among
stakeholders as well as for the policy community.

The report, titled Inequality Trends in South Africa – A multidimensional diagnostic of in-
equality, was the first of its kind in South Africa and presented a broad overview of various
dimensions of inequality in the country including household income and expenditure, as-
sets, earnings, employment, education, health, access to basic services, and social mobility.

                               Stakeholder Engagement on Inequality Trends in South Africa          5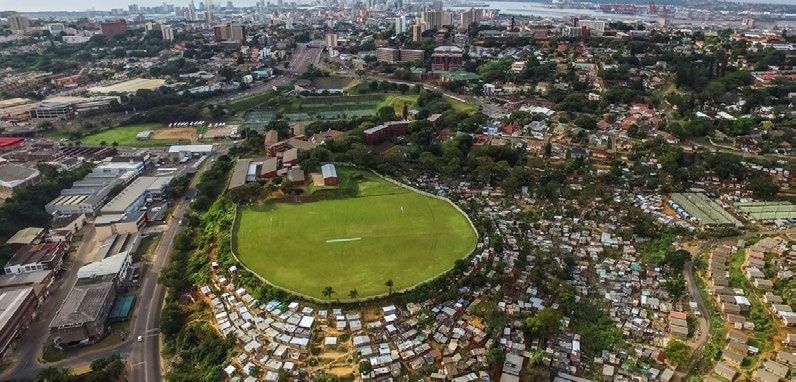
Published in November 2019, it served as a baseline diagnostic to assist the country to track
    its performance in ensuring that all people in South Africa shared the same opportunities
    and have equal access in realising those opportunities.

    The day started with welcome addresses from key stakeholders and sponsors including: the
    French Ambassador to South Africa, Aurélien Lechevallier; the European Union (EU) Ambas-
    sador to South Africa, Riina Kionka; and Ashwell Jenneker, Deputy Director-General: Mar-
    keting, Communication and Publishing, Stats SA. All three underlined the importance of the
    event and highlighted the magnitude of the problem of inequality.

    Research findings
    High-level presentations on selected research findings were made by the three institutions
    involved in the preparation of the diagnostic report.

       1. Economic inequality (including expenditure and income inequality and asset
           inequality
           Updated figures on the Gini coefficient – the most commonly used inequality mea-
           sure – were explored for per capita expenditure and income by gender, province and
           population group. The sources of income inequality were also introduced along with
           a snapshot of asset ownership. Assets were regarded as an important economic indi-
           cator to assess inequality in addition to the other money-based indicators. While the
           overall story remained negative, there was good news at lower levels of assessment,
           for example an increase in overall household ownership of assets for black Africans.
           The Palma ratio was also introduced as a more intuitive measure to complement the
           Gini coefficient. It was hoped that this relatively new measure – which offered a sim-
           ple ratio of the income share of the top 10% versus the bottom 40% – was adopted
           by South Africa for its Sustainable Development Goals (SDGs) suite of indicators.

       2. Labour market inequality, gender and social mobility
           Labour market income – defined here as earnings from wages, but excluding income
           from remittances, capital, grants and other sources – was by far the largest contribu-
           tor to overall inequality in South Africa. South African unemployment levels were ex-
           tremely high and have worsened: typically, between 25% and 30% (using the narrow
           decision). This rate was about twice as high for youth. This presentation looked at la-
           bour market trends over the period 2011 – 2017 including labour force participation,
           unemployment rates, and distribution of income by population group and gender.
           Overall findings were that while employment in the informal and agricultural sectors
           was relatively low, when compared to other countries, South Africa’s agricultural sec-
           tor was highly mechanised and the informal market, for unknown reasons, was very
           small. Groups that were disadvantaged in the labour market were black Africans rela-
           tive to whites, females relative to males, and rural dwellers relative to urban dwellers.

6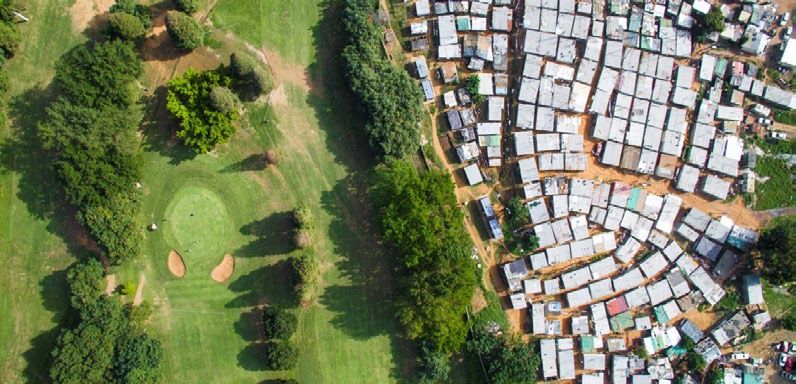
And finally, groups who were more likely to find employment (higher education and
        higher earners), earned higher wages and were less likely to lose employment, thus
        contributing to a “vicious cycle” of inequality.

    3. Social inequality (access to services, education, health and the internet)
        Looking beyond income, expenditure and labour market access to a number of other
        basic service indicators provides a more nuanced understanding of inequality. The
        indicators for which sufficiently reliable data was available, and which were covered
        in the diagnostics report, included access to services, education, health and the in-
        ternet. Interestingly, while economic inequality has often not changed much, the in-
        dicators covered in this section have illustrated greater improvements. Key highlights
        included:

        u improvements in school attendance and class sizes;

        u more learners benefitting from no-fees policies;

        u greater book availability;

        u 90% of learners in all provinces, except the Western Cape and Gauteng, have
          benefitted from the government’s nutrition programme;

        u improvement in access to basic services (electricity, sanitation, refuse removal)
          except water where, after initial increases, there has been a recent decline; and

        u an increase in access to the internet for all population groups.

        When it came to access to healthcare facilities and services, the picture was less rosy.
        There has been a decline in overall access to medical aid. In fact, inequality showed
        up vividly in health, with black Africans the least likely to have access to medical aid
        and the most likely to use public health facilities.

Towards an agenda for action
The morning was rounded off with a presentation from the event Chair, Murray Leibbrandt –
Director of the Southern Africa Labour and Development Research Unit (SALDRU), University of
Cape Town and ACEIR – on the uses and application of the diagnostic report in policy design.

Leibbrandt challenged participants to use the day as an opportunity to source ideas to “fight
the data” in the report and find ways to use the evidence presented to make better policy
decisions and curb inequality across its different dimensions. “We need to move from theory
to action”, he said.

He cautioned that the survey report in and of itself could not cover all aspects of inequality
in South Africa and it was not offering solutions. It was a diagnostic tool. The hope was that
it helped to inform the debate around the SDGs – specifically Goal 10, which deals with in-

                               Stakeholder Engagement on Inequality Trends in South Africa         7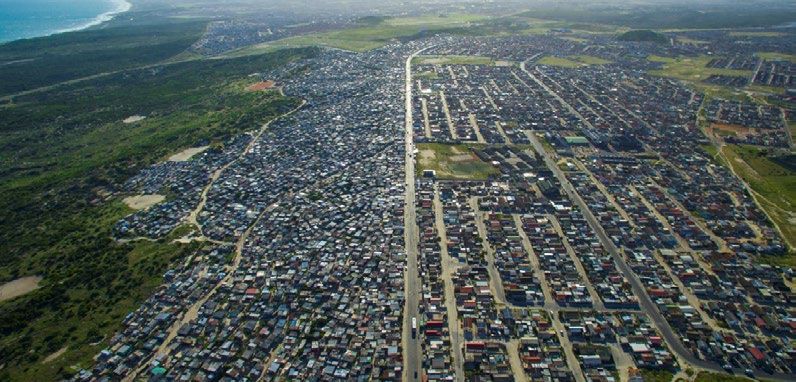
equality. The role of stakeholders in taking this hope forward could not be overemphasised.

    Accordingly, after lunch, a series of presentations from stakeholder participants deepened
    the conversation by providing fresh insights based on work being done on various facets of
    inequality, including:

        u economic inequality;

        u labour market inequality;

        u gender inequality;

        u education inequality;

        u access to energy inequality; and

        u spatial inequality.

    These presentations were followed by robust question and answer sessions with participants
    who further interrogated the information in the diagnostic report.

    Earlier, two panellists, Ayabonga Cawe, development economist and former Economic Jus-
    tice Manager of Oxfam South Africa and a member of the Presidential Economic Advisory
    Council; and Mzukisi Qobo, Professor of International Business at the University of the Wit-
    watersrand and a member of the Presidential Economic Advisory Council, set the scene by
    highlighting considerations for putting in place an effective policy framework to address in-
    equality. Cawe particularly highlighted that policymakers needed to understand the historic
    drivers of inequality in the country – factors such as cheap electricity, cheap labour and social
    reproduction functions undertaken by many communities. Qobo pointed out that a weak
    and eroded public sector that had grown too large, and was exposed for pockets of corrup-
    tion, was a potential obstacle to effective policymaking and implementation.

    Rudi Dicks, Head of the Project Management Office in the Office of the President, The Pres-
    idency, and Murray Leibbrandt closed off the day by thanking the stakeholders who had
    taken the time to be there as well as sponsors who had made the day possible. They also
    summarised key outcomes and called for an ambitious agenda for action.

    Dicks said that the morning’s presentations provided the evidence to help stakeholders
    make informed decisions and emphasised that it was now about “taking the evidence and
    turning it into policy and implementation”. Bringing together stakeholders, such as at this
    event, helped to ground the conversation in reality, he said. The big challenge was to find
    answers to the way forward in addressing South African inequalities.

    Leibbrandt stressed the importance of improved collaboration and urged those present to
    log specific interventions so that the ACEIR team and its partners could leverage these ap-
    propriately. Six key questions were recorded:

        u How is inequality framed in the public discourse and how to make connections be-

8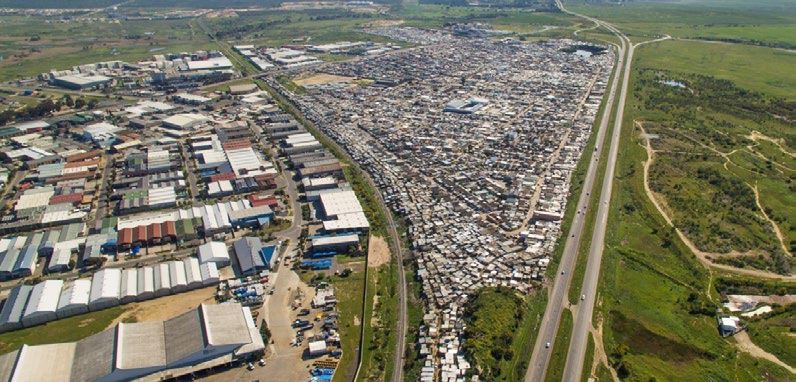
tween high-level data and what was happening on the ground to inform action?

u How could actuaries collaborate with researchers to jog top earners out of compla-
  cency over inequality?

u How could young people be helped to leverage social capital to find work?

u How could agency be returned to people to organise themselves to respond to
  inequality?

u How to build more coalitions and partnerships to tackle the gender pay gap?

u Can South Africa be benchmarked against other similar countries to get a better
  sense of where the leverage points were to bring about a shift?

                         Stakeholder Engagement on Inequality Trends in South Africa   9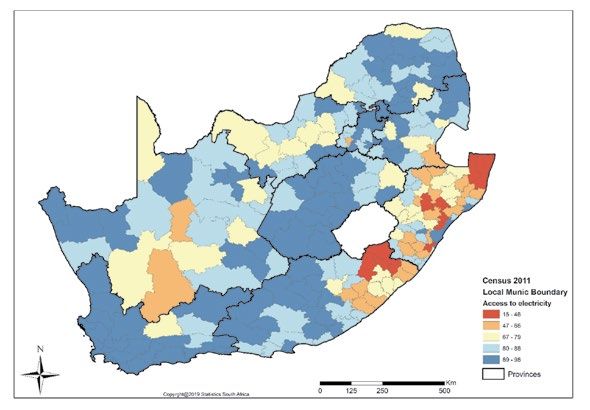
2. INTRODUCTION
     Inequality was a vital issue for South Africa to address. It destroys social cohesion and distorts
     economic and political power, as can be witnessed in the country’s service delivery protests
     and by victims of xenophobic attacks. Poverty was also a trap, since being poor made it more
     difficult to change your circumstances. Inequality was a fight for freedom.

     This document provides a summary of a stakeholder event that was held to present research
     findings and obtain input from society following the publication of a major research report
     on the multidimensional nature of inequality in South Africa.

     Titled Inequality Trends in South Africa – A multidimensional diagnostic of inequality, the
     report was published in November 2019 and served as a baseline diagnostic to assist the
     country to track its performance in ensuring that all people in South Africa shared the same
     opportunities and have equal access in realising those opportunities.

     The report, which can be downloaded via the Stats SA website, was the product of a partner-
     ship between Stats SA, SALDRU and the Agence Française de Développement (AFD) and fa-
     cilitated by ACEIR. The project was funded through the EU’s Research Facility on Inequalities.
     This report, which was based on national surveys over recent years, was the first of several
     similar inequality trend reports planned for different African countries, starting with Kenya
     and Ghana, where work has already begun.

     Participating stakeholders included National Treasury, the National Labour and Economic
     Development Institute, the Development Bank of Southern Africa (DBSA), the South African
     Cities Network (SACN), Oxfam South Africa and other non-governmental organisations and
     individuals active in this sector.

10
The event’s objectives were to:
u Present an overview of the findings of the report along with an in-depth focus on
select sections that best illustrated the key inequality challenges facing South Africa;
u Hold a structured engagement with a wide range of key stakeholders who had the
opportunity to present their ideas and proposed actions and strategies for con-
fronting inequality; and
u Do a stocktake of individual and collective ways forward, including discussions on
further research gaps that needed to be filled to enable the country to understand
and reduce inequality better.
The key points that emerged from the day’s presentations and discussions are captured in
this report. This includes, most importantly, recommendations to improve future inequality
reports and to tackle South Africa’s inequality problem across its various facets: household
income and expenditure, assets, earnings, employment, education, health, access to basic
services, gender and social mobility.
This stakeholder event was the first step towards further engagements planned for 2020 with
government and other stakeholders that were committed to finding new ways of tackling
inequality and to realising the economic potential of South Africa.
Stakeholder Engagement on Inequality Trends in South Africa 113. EVENT PROGRAMME
The detailed programme is specified below.
Part one
During the first half of the day, the research report’s key findings, as well as its uses and ap-
plications in policy design, were presented:
u Welcome by the French Ambassador to South Africa, Aurélien Lechevallier.
u Welcome by the EU Ambassador to South Africa, Riina Kionka.
u Welcome and the context of the diagnostic report in the work of Stats SA by Ashwell
Jenneker, Deputy Director-General: Marketing, Communication and Publishing, Stats
SA.
u Research findings by theme:
The three institutions involved in the preparation of the diagnostic each sum-
marised selected key findings highlighted in the report.
w Expenditure, income and assets: presented by Werner Ruch, Director: Research
and Product Development, Stats SA.
w Labour markets, gender and social mobility: presented by Vimal Ranchhod,
Deputy-Director, SALDRU, School of Economics, University of Cape Town.
w Access to services, education and health: presented by Anda David, Research
Officer, AFD.
12u The diagnostic as a tool: Murray Leibbrandt (Director, SALDRU, School of Econom-
ics, University of Cape Town and Director of ACEIR).
Part two
In the second half of the day, an in-depth engagement with stakeholders was held with the
aim of exploring the general policy framework for inequality and translating the diagnostic’s
findings into actions, both for better data gathering and reporting, as well as for ideas and
actions to address inequality individually and as a collective. Short thematic presentations
were given by specialist stakeholders to set the scene for more detailed suggestions, ques-
tions and discussions.
u Session 1: Policy framework to address inequality
w The session was facilitated by Busani Ngcaweni (Deputy Director-General in
The Presidency).
w Presentations were made by Ayabonga Cawe (development economist, col-
umnist, radio presenter, photographer, activist and member of the Presidential
Economic Advisory Council) and Mzukisi Qobo (Presidential Economic Advisory
Council and Wits Business School, University of the Witwatersrand).
u Session 2: Specific key areas
w Economic inequality: presented by Sibusiso Gumbi (Director: Socio-economic
Policy, National Treasury) and Basani Baloyi (Oxfam SA Fellow on Research and
Policy).
w Labour market inequality: presented by Rudi Dicks (Head of the Project Man-
agement Office in the President’s office, The Presidency).
w Gender inequality: presented by Ayanda Mvimbi (Women’s Economic Empow-
erment Programme Specialist, Head of UN Women Flagship Programme on
Women’s Entrepreneurship in Gender Response Procurement) and Colleen
Lowe Morna (Chief Executive Office, Gender Links).
w Energy access inequality: presented by Adrian Stone (Manager: Climate
Change and Integration Platforms, City of Cape Town) and Lungile Mashele
(Energy Specialist, Development Bank of Southern Africa).
w Spatial inequality: presented by Stacey-Leigh Joseph (Executive Manager: Pro-
grammes, South African Cities Network).
w The session was facilitated by Rudi Dicks (Head of the Project Management
Office in the President’s office, The Presidency).
Stakeholder Engagement on Inequality Trends in South Africa 134. SETTING THE SCENE
The event date was chosen to fall on the 30th anniversary of Nelson Mandela’s release from
prison. Mandela was of course one of the great champions of the poor and committed to re-
ducing inequality. The selection of the venue, the Solutions Space in Philippi Village, was also
deliberate. Set up in 2017 by the Bertha Centre for Entrepreneurship and Innovation, based
at the University of Cape Town Graduate School of Business, the Solutions Space seeks, in
part, to address the spatial inequalities of South African society, which were a legacy of the
apartheid era. It was the first community hub to be established by the university in its 180-
year existence. While the university has been active in local communities, with field research
sites, mobile health services and education programmes for decades, it had not, until now,
established a presence with the long-term purpose of getting students and stakeholders to
engage and interact beyond the traditional spaces of the university.
The event host, Murray Leibbrandt, challenged participants to use the day as an opportunity
to source ideas to “fight the data” in the report and find ways to use the evidence presented
to help make better policy decisions and curb inequality across its different dimensions. “We
need to move from theory to action”, he said.
He cautioned that the report in and of itself could not cover all aspects of inequality in South
Africa and it was not offering solutions. It was a diagnostic tool. The hope was that it could
help inform debates on the Sustainable Development Goals (SDGs) – specifically Goal 10
which deals with inequality. Data was the foundation for informed national dialogue on
this critical issue of inequality. By bringing together stakeholders who were very active in
this space, it was hoped that the discussions would generate practical insights that could be
applied in tackling inequality.
14Three welcome presentations set the scene for the day:
Aurèlien Lechevallier, The French Ambassador to South Africa
Lechevallier emphasised the importance of this work for South Africa, given that it was one
of the most unequal countries globally. He highlighted some key survey findings to illustrate
the point:
u The richest 10% of people in South Africa accounted for almost 54% of all income in
2015. When other assets such as property, savings and investments were included,
other external research has indicated that the richest 10% may own up to 95% of
total wealth.
u According to the latest data from 2015, while the average white household had an
annual income of a little over R163 000, the average black African household, often
larger in size, survived on just over R25 000. It was noted, though, that black African
households saw an increase in real terms in their annual income, up from R17 000 in
2006, whereas a decrease in real terms took place in white households from a 2006
figure of R183 000.
u In terms of gender, average earnings for women were about 30% less compared to
their male counterparts.
The ambassador felt that the cliché that "a rising tide raises all boats" needed modification.
While the average income for black African households showed a clear increase in real terms
between 2006 and 2015, the benefits of this rising average have been spread unevenly. With-
in-group inequality amongst the black African population has worsened since 2006.
Lechevallier emphasised that inequality was not just an issue for South Africa, it was globally
a growing economic phenomenon with serious consequences.
Addressing inequality was deeply rooted in South African policy, starting with the Reconstruc-
tion & Development Programme from 1994 and continuing through to the current National
Development Plan (NDP), which listed inequality reduction as one of its two fundamental
objectives alongside poverty eradication. At a global level, the fight against inequality was
best articulated in the United Nations SDGs, specifically Goal 10.
Riina Kionka, The EU Ambassador to South Africa
Following her welcome and congratulating the survey team, Riina Kionka posed three ques-
tions and made comments on each of these:
1. What was the best way to approach and study inequality to address it?
She noted that the report demonstrated that hard evidence and cooperation could
yield robust and well-presented results, and that the multidimensional nature of
these survey results was essential for good policymaking. She also reflected on the
Stakeholder Engagement on Inequality Trends in South Africa 15global challenges of inequality and that the level of inequality was often worse be-
tween nations than within nations.
2. What could one learn from one another in taking the EU perspective?
She reflected on the fact that the EU also struggled with income inequality and not-
ed that the gap has been widening between rich and poor. This was of particular
concern, not only because income was not distributed more fairly, but it also threat-
ened social and political stability. Addressing this, in the spirit of “equality for all and
equality in all its sense”, was a priority. For this reason, the EU was involved in and
co-funded this initiative.
3. What can be learnt from South Africa and how to apply this research to the current
situation?
She noted that inequality in South Africa remained stubbornly racialised, genderised
and spatialised, and that there were pockets of deprivation that the report could help
to identify and help policymakers to target.
In conclusion, Kionka welcomed the opportunity that the report provided to help understand
the multiple and complex realities of inequality better; and advised that the EU would remain
involved as a partner in working with South Africa to address the issue.
Ashwell Jenneker, Deputy Director-General: Marketing, Communication and Publishing,
Stats SA
Jenneker reflected on some of his personal experiences of inequality. He grew up with the
stark reality of inequality in South Africa in a coloured area in Jeffreys Bay in the Eastern
Cape. About 100 metres away, in the white suburb, everyone had access to flush toilets and
electricity. Yet he had neither of these. A challenge for Stats SA was how to best capture
these kinds of disparities across South Africa in its data, and then how to best explain and
communicate these findings.
Stats SA started its work in this area with the basic poverty line measure, where a specific in-
come per day was taken and people falling below this line were deemed poor. But the reality
was of course far more nuanced. For this reason, the South African Multidimensional Poverty
Index (SAMPI) was developed; and this was essential to better understand and visualise the
dynamics of poverty across a range of measures and geographies, and design interventions.
165. R
ESEARCH FINDINGS AND
DISCUSSIONS
Research staff from the three participating institutions presented high-level summaries of
findings from the diagnostic report by theme, namely economic inequality (expenditure, in-
come, assets); labour market and gender inequality; and social inequality (access to services,
education, health and the internet). Later in the afternoon, further presentations from stake-
holders on these same themes were shared. The discussions that followed each presentation
on the way forward were also recorded here.
5.1 Economic inequality
Research findings
Presented by Werner Ruch, Director: Research and Product Development, Stats SA
Expenditure and income inequality
The report primarily drew on the Gini coefficient, the most-commonly used inequality mea-
sure. It was a measure from 0 to 1, where 0 represents perfect equality (all individuals receive
the same income) and 1 indicates perfect inequality (one person receives all the income). The
problem is that this measurement was not intuitive. For this reason, the Palma ratio was also
included in the report to supplement the Gini coefficient in the hope that this new measure
would be adopted in South Africa in its SDG suite of indicators, specifically Goal 10.
Many other countries have started using this more intuitive measure. The Palma ratio was
Stakeholder Engagement on Inequality Trends in South Africa 17defined as the ratio of national income/expenditure shares of the top 10% of the population
relative to the bottom 40%.
Key findings for the 2005 – 2016 period:
u Looking at per capita expenditure, the Gini coefficient has dropped marginally
from 0.67 to 0.65 between 2006 and 2009 but has stayed constant since then. A
Gini coefficient of about 0.65 places South Africa among the world’s most unequal
societies. [Figure 1]1
u Using income per capita, the Gini coefficient declined from 0.72 in 2006 to 0.67 in
2015. And, in fact, a target Gini of 0.6 by 2030 based on income was mentioned in
the NDP. But with the flatness that has been observed, achieving this target would
be a challenge.
u By gender it was found that men, within their sub-group, have a higher Gini coeffi-
cient than women. In both cases the Gini has declined somewhat over the assess-
ment period. [Figure 2]
u By province, the Gini coefficient has decreased for all provinces except for the Lim-
popo and Eastern Cape (two of the country’s poorest provinces) and the Northern
Cape where it remained unchanged. [Figure 3]
u Real annual median expenditure per population group indicates a big and prob-
lematic disparity. White individuals increased expenditure from about R77 000 to
R100 000, Indians/Asians increased from about R23 000 to R38 000, coloureds from
about R10 000 to R17 000 and black Africans from about R6 000 to R9 000. For black
Africans this meant a significant increase of about 50%, whereas the increase for
whites was only about 25%. The key challenge was that the gains for black Africans
were off a very low base, so even with high rates of change, there was a long way to
go. [Figure 4]
u Exploring the different sources of income inequality, labour market income was the
biggest driver and this explained about 75% of economic inequality with other in-
come (including income from capital – stocks, bonds, dividends, etc.). Remittances,
social grants and in-kind income had a much smaller impact. [Figure 5]
u Data for per capita income from labour markets across the ten deciles revealed
that for the lower two deciles (the bottom 20%), the share of income from labour
markets has declined between 2006 and 2015, thus placing increased pressure on
this source of income (in relation to other sources) – and this was probably because
tough labour market conditions and high unemployment rates have resulted in
higher skilled workers pushing out lower skilled workers. [Figure 6]
1 Information in brackets refers to the source data or graph from the speaker’s presentation or the
diagnostic report, Inequality Trends in South Africa – A multidimensional diagnostic of inequality. Click
on each [Figure] mention to jump to the data at the end of this report, from where you can return by
clicking on the [Return to discussion] below each figure.
18u Exploring the proportional impact of social grants, it was important to note that
the mechanism worked well. This was the case particularly for the bottom 40% or
50% of income earners, where social grants have contributed a much greater pro-
portional source of income than for the higher deciles. [Figure 7]
Key Palma ratio notes and findings:
u While in 2006, the top 10% spent about 8.6 times more than the bottom 40%, in
2015 this has declined to 7.9 in the Palma ratio. Although still very high, this indicat-
ed that financial resources have shifted from the top earners towards the middle
and the bottom 40%. Nonetheless, among national Palma ratios publicly available,
South Africa has one of the highest globally, which could be expected given the
country’s high Gini coefficient. [Figure 8]
u Looking at the Palma ratio for different population groups, it was apparent that
the ratio within the black African group got worse – the expenditure for the top
10% being 4.8 that of the bottom 40%. For coloureds it has stayed the same at 4.6,
for Indian/Asians it has seen a healthy decrease to a ratio of 2.4, and for whites it
decreased somewhat to about 1.9. This indicated that there was a lot more equity
within these latter two groups. But their relative high earnings drove the inequality
in the first two groups when the Palma ratio was assessed for all South Africans.
[Figure 9]
u For urban dwellers, the Palma ratio improved to about 7 over the period, while for
rural dwellers it worsened to about 4, meaning that just 10% were spending about
four times as much as the bottom 40%. [Figure 10]
Other key findings for the 2005 – 2016 period:
u Assessing household expenditure was invaluable for observing how inequality
changed over time. Household expenditure contributed about 60% to the measure
of GDP and for this reason the health of household economies had a strong bear-
ing on the country’s overall economy. What is apparent was that white household
contribution has declined significantly from about 45% to 36% of all household
expenditure, whereas the black African contribution has improved from about 42%
to about 49%. This means that 50c out of ever rand spent was spent by a black
household. [Figure 11]
u However, if the relative population group sizes are compared, it can be seen that
household expenditure by group was still very distorted. While whites only made
up about 8% of the country’s population, they accounted for about 36% of house-
hold expenditure in 2015, and whereas black Africans made up about 80% of the
population in 2015, they only accounted for about 49% of household expenditure.
[Figure 12]
Stakeholder Engagement on Inequality Trends in South Africa 19u Another distortion was apparent when looking at the difference in gender-related
household expenditures. While about 58% of households were headed by men
(versus 42% for women), male households accounted for a massive 74% of house-
hold expenditure (versus just 24% for women) – which quite likely reflected South
Africa’s patriarchal society. [Figure 13]
Asset inequality
Assets were an important economic indicator for assessing inequality in addition to the other
money-based indicators illustrated above. In fact, economic literature indicated that assets
could be a more reliable indicator of economic well-being over the longer term.
Eighteen assets were selected, three of which were publicly provided assets (piped water,
electricity connection and toilet facilities) and 15 of which were regarded as private assets.
Key findings for the 2009 – 2015 period:
u There was a significant increase in most assets. The only three assets that declined
were DVD players, radios and cameras. [Figure 14]
u The data indicated that overall household ownership of assets has increased
during the research period. [Figure 15] White households had almost universal asset
ownership (about 15 out of 18) and there was little change over the 2009 to 2015
period. However, black Africans households in 2009 on average owned about 7.5
assets out of 15, whereas for 2015 this had increased to 9.0. While this represented
a solid gain, it was off a low base and there continued to be a significant gap that
needed to be closed. [Figure 16]
u When measuring asset inequality, so correlating asset ownership to the Gini coef-
ficient, by population group, it was noted that within the black African group asset
inequality had increased from 0.54 to 0.56, whereas all the other groups experi-
enced declines. [Figure 17]
u Taking a gender-based view, bigger gains were made by female than male-head-
ed households in average assets scores, but even over the assessment period,
male-headed households in 2009 still had more assets on average than fe-
male-headed households in 2015. [Figure 18]
u Slicing the data by province, some big gains were apparent for the Eastern Cape,
KwaZulu-Natal and Limpopo, the poorest provinces South Africa. [Figure 19]
u In the rural versus urban context, rural household asset ownership increased sig-
nificantly from 6.1 to 7.8 on average, whereas urban average asset ownership only
increased from 10.3 to 10.9. [Figure 20]
20In conclusion to expenditure, income and asset inequality, while the overall story remains
negative, there was good news at lower levels of assessment. The questions were how this
transition could be accelerated; how to build better on the gains that have been made;
and how to overcome the problem of some population groups starting off a very low base.
Question and answer session – Economic inequality
The following questions were raised, with corresponding answers included:
u Why is homeownership not included as an asset class?
w Homeownership and landownership were important asset classes, particularly
because they could be rented out or borrowed against. The intention was to
include some of this data, but the quality was not sufficiently robust. A recom-
mendation has been made to improve future data gathering in this area.
u What about the black middle class that drove much of consumption and under-
pinned the growth in these assets? And many black Africans were state employed
– what was the risk of government’s intended salary freezes and downsizing of
the public service?
w One of the trends explored in the survey was to assess in what percentile the real
wage growth was taking place. For the period 2015 to 2017, there was no real
wage growth across race groups, except for individuals in the top 1 or 2%, where
there is significant growth. So, the wage freezes might not have much of an im-
pact on consumption, as this was not where most of the growth was coming from.
u Why was the level of household indebtedness not measured, as debt was often
used to acquire assets? And what about assessing the value that different assets
created or had the potential of creating?
w Indebtedness was an enormous issue that should ideally be taken into account.
For example, during the 2008 – 2011 economic crisis, a large increase in secured
and unsecured lending took place as households struggled to get by – and those
ramifications were probably still playing out. The inequality survey did include
information about household debt and savings. However, households sometimes
did not report all income and debt, or provided inaccurate information. The rea-
sons may be that households feared that the survey data will be shared with the
South African Revenue Services (SARS), or the income from capital information
was not readily available or top of mind, or there were household dynamics at play
where one member has not told another about a debt facility. For example, house-
hold income data correlated closely (about 85%) to income from work or labour,
but there was only about a 10% correlation when debt survey data was compared
to debt data from other sources. So, the debt data was not referred to extensively
and it was recommended to use the debt data offered by other institutions.
Stakeholder Engagement on Inequality Trends in South Africa 21u What was the GDP per capita or other targets that South Africa was aiming for to
reduce economic inequality?
w In terms of GDP, the country’s economy and labour market needed to grow –
that was the best way of strengthening inclusive growth that resulted in great-
er equality. The task of Stats SA was not to propose targets, but to provide
government and other South African stakeholders with reliable, useful and
easy-to-understand data so that informed decisions could be made. It is the
responsibility of a broader set of stakeholders to encourage government policy
and other decision makers to set appropriate targets relevant to South Africa.
The NDP has indicated a target Gini coefficient of 0.6 by 2030, but the limita-
tions of using only the Gini coefficient were highlighted and, as a minimum, the
Palma ratio should also be used.
u What about a situation where a family might earn all income living in a shack in
the Western Cape, but much of their expenditure takes place in the Eastern Cape
where they have a larger property – how was that scenario taken into consider-
ation?
w Double counting was prevented by the way in which the data was gathered.
For a particular sample household (e.g. in the Eastern Cape) the expenditures
and sources of income, including remittances, were captured. For a household
in the Western Cape that may be supporting a household in the Eastern Cape,
that remittance was captured as expenditure.
u The diagnostic report’s level of data disaggregation (particularly by geography,
gender and population groups) and that Stats SA is taking into consideration the
SDG perspectives, particularly SDG Goal 10, was appreciated. But how to report
on progress for people living with disabilities, who are central to the “leave no
one behind” principle of Agenda 2030? Would future surveys report on people
with disabilities?
w Greater disaggregation of data was the number one issue raised by stakehold-
ers to better understand inequality nuances, but data gathering was an expen-
sive activity. Stakeholders needed to lobby Treasury for a greater data-gather-
ing budget.
w The challenge with disabilities was that the numbers were fairly low relative
to the overall population, which meant that sample sizes needed to be much
larger to achieve data robustness, but this made it more costly. What was being
explored was setting up a continuous survey that would allow more regular data
gathering at lower levels of disaggregation geographically. And Census 2021
was being field-tested, which will offer another rich source of data to analyse.
22w The South African Multidimensional Poverty Index, which will be part of Census
2021, will allow deeper insights into disability as a form of poverty.
u Was a female-headed household not usually a single-parent household and a
male-headed household a two-parent household?
w While this, on average, was often the case, it would not always be the case.
Survey respondents had the choice to indicate the gender heading their house-
hold, which meant there would be a certain percentage of female-headed
households that included two parents.
5.2 Labour market inequality
Research findings
Presented by Vimal Ranchhod, Deputy-Director, SALDRU, School of Economics, University
of Cape Town
Labour market income – defined as earnings from wages, but excluding income from re-
mittances, capital, grants and other sources – was by far the largest contributor to overall
inequality in South Africa. South African unemployment levels were extremely high and have
worsened: typically, between 25% and 30% (using the narrow decision). This rate was about
twice as high for youth.
The following key findings were highlighted:
u Labour market trends over the period 2011 – 2017 highlight that:
w The employment rate (the percentage employed) was fairly stable; between
about 42% and 44%.
w The not economically active (NEA) proportion had declined. These were stu-
dents, retirees, caregivers, etc. that were not looking for employment.
w The labour force participation rate (LFP), which was the proportion not NEA,
has thus increased correspondingly. With a relatively stable absorption rate, and
increasing LFP, the unemployment rate has thus increased considerably from
an already high level of 24.8% to 27.5%. Jobseekers were entering the market
faster than new jobs were created.
w This pointed to the fact that current economic growth was not adequate for ab-
sorbing the increasing number of work seekers. And the economic growth that
has been experienced was accruing to the top income earners. [Figure 21]
Stakeholder Engagement on Inequality Trends in South Africa 23u The Gini coefficient for real monthly earnings in South Africa in 2015 was about
0.68, which was very high. As a comparison, the US has a Gini of about 0.5, which
was considered the most unequal among the Organisation for Economic Co-op-
eration and Development (OECD) countries. The Palma ratio in terms of earnings
is currently at about 10, which was also very high and which meant the top 10% of
income earners earned almost 11 times as much as the bottom 40%. And to make
matters worse, both the Gini coefficient and Palma ratio indicated an upward trend
over the 2011 – 2015 period. [Figure 22]
u Black Africans had the highest unemployment rates, followed by coloureds, then at
a much lower rate for Indian/Asians and then whites – about 4 or 5 times lower than
for black Africans. And labour wages were the major driver of expenditure, income
and asset inequality presented earlier. [Figure 23]
u Looking at the weight of the distribution of income for those that were employed,
the left side of the graph indicates lower and the right higher wages. This distribu-
tion mirrored earlier data that indicated there was a much lower mass in the black
distribution versus a much higher mass in the white distribution. [Figure 24]
u Assessing income distribution by gender – a horizontal assessment – it was evident
that males earned more on aggregate, as they were more likely to be employed
and, when they were employed, they earned more. [Figure 25]
u Assessing how differences in real earnings contributed to overall inequality over
a five-year period, it was evident that for the 10th, 50th and 90th percentiles there
had been almost no real growth in earnings, whereas for the 98th and 99th percen-
tiles there had been rapid growth. This indicated that inequality was exacerbated
by the growth in earnings of a small fraction of people. [Figure 26]
u Labour market dynamics and informality
w Job stability was considered to be an important welfare factor and for this rea-
son "employment churning" was measured over time (in two-year increments
over the 2008 – 2017 period) to assess at what rate people found or lost em-
ployment. Horizontal columns indicate where someone was at the time of the
survey and vertical columns indicate where someone would be two years later.
w Looking at the searching group (the row), it can be seen that 27.1% were still
searching two years later, 31.2% had found regular employment, 6.8% had
become self-employed (a proxy for informal sector employment) and 35% had
become NEA and dropped out of the labour market. [Figure 27]
w Similarly, of those who are employed, 75.6% were still employed two years later,
while almost 20% (one out of five) had lost their employment, which indicated a
high level of churn. [Figure 27]
24In conclusion to labour market inequality, employment in the informal and agricultural
sector was relatively low when compared to other countries. South Africa’s agricultural
sector was highly mechanised and the informal market, for unknown reasons, was very
small. Groups that were disadvantaged in the labour market were black Africans relative to
whites, females relative to males, and rural dwellers relative to urban dwellers. And finally,
groups who were more likely to find employment (higher education and higher earners)
earned higher wages and were less likely to lose that employment, thus exacerbating in-
equality.
Question and answer session – Labour market inequality
u Was there data on the top 98 and 99 percentile earners to explore the type of
work they did; why they had a lower churn and greater increase in earnings (was
it because of skills scarcity); and what could be done about it (for example, cap-
ping salaries in certain sectors)?
w This sector was not assessed specifically as it wasn’t the focus of this survey.
What is known from research by other organisations was that a significant
reason for the disparity was due to skills. In South Africa, the returns on higher
education were exceptionally high, and were getting higher. Capping salaries
was a difficult and delicate topic that needed to be discussed sensitively.
u Has the informal sector been studied in more detail to explore how it could be
expanded to absorb more unemployed people?
w South African economists have for some time been studying why the informal
sector was so small, but nobody had provided a good answer so far. What has
been done with more success was to profile people in this sector: who they
were, what they did, what their education, etc. And what was found was that
the informal sector was not just small, but profit levels were also very low, which
meant most participants were engaging in this sector at a subsistence level.
And, while it had a significant impact on poverty rates as a livelihood strategy, it
was unlikely to have a big impact on inequality.
u Why was the situation of the youth not been addressed in more detail? The NDP
talked about 60% of youth in 2012 having never worked.
w While there will be striking differences by age group, such disaggregation was
not done in this survey. There were some life-cycle assessments (people across
different ages), but it was complicated because age, unlike gender, did not stay
constant. The youth question was recognised as an important aspect and ongo-
ing research on the youth sector was being undertaken by other institutions.
u South Africa has massive spatial inequalities, so why was the significance of rural
to urban migration not considered, because this movement was quite successful
Stakeholder Engagement on Inequality Trends in South Africa 25for many individuals? And should urbanisation be taken more seriously to assist
people better in this regard, for example through better accommodation and
infrastructure?
w Migration was an important factor for finding jobs and for survival. If a job was
lost, a person could move back to their rural place of origin where it was less
expensive to live. It should be studied in more detail.
5.3 Social inequality
Research findings
Presented by Anda David, Research Officer, AFD
Obtaining a nuanced understanding of inequality required one to look beyond income, ex-
penditure and labour market access to a number of other basic service indicators. The ones
for which sufficiently reliable data was available, and which were covered in the survey report,
included access to services, education, health and the internet.
It was important to note that, while economic inequality has not changed much, the indica-
tors covered in this section were illustrating greater improvements.
For the period 2002 to 2017, unless noted otherwise, the following findings were highlighted:
Education
u Education indicators: over the 2002 to 2017 period, all the education indicators that
were measured had improved, including school attendance, learners benefitting
from no-fees policies, book availability and class sizes. [Figure 28]
u School nutrition programme: more than 90% of learners in all provinces, except
the Western Cape and Gauteng, have benefitted from the government’s nutrition
programme. [Figure 29]
u No-fee policy: learners from Limpopo, the Eastern Cape and the Free State, among
the poorest of the country’s provinces, were the major beneficiaries of the no-fee
policy. [Figure 30]
Health
u Access to medical aid: following an initial increase, the past few data points have
indicated a levelling off and then a decline in overall access to medical aid.
[Figure 31]
26u Access to medical aid by population group: black Africans were amongst the most
vulnerable and had the lowest access to medical aid coverage. Coloureds were the
second lowest. Inequality showed up vividly in this area, with a growing gap be-
tween access to medical aid for whites and Indians/Asians at the top and coloureds
and black Africans at the bottom. Only about 10% of black Africans had access to
medical aid, when compared to 72% for whites and 49% for Indians/Asians.
[Figure 32]
u Use of health facilities: this has revealed South Africa’s dual healthcare system
where, in 2017, more than 80% of black Africans used public health facilities, where-
as more than 85% of whites used private facilities. And between 2009 and 2017, the
situation did not change significantly for any population group. [Figure 33]
Basic services
u Access to basic services overall: this has seen an improvement in most areas
(electricity, sanitation, refuse removal) except for water, where after initial increases,
there has been a recent decline. [Figure 34]
u Access to electricity: high levels of access to electricity were reached, with rural
electricity access recently exceeding that in urban areas. [Figure 35]
u Access to electricity by province: KwaZulu-Natal and the Eastern Cape showed the
lowest level of access to electricity in 2011, with significant disparities apparent by
district. [Figure 36]
u Access to electricity by municipality: at this level specific municipalities could be
identified that have the lowest access to electricity (in 2011) within specific districts.
It was apparent that different municipalities within a district could have divergent
levels of access to electricity. [Figure 37]
u Access to electricity by population group: compared to other groups, black Af-
ricans had much lower levels of access, but also showed the largest increase be-
tween 2002 and 2016. [Figure 38]
u Access to water – rural versus urban: a large difference remained in the access to
water (by tap on site or within a dwelling) between rural and urban dwellers, with
urban households showing about 90% of access when compared to just 40% for
rural households. [Figure 39]
u Access to water by population group: black African-headed households reported
the lowest proportion of households with access to improved sanitation. [Figure 40]
Internet access
This indicator was included because it offered such an important means to access to other
social domains, such as education and the labour market.
Stakeholder Engagement on Inequality Trends in South Africa 27u Access to internet by population group: between 2009 and 2017, access has
increased for all groups, but mostly so for black Africans households (off a very low
base) who have now reached about 58% access. [Figure 41]
Question and answer session – Social inequality
u To what extent was electricity access affordable, particularly assessing electricity
expenditure as a percentage of income?
w The survey team did think about including assessments on affordability, as well
as on quality of access and what the electricity was used for. Unfortunately, the
annual general household surveys only recently included questions on elec-
tricity access and affordability. So only limited data was available, and this was
complicated further because many households also received some free electri-
city. That said, future surveys might address these indicators.
u How was access to electricity determined, given the surprising findings that rural
was now ahead of urban access? How were households connected, was it an
illegal or informal sector connection? And what about multiple uses of fuels in the
determination of broader energy inequality?
w Not answered
u Why was access to transport not covered as an indicator? And what role did
transport (and access to other infrastructures) play across different population
groups to enhance income and as a measure for broader economic participation
in the labour market and beyond?
w Transport was undoubtedly an important inequality indicator because it has the
potential to impact several other indicators, such as education, job access and
access to health services. Extensive discussions were held within the project
team on what transport indicators would be relevant for inequality and it was
hoped that some of these would be included in future surveys.
w Stats SA, in partnership with the Department of Transport, was about to con-
duct the 2020 National Household Travel Survey, which was last done in 2013.
The results of this survey, which will offer interesting insights into the question
of transport, will probably be available towards the end of 2020.
u In the education assessments, why was no data included on spend per pupil and
disaggregated by province, race and school? What probably would be seen is
that the per pupil spend in provinces like the Western Cape and Gauteng would
be higher and that their educational performance would similarly also be higher.
w There was, regretfully, no single data set that could provide all the answers, and
28You can also read