INVEST IN CAPE TOWN 2017/18 - Regional Market Analysis and Intelligence - GreenCape

Page created by Virgil Coleman
 
CONTINUE READING
INVEST IN CAPE TOWN 2017/18 - Regional Market Analysis and Intelligence - GreenCape
• 2017/18 •

                                             INVEST IN
                                            CAPE TOWN

Regional Market Analysis and Intelligence
INVEST IN CAPE TOWN 2017/18 - Regional Market Analysis and Intelligence - GreenCape
The Bo Kaap.
It may be one of the most photographed areas of the
Mother City, but brightly painted houses and quaint
cobbled streets aren’t the only reasons to visit the Bo Kaap.
This part of Cape Town is packed full of history and culture.
INVEST IN CAPE TOWN 2017/18 - Regional Market Analysis and Intelligence - GreenCape
contents •

Contents
       INTRODUCTION
       FOREWORD
       1.

       2.
       3
              SOUTH AFRICA AT A GLANCE
            1.		 Competitiveness
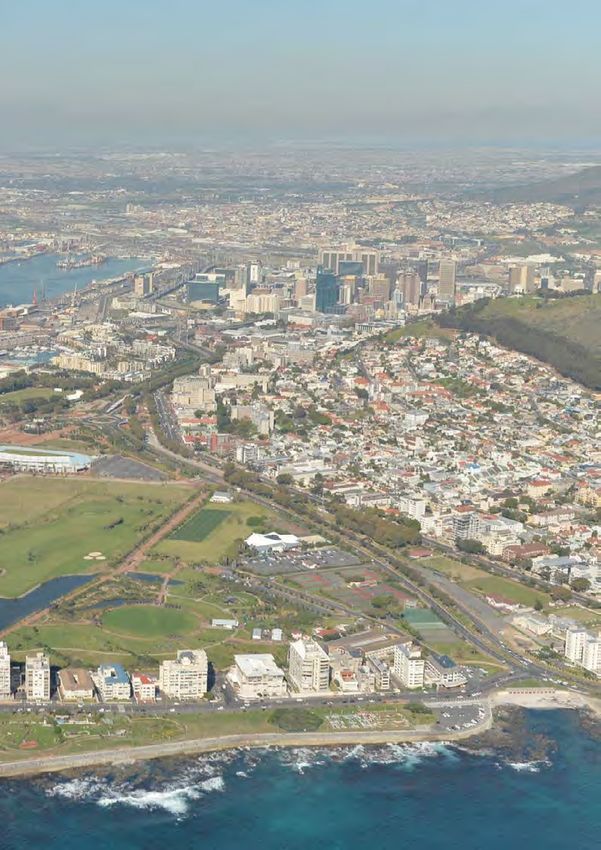
              CAPE TOWN: A WORLD CLASS CITY
              CAPE TOWN AT A GLANCE
                                                                3
                                                                4
                                                                8
                                                                8
                                                                9
                                                                10
            3.1 Education and skills                            10
            3.2 Employment profile                              10
            3.3 Cape Town’s economy                             12
            3.4 Doing Business                                  14
            3.5 Trade and Foreign Direct Investment profile     15
            3.6 Good governance                                 20
            3.7 City Initiatives                                20
            3.8 Infrastructure and Costs                        20
            3.9 Cape Town Accolades                             27
       4.     SECTORAL POCKETS OF EXCELLENCE                    28
            4.1 Business Services                               28
               4.1.1 Business Process Outsourcing               29
               4.1.2 Information Communication Technology       31
            4.2 Financial services                              33
            4.3 Film and Multimedia                             33
            4.4 Tourism		                                       36
            4.5 Renewable Energy                                39
            4.6 Electronics                                     41
            4.7 Food and Beverages                              42
            4.8 Clothing and Textiles                           44
       5.     regulations & LEGISLATION                         46
       6.     ACCESS TO INTERNATIONAL MARKETS                   47
       7.     KEY INCENTIVES                                    48
       8.     KEY CONTACTS                                      50
       9.     REFERENCE LIST                                    52

                                                       invest in cape town 2017/18 |   01
INVEST IN CAPE TOWN 2017/18 - Regional Market Analysis and Intelligence - GreenCape
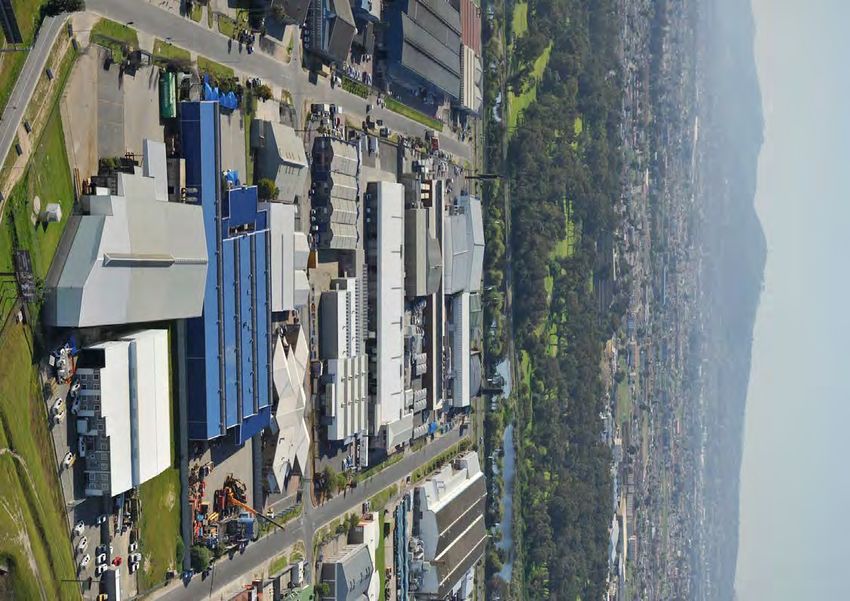
02 | invest in cape town 2017/18
INVEST IN CAPE TOWN 2017/18 - Regional Market Analysis and Intelligence - GreenCape
introduction •

INtroduction
This document has been developed to showcase the current investment climate
within Cape Town for potential investors. This will enable more enlightened business
decisions. The document identifies the opportunities afforded to businesses; and
provides information on eight identified sectors of the economy that present high
growth sectors for investment. Facilitated by the combined efforts of the general
public, private sector and public sector; these incentives, developments and
economic growth sectors essentially present current and future investors with a
growing business and investor friendly environment in which to operate.

Already home to several top international listed companies, Cape Town is currently
regarded as one of the best cities in Africa to invest.

The city is digitally connected, offers a favourable lifestyle, sound infrastructure, a
skilled and energetic workforce, four top universities and two globally recognised
business schools, local government support and is Africa’s tech and innovation hub.
The world-class central business district is a safe, bustling centre of commerce and
retail activity.

Contacts for more information

Catalytic Sectors Unit                                    Investment Promotion
Faith Kolala                                              James Milne
Tel: +27 21 417 4020                                      Tel: +27 21 487 8678
Email: Faith.Kolala@capetown.gov.za                       Email: james@wesgro.co.za
Atlantis Investment Facilitation Office                   Research
Timothy Hadingham                                         Julius Okiror
Tel: +27 21 417 0518                                      Tel: +27 21 487 4842
Email: Timothy.Hadingham@capetown.gov.za                  Email: julius@wesgro.co.za
Further like to acknowledge the contribution              Further like to acknowledge the
from the City of Cape Town: Lance Greyling,               contribution from Wesgro:
Meagan Jooste, Nazli Laatoe, Rory Viljoen,                Cornelis Van der Waal, Jodie Posen,
Layarn Booley and Paul Court.                             Levurne Goodman, and Latecia Philips.

                                                             invest in cape town 2017/18 |   03
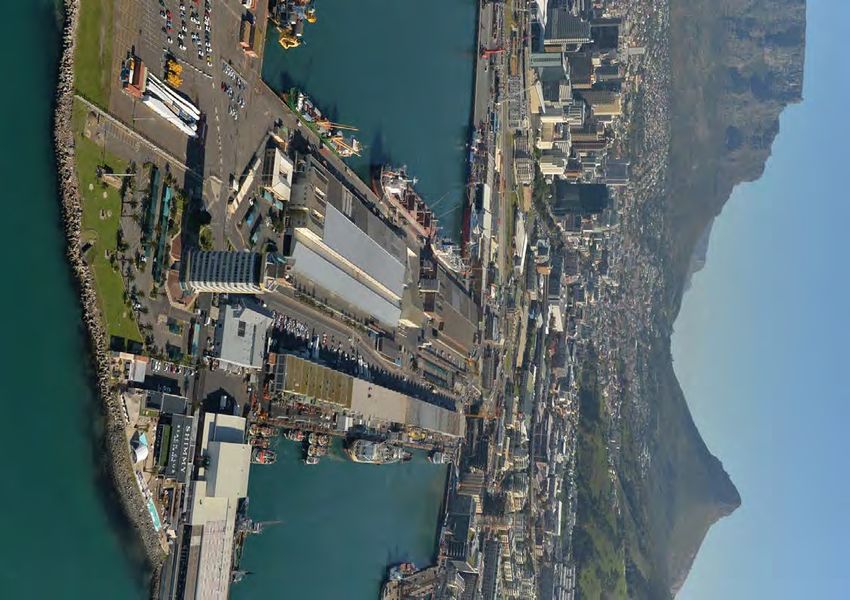
INVEST IN CAPE TOWN 2017/18 - Regional Market Analysis and Intelligence - GreenCape
• forEwOrd

                            I am excited to present the latest ‘Invest                City. These successes speak for themselves and we
                            in Cape Town’ brochure for 2017/18. This                  are proud of the fact that these investors in most
                                                                                      instances often act as ambassadors by encouraging
                            brochure is packed full of information on
                                                                                      other businesses to locate in Cape Town.
                            the Cape Town business environment which
                                                                                      The City’s Economic Growth Strategy has paid off
                            ranges from the attractive attributes of Cape
                                                                                      with more investors coming to Cape Town to open
                            Town to sectoral pockets of excellence and                businesses. We are the tech hub and green economy
                            incentives. This information plays a critical             capital of Africa.
                            role in providing potential investors and
                            businesses alike with key information they                A key indicator of the success of the City’s Economic
                            need around doing business in Cape Town.                  Growth Strategy is that in December 2016, Cape Town
                                                                                      was ranked 21st in the world for our foreign direct
FOREWORD
                            Cape Town is a fast growing investment destination.       investment strategy by FDI Intelligence – a division of
                            The city has a diverse population with many different     the Financial Times. The only African city to appear on
                            cultures, racial groups and nationalities found in        this list.
                            our City. Our residents are our greatest asset and the
                            diversity of the population makes it an ideal place to    We are positioning Cape Town as a globally
                            work, live and play as well as invest.                    competitive business destination and our message
                                                                                      is clear, we are open for business. The Cape Town
                            Cape Town continues to receive interest as an             economy is diverse with flourishing sectors such
                            investment destination and is the ideal springboard       as business process outsourcing, green economy
                            for investors looking to expand their operations          (renewable energy), ICT and electronics and clothing
                            across the African continent. The City of Cape Town,      and textiles, among others, contributing significantly
                            in its investment attraction efforts, collaborates with   to the growth of the economy.
                            various stakeholders in profiling and promoting
                            Cape Town as a lucrative investment destination. It       In addition to having high growth sectors, Cape Town
                            must be emphasized that partners play a vital role in     has one of the busiest and well developed container
                            promoting Cape Town as an investment destination.         ports in South Africa and the second busiest airport in
                            Cape Town boasts many success stories of numerous         the country. The City is working with key stakeholders
                            local and international investors who have made a         to effectively utilize these ports and has a dedicated
                            business decision to locate their operations in the       Air Access team tasked with increasing direct flights to

                          A key indicator of the success of the City’s
                          Economic Growth Strategy is that in December
                          2016, Cape Town was ranked 21st in the world
                          for our foreign direct investment strategy by FDI
                          Intelligence – a division of the Financial Times.
                          The only African city to appear on this list.

04 | invest in cape town 2017/18
INVEST IN CAPE TOWN 2017/18 - Regional Market Analysis and Intelligence - GreenCape
forEwOrd •

Cape Town to increase air access to and from Cape Town      Over the next five years the City of Cape Town has
to boost investment and tourism. These initiatives are      set as one of its strategic priorities the positioning of
being implemented together with key stakeholders like       Cape Town as a forward-looking, globally competitive
Wesgro, Provincial Government of the Western Cape           business city. Last year the ‘Invest Cape Town’ initiative
and ACSA.                                                   was launched. It was the start of a process to develop a
Cape Town is the second-most-important contributor to       business brand narrative that emphasises the unique
national employment. As a result, employment creation       characteristics of the city-region. ‘Invest Cape Town’
and unemployment reduction are top priorities for the       focuses on crafting an authentic narrative about what
City. The industries in which Cape Town has the most        Cape Town stands for as an investment destination,
pronounced comparative advantages compared to the           building on the compelling success stories and
country as a whole are fishing, real estate, textiles and   competitive advantages of the destination. The essence
clothing, hotels and restaurants, and food and beverage     of the narrative is that Cape Town is a functional African
manufacturing.                                              hub where ideas come to life through the energy and
                                                            ambition of its people.
Cape Town is widely considered to be one the most
desirable lifestyle cities in the world and has won many    I am therefore inviting those investors who are thinking
accolades and awards in recent years.                       of doing business in Africa to consider Cape Town as a
                                                            switched-on, in-tune and globally connected city with a
In 2017, Cape Town has once again been crowned the          business ecosystem driven by innovation and creativity.
number one city in Africa for business tourism events by
the International Congress and Convention Association       Cape Town is Africa’s ideas centre.
(ICCA). This has been the fourth consecutive win for the
City. However, no destination is without its challenges.
Cape Town is experiencing an unprecedented drought
                                                            Patricia de Lille
                                                            Executive Mayor , CIty of Cape Town
but the City is being pro -active in ploughing all its
resources into New Accelerated Supply Schemes as
part of our Water Resilience Strategy to alleviate this
challenge in the short, medium and long term.

                                                                                                  invest in cape town 2017/18 |   05
INVEST IN CAPE TOWN 2017/18 - Regional Market Analysis and Intelligence - GreenCape
InvestSA, One Stop Shop
The InvestSA One Stop Shop Western Cape, operated by Wesgro and the Western Cape Government, is a multi-faceted
collaboration between National, Provincial and Local Government. The primary objective of the facility is to cut the ‘red tape’ that
may be experienced by investors seeking to set up or expand business interests in the South African market.

The initiative clusters key government departments and agencies under one roof, creating the convenience of providing investors
with a single point of service. Our offering includes but is not limited to: providing an accessible entry point for investors in need of
regulatory compliance; enhancing regulatory and legal processes; improving approval turnaround timeframes; providing information
on incentives (tax, land, training, free trade zones etc.); providing pre-approval information (market data, costs, incentives, project
approval, local partners, etc.); and providing post approval information (facilitation of permit approvals, information relating to import
of equipment & raw materials, central bank profit repatriation etc.) to investors.

                                                  WESTERN CAPE
                                                             operated by

                  InvestSA, One Stop Shop (Western Cape) | 46 St George’s Mall | Cape Sun Corner Cape Town
                              Email: zaheer@wesgro.co.za / salman@wesgro.co.za | Tel: 021 023 0900
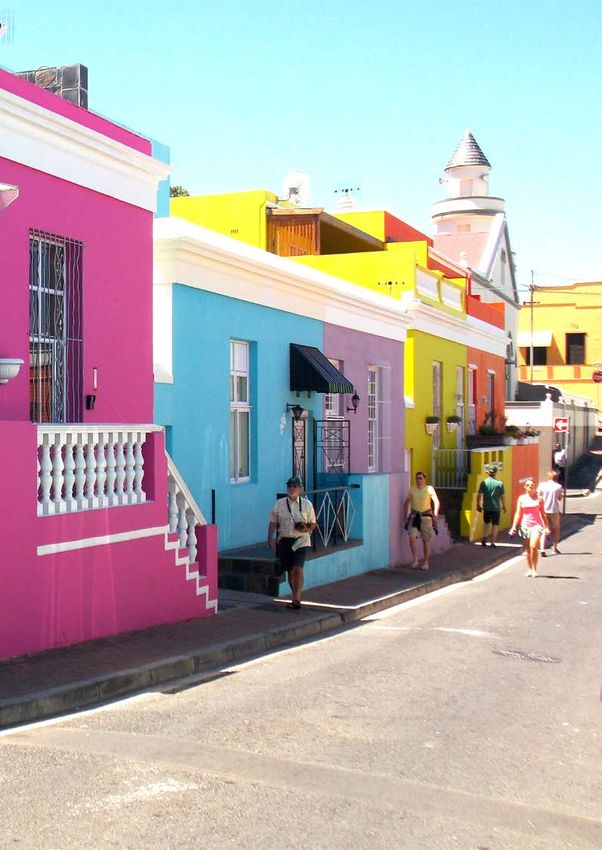
INVEST IN CAPE TOWN 2017/18 - Regional Market Analysis and Intelligence - GreenCape
forEwOrd •

Cape Town has emerged as the
                                 FOREWORD
innovation and ideas capital of both
                                                     economic value of R9billion resulting in 781
                                                     jobs. In addition, the unit facilitated a total of
                                                                                                          So far the initiative has managed to secure
                                                                                                          10 new routes and facilitated 11 route
                                                     three “Outward Foreign Direct Investment”            expansions in the last two years. This has
South Africa and the continent.
                                                     projects into Africa to the value of R507            resulted in more than 700,000 additional
                                                     million.                                             seats to Cape Town International.
As the new regional hub for the ‘sharing
economy’, we are leading in areas such as
                                                     Wesgro’s investment unit continues to be             Another excellent example of collaboration,
tech entrepreneurship and the new economy.
                                                     at the forefront of proactively recruiting           which will equally boost investment and
                                                     investments into the Cape. The unit realised         economic growth in the Mother City is the
Our natural beauty, an award-winning
                                                     a total of 12 investment projects, to the value      Cape Investor Centre.
tourism offering, and world-class
                                                     of more than R2billion during the financial
infrastructure have helped put our city on the
                                                     year 2016-2017.                                      This InvestSA One Stop Shop is jointly
map, but if you are looking to do business in
                                                                                                          operated by Wesgro, the Western Cape
Africa, Cape Town is emerging as an obvious
                                                     This has assisted in the facilitation of 696         Department of Economic Development and
choice.
                                                     jobs and helped to grow Cape Town’s                  Tourism and the Department of Trade and
                                                     industrial base. A collaborative public-private      Industry, and includes a dedicated office
This is precisely why several global
                                                     partnership which we are very proud of is the        space for the City of Cape Town’s Invest Cape
companies base their African regional
                                                     Cape Town Air Access initiative.                     Town staff.
headquarters in the city. It is also why
Wesgro’s trade promotion programme
                                                     This project, which was launched in 2015, is         By housing some 13 local, provincial and
has made the rest of Africa its top priority,
                                                     a partnership between Wesgro, the City of            national stakeholders in one space we will be
helping ensure that Cape Town is positioned
                                                     Cape Town, the Western Cape Government,              better able to assist investors in completing
as a gateway to the largest consumer block in
                                                     Airports Company South Africa, South African         the regulatory processes needed to invest in
the world emerging on the continent.
                                                     Tourism and Cape Town Tourism. It also               Cape Town.
                                                     includes support from leading private sector
We now measure the rand value of exports
                                                     companies.                                           I’m confident that these new initiatives will
facilitated into the rest of Africa as well as the
                                                                                                          increase the global competitiveness of Cape
outward foreign direct investment by Cape
                                                     Its key objective is to land more direct routes      Town and will continue to make the city an
companies into the continent.
                                                     to Cape Town International Airport, boosting         inspiring place to do business in Africa.
                                                     arrivals into the City. The ripple on effect of
During the last financial year (2016-2017),
the Trade team facilitated a total of 41
                                                     this on both tourism and business has been
                                                     significant.
                                                                                                          Tim Harris
business agreements with an estimated                                                                     Chief Executive Officer

                                                                                                                  invest in cape town 2017/18 |   07
INVEST IN CAPE TOWN 2017/18 - Regional Market Analysis and Intelligence - GreenCape
• south africa at a glance

01 South Africa at a glance
             1.1 competitiveness
             In 2016, South Africa was the 30th largest global destination market for greenfield
             investment out of 175 countries. The country was the largest destination and source
             market for greenfield investment on the African continent (FDI Markets, 2017).

                                                      KEY COMPETITIVE INDICATORS, 2016
 INDICATOR                                                  SOUTH AFRICA              BRAZIL               CHINA                INDIA                RUSSIA

                                                                         DEMOGRAPHICS
 Population (millions)                                           55.9                  206.1               1 382.7             1 309.3               143.44
 Life Expectancy at birth (years) 2013                           63.1                   73.8                75.5                 68.5                 70.8
 Unemployment rate (%)                                            27                     11                   4                  4.8                       6

                                                                          THE ECONOMY
 Gross Domestic Province Purchasing Power
                                                                 739                   3 141               21 292               8 662                 3 800
 Parity (USD, billions)
 GDP per capita (USD)                                           13 500                14 800               14 500               6 700                26 000
 GDP (PPP) as share (%) of world total                            0.6                   2.6                 17.8                 7.2                   3.2
 Total Investment (% of GDP) 2014                                19.5                   17.5                44.1                 31.4                 25.6
 Gross national savings (% of GDP)                                16                     16                  46                   30                   16
 Average Inflation rate (%)                                       6.3                   8.7                  2.0                 4.9                   7.0

                                                                         COMPETITIVENESS
 Global Competitiveness ranking (/138)                            47                     81                  28                   39                   43
 Travel and Tourism Competitiveness (/136)                        53                     27                  15                   40                   43
 Information Communications Technology
                                                                  65                     72                  59                   91                       -
 networked readiness ranking (/136)
 Quality of overall infrastructure (/144)                         58                    107                  51                   69                   101
 Literacy rate (%)                                               94.4                   92.6                96.4                 71.2                 99.7

             Sources: International Monetary Fund World Data (2017), The Global Competitiveness Report • 2016 - 2017 ( 2017) and A World Factbook (2017)

08 | invest in cape town 2017/18
cape town: a world class city •

                                                                      In 2016, South Africa was the 30th largest
                                                                      global destination market for greenfield
                                                                      investment out of 175 countries.

                                                Key economic indicators of Cape Town

02
                                                                                      2016 Regional GDP
                                                                                      (GDP-R, current prices)

                                               Population (2016)
                                               4 012 441
                                                                                      R413bn
Cape Town:
a world                                        6,3%                                   91,7%
                                                                                      Functional
                                                                                                                0,75
                                               Inflation
class city
                                                                                                                 2016 Human
                                               (average for Western Cape)             literacy (2016)            Development
                                                                                                                 Index (HDI)
Cape Town has a sophisticated, diverse         Ethnic groups                                                      Source: City of
and dynamic economy, and is a regional         Black African (39,9%)                                              Cape Town, 2017;
hub for entrepreneurship and innovation.       Coloured (42%)                                                     Statistics South
Cape Town companies have a strong              Asian/Indian (0,9%)                                                Africa, 2017;
                                                                                                                  Quantec,2017;
footprint across the African continent and     White (17,2%)                                                      IHS Markit, 2017
in a number of other regions across the
globe.

The city is the main economic base                 Comparative analysis of Cape Town and other South African cities
for the Western Cape and the second                                                                    Tsh-
                                                                                                                 eThe-
most important contributor to national                                        Cape       Johan-       wane                 Ekurhu-
                                              Indicators                                                         kwini
employment among South African                                                Town       nesburg     (Preto-                 leni
                                                                                                               (Durban)
cities. Cape Town has also consistently                                                                ria)
recorded higher economic growth rates         Population (millions) (2016)     4,01        4,93        3,29       3,66       3,45
than the national economy in the past
                                              Population average annual
5 years, showing impressive resilience                                        1,53%       2,57%      2,54%       1,30%      1,46%
                                              growth rate (2011 – 2016)
during a challenging post-recession
period for South Africa. The city boasts      Average annual GDP-R
                                              growth (constant prices,        2,9%        2,9%        3,7%       3,1%       2,8%
spectacular natural scenery and is a          2011-2016)
renowned tourist destination, receiving
a number of international accolades, but,     Average annual GDP-R
                                              growth (constant prices,        2,4%        2,2%        2,8%       2,3%       2,2%
with a ranking of just 11 as the cheapest     2006-2016)
place for expatriates out of 209 cities on
Mercer’s Cost of Living Index – and 4th       Exports (R billions, 2016)      78,7         314,3      162,4       65,4       73,5
cheapest amongst African cities - remains     Foreign Direct Investment
an affordable place to live in and to do      (FDI) Projects (Total number,    307         561           53        73        N/A
business.                                     2003-2016)

                                             Sources: Statistics South Africa, 2017; IHS Markit, 2017;
                                             Quantec, 2017; FDI Intelligence, 2017

                                                                                                   invest in cape town 2017/18 |    09
• cape town at a glance

03
Cape Town at a glance
 3.1 Education & skills
                                                                                                       Figure 1: Western Cape Graduates
                                                                                                            by Qualification, 2015

                                                                                              70%       66%
Cape Town has four tertiary education institutions:
1. University of Cape Town (highest QS World Ranking amongst African universities);           60%
2. University of Stellenbosch Business School;                                                50%
3. University of the Western Cape; and,
4. Cape Peninsula University of Technology.                                                   40%

                                                                                              30%
In addition, the University of Stellenbosch (second highest QS World Ranking amongst                                 21%
                                                                                              20%
South African universities) is located just outside of the city’s boundaries.                                                      11%
                                                                                              10%
                                                                                                                                                 2%
In 2015, approximately 49 886 students were enrolled in the four Western Cape
                                                                                               0%
universities (the three Cape Town universities and Stellenbosch University) in the
                                                                                                        te

                                                                                                                       s

                                                                                                                                   s

                                                                                                                                                   e
                                                                                                                    les

                                                                                                                                 ter

                                                                                                                                               rat
Science, Engineering and Technology fields and 11 496 students graduated in
                                                                                                       ua

                                                                                                                               as

                                                                                                                                             cto
                                                                                                                         s
                                                                                                                    te
                                                                                                       rad

                                                                                                                      ter

                                                                                                                              M
                                                                                                                ua

                                                                                                                                           Do
the same field of study (Cape Higher Education Consortium (CHEC), 2015). Of the
                                                                                                    rg

                                                                                                                     as
                                                                                                               rad
                                                                                                 de

                                                                                                                    M
                                                                                                              tg
                                                                                               Un

Province’s graduates in 2015, 66% obtained Undergraduate degrees, 21% completed
                                                                                                                s
                                                                                                             Po

postgraduate degrees, 11% completed Masters and 2% obtained Doctorates.                       Source: CHEC, UCT: Standardized Regional Statistics, (2017)

                                                                     3.2 Employment profile
           Figure 2: Western Cape Graduates
        by Classification of Educational Subject
                  Material (CESM), 2015

                                                                              Cape Town’s employment indicators, 2016
41%                                                                 Population aged 15-64 years
                                                 28%                                                                             Employed
                     Source: CHEC
                      Standardized
                                                                      2 792 137                                             1 483 358
                   Regional Statistics,

                                                                                                             Labour Force
                         (2017)

                                                  8%                                                         Participation Rate

                        23%                                          Not Economically Active 871 657
                 Science Engineering Technology                       Strict                                               Strictly Unemployed
                 Other Humanities
                 Education
                                                                      unemployment
                                                                      rate                                                     437 123
                 Business/Commerce/Management                        Source: Statistics South Africa, 2017

10 | invest in cape town 2017/18
cape town at a glance •

Cape Town’s top employing sectors were the finance, community and social services, and trade sectors. The
finance and business services sector employed the largest number of skilled individuals in 2016 (280 983) and
the manufacturing sector employed the largest number of semi-skilled and unskilled individuals (102 284).

Figure 3: Sectoral employment split in Cape Town, 2016

           Private households                                                                                                             280 983
  Community and social sciences                                                                                                               finance and
                       Finance
                     Transport                                                                                                             business services
                          Trade                                                                                                           employed the largest
                  Construction                                                                                                             number of skilled
                        Utilities
                Manufacturing                                                                                                              individuals. (2016)
                        Mining
                    Agriculture
                                    -       50 000 100 000 150 000 200 000 250 000 300 000 350 000
            Formal skilled labour           Formal semi-skilled and un-skilled labour               Informal labour
                                            Source: Statistics South Africa, 2017

A challenging macroeconomic climate at a national level,            compared to the country as a whole and the other
has seen fluctuations in the unemployment rate over the             metros (see Figure 4), lies in the relatively small
past two years. Cape Town has, nevertheless, maintained             number of discouraged work-seekers in the city.
a strict unemployment rate which is slightly below the              This reflects on a labour market which, while not
national strict rate, and an expanded unemployment                  always providing sufficient employment
rate which is over 10 percentage points lower than the              opportunities to absorb new labour entrants,
comparable national rate. The reason for Cape Town’s                continues to sustain a strong level of participation
comparatively low expanded unemployment rate, both                  and active job seeking.

Figure 4: Unemployment rate trends in Cape Town relative to the national average, 2011-2016
40%

35%

30%
                                                                                                                                           Cape Town has
25%                                                                                                                                        an expanded
                                                                                                                                           unemployment
20%
      Q1 Q2 Q3 Q4 Q1 Q2 Q3 Q4 Q1 Q2 Q3 Q4 Q1 Q2 Q3 Q4 Q1 Q2 Q3 Q4 Q1 Q2 Q3 Q4                                                              rate which
          2011        2012        2013        2014        2015        2016
               Cape Town strict unemployment rate                              Cape Town broad unemployment rate
                                                                                                                                           is over 10
               South Africa strict unemployment rate                           South Africa broad unemployment rate                        percentage
                                                                                                                                           points lower
Figure 5: Strict versus broad unemployment rate trend across South African cities, 2016
                                                                                                                                           than the
                                                                                                       29.3%
                                                                                                                                           comparable
                    Tshwane                                                                   25.8%
                                                                                                                                           national rate...
                                                                                                               32.4%
         Nelson Mandela Bay                                                                                   31.7%

        City of Johannesburg                                                                                  31.7%
                                                                                                      28.7%
                                                                                                                        36.4%
                 Ekurhhuleni                                                                                    32.9%
                                                                                                   27.9%
                  eThekweni                                                         20.2%
                                                                                                                   Broad           Strict
                                                                                          24.0%
            City of Cape Town                                                           22.8%                    Source: Statistics South Africa, 2017

                                                                                                                                  invest in cape town 2017/18 |   11
• Cape Town’s economy

3.3	Cape Town’s economy
As a global mid-sized developing city, Cape Town acts as a magnet for talent, investment and production, utilising
economies of scale to grow faster than the broader region in which it is located. The city, nevertheless, as shown in Figure
6 below, finds itself affected by economic shocks to the national economy. The city’s GDP-R grew by an average of 2,1%
between 2012 and 2016, on average growing 0,5 percentage points faster than the national economy during this time.

      Figure 6: Growth in GDP-R at constant 2010 prices in Cape Town (%), 2006-2016

                                       7.0%

                                       6.0%
 Growth In GDP-R, 2006-2016

                                       5.0%

                                       4.0%

                                       3.0%

                                       2.0%

                                       1.0%

                                       0.0%

                                      -1.0%

                                      -2.0%
                                                 2006    2007       2008      2009    2010        2011     2012       2013      2014       2015   2016
                               Cape Town         5.7%    6.5%       4.2%      -1.2%   2.6%        4.0%         3.2%   2.3%       2.2%      1.7%   1.0%
                               South Africa      5.3%    5.4%       3.2%      -1.5%   3.0%        3.3%         2.2%   2.5%       1.7%      1.3%   0.3%
        Source: IHS Markit, 2017                                      Cape Town                 South Africa

                                           17%    The biggest economic sector, by value, in Cape Town in 2016 was the finance and business
                              35%                 services sector, contributing R96,9 billion (35% of GDP-R at constant 2010 prices), while
                                           15%    manufacturing contributed R40,7 billion (15%), and community services contributed
                                                  R47,8 billion (17%).

Table 4: Breakdown of Cape Town’s GVA by sector (2011-2016, R millions)

        SECTOR BREAKDOWN OF GVA FOR CAPE TOWN (2011 – 2016, R millions)
        Broad economic sector                           2011           2012           2013            2014            2015              2016       % Share, 2016
        Agriculture                                        2 331            2 408        2 519            2 678         2 664            2 506            1%
        Mining                                              426             431           436             466            484              467             0%
        Manufacturing                                     39 281           40 195       40 686           40 600         40 476           40 742          15%
        Electricity                                        4 908            5 225        4 151            4 733         4 461            3 319            1%
        Construction                                       9 024            9 312        9 794           10 171         10 414           10 520           4%
        Trade                                             40 229           41 948       43 044           43 895         44 699           45 402          16%
        Transport                                         27 770           28 392       29 124           30 033         30 222           30 241          11%
        Finance & business services                       84 097           86 836       89 401           91 411         94 666           96 944          35%
        Community services                                42 097           43 632       45 435           46 660         46 996           47 786          17%
        Total Industries                                  250 162          258 378      264 591          270 646       275 082          277 928          100%

 Source: IHS Markit, 2017

12 | invest in cape town 2017/18
cApe town’s economy •

Strong growth was demonstrated between 2011 and 2016 for the finance and construction sectors with average annual growth rates of
3,2% and 3,1%, respectively. Following closely were the community service and trade sectors with average annual growth of 3% each.

      Figure 7: GDP-R growth performance of sectors in Cape Town, 2011-2016

                                                                                 Community services                                                              3.0%
                                                                                           Finance                                                                  3.2%
                                                                                         Transport                                                 2.1%
                                                                                                Trade                                                           3.0%
                                                                                         Construction                                                             3.1%
                                                                                                             Electricity
                    -5.6%
                                                                                      Manufacturing                                1.2%
                                                                                            Mining                                                     2.4%
                                                                                         Agriculture                                               2.1%
    -70%           -6.0%          -5.0%          -4.0%         -3.0%       -2.0%        -1.0%           0.0%               1.0%             2.0%          3.0%             4.0%

                            Source: IHS Markit, 2017                           2011 - 2016

Detailed sectoral breakdowns
Cape Town’s fuel, petroleum, chemical and rubber products (26%)                                 The largest sub-sectors of tertiary activities were finance and
and food, beverages and tobacco products (25%) sub-sectors were the                             insurance (20%), real estate activities (15%) and retail trade
largest contributors to the manufacturing sector.                                               and repairs of goods (10%).

                Figure 8: Sub-sectoral breakdown                                                                Figure 9: Sub-sectoral breakdown
                of the manufacturing sector, 2016                                                                   of the tertiary sector, 2016

                                      2%                                                                                               1%
                                 3%                                                                                            3% 2%
                           4%                                                                                          4%
                   5%                                                                                                                                   20%
                                                                                                                5%
                                                         26%
           7%                                                                                              6%

                                                                                                        6%
        7%
                                                                                                                                                                    15%
                                                                                                          6%
             10%
                                                                                                                6%
                                                         25%
                                                                                                                                                          10%
                           11%                                                                                           7%
                                                                                                                                        9%
                                                                           Source: IHS Markit, 2017

                   Fuel, petroleum, chemical & rubber products
                   Food, beverages & tobacco products
                                                                                                      Finance & Insurance                            Public administration & defence activities
                    Wood & wood products
                                                                                                      Real estate Activities                        Land & water transport
                    Metal products, machinery & household appliances
                                                                                                      Retail trade & repairs of goods               Post & telecoms
                   Furniture & other items NEC & recycling
                                                                                                      Other business activities                     Education
                   Textiles, clothing & leather goods
                                                                                                      Wholesale & commission trade                  Air transport & supporting activities
                    Transport equipment
                                                                                                      Health & social work                          Sales & repairs of motors vehicles, sale of fuel
                   Other non-metallic mineral products
                                                                                                      Other service activities                      Hotels & restaurants
                    Electrical machinery & apparatus
                    Electronic, sound/vision, medical & other appliances

                                                                                                                                              invest in cape town 2017/18 |                 13
• doing business

       3.4 	Doing Business
       The 2017 Doing Business report found that South Africa ranked 74th globally amongst the 190 countries reviewed.
       South Africa fared better in terms of: getting credit, protecting minority investors and paying taxes in terms of its distance to the
       frontier score (DTF)1 when measured against China, Tunisia, Botswana and Turkey2. Cape Town fared better than other South African
       metropolitan municipalities in terms of dealing with construction permits and getting electricity.

                             South africa’s ‘doing business’ performance (2017)

                       100
                        90
Distance to Frontier

                        80
                        70
    (DTF) Score

                        60
                        50
                        40
                        30
                        20
                        10
                         0
                                 s

                                           its

                                                         y

                                                                        y

                                                                                      it

                                                                                                   s

                                                                                                                     s

                                                                                                                                rs

                                                                                                                                            cts

                                                                                                                                                         cy
                               es

                                                                                                  tor

                                                                                                                  xe
                                                        cit

                                                                      ert

                                                                                    red

                                                                                                                               de

                                                                                                                                                        en
                                        erm

                                                                                                                                            tra
                             sin

                                                                                                               Ta
                                                        tri

                                                                                                es
                                                                        p

                                                                                                                             or

                                                                                                                                                     olv
                                                                                 gC
                                                                    Pro

                                                                                                                                        on
                                                     lec

                                                                                                          ing
                                                                                               nv
                           bu

                                      nP

                                                                                                                               B

                                                                                                                                                   Ins
                                                                                                                                      gC
                                                                                  n

                                                                                                                            ss
                                                 gE

                                                                                              yI
                                                               ng

                                                                                                            y
                                                                              tti
                        ga

                                     tio

                                                                                                         Pa

                                                                                                                         ro
                                                                                           rit

                                                                                                                                                  ing
                                                                                                                                      cin
                                                                            Ge
                                                    n

                                                               eri
                                   uc

                                                                                                                     ac
                       tin

                                                tti

                                                                                          ino

                                                                                                                                   for
                                                              ist
                                  str

                                                                                                                                              olv
                                                Ge

                                                                                                                  ing
                       r
                   Sta

                                                                                          M
                                                            g

                                                                                                                               En
                                  n

                                                                                                                                               s
                                                         Re

                                                                                                                    d
                               Co

                                                                                                                                            Re
                                                                                     ng

                                                                                                                Tra
                                                                                    cti
                             th
                             wi

                                                                                  te
                                                                              Pro
                         ng
                         ali
                       De

                                        China        Tunisia         South Africa             Botswana          Turkey        Source: The World Bank (2017)

                             South africa’s ‘doing business’ relative performance (2015)

                        90

                        80
                        70                                                                                                                     Buffalo City
Distance to Frontier

                                                                                                                                               Cape Town
    (DTF) Score

                        60
                                                                                                                                               Ekurhuleni
                        50
                                                                                                                                               eThekwini
                        40                                                                                                                     Johannesburg
                        30                                                                                                                     Mangaung
                                                                                                                                               Msunduzi
                        20
                                                                                                                                               Nelson Mandela Bay
                        10
                                                                                                                                               Tshwane
                         0
                                   Starting a        Dealing with            Getting             Registering             Enforcing
                                   business          construction           electricity           property               contracts           Source: The World Bank (2016)
                                                       permits

  1  The distance to frontier (DTF) score helps assess the absolute level of regulatory performance over time. It measures the distance of each economy to the “frontier,” which
    represents the best performance observed on each of the indicators across all economies in the Doing Business sample since 2005. An economy’s distance to frontier is
    reflected on a scale from 0 to 100, where 0 represents the lowest performance and 100 represents the frontier.
  2 These countries were chosen as a comparison to South Africa as they rank close to South Africa’s total 2017 DTF score of 65.2. Botswana’s DTF score is 65.55; China (64.28
    DTF); Tunisia (64.89 DTF) and Turkey (67.19 DTF).

14 | invest in cape town 2017/18
trade and foreign direct investment profile •

3.5	Trade and Foreign Direct Investment profile
               3.5.1 	Exports and Imports
                Cape Town accounted for 69% of the Western Cape’s exports in 2016, with annual growth of 13% between
                2006 and 2016. In 2016, in terms of imports, Cape Town accounted for 79% of Western Cape’s imports.

                The Southern African Customs Union (SACU) countries is a key regional trading partner with 24% of Cape
                                                                                                                                        69%
                Town’s exports going to SACU and 3% of Cape Town’s imports being sourced from there in 2016.

                     cape town trade, 2014- 2016                                                                                           Cape Town
                                                                                                                                         accounted for
                                                                                                                                       69% of the Western
                    250.0
                                                                                                                                         Cape’s exports
                                                                                                                                             (2016)
                    200.0

                    150.0
      Value (Rbn)

                    100.0

                     50.0

                      0.0
                                          Trade including SACU   Trade excluding SACU       Trade including SACU         Trade excluding SACU
                                                ( Exports)              (Exports)                 (Imports)                     (Exports)
                            2014                 73.8                   18.6                       237.2                         6.4

                            2015                 79.0                   19.1                       196.4                         7.2

                            2016                 78.7                   19.0                       192.1                         5.7

 Source: Quantec, 2017

 In 2016, Cape Town’s major export regions were Africa (43%), Europe (24%) and Asia (16%).
 In 2016, the top export market destinations for Cape Town were Namibia (R9.5bn), Botswana (R5.9bn) and the United
 States (R5.4bn). High growth in exports was seen in Mozambique (68%) and the United States (18%) between 2015
 and 2016.
                cape town global export regions 2016
            0,03%
                                   5,6%
                            1,6%
                     9,4%
                                                                               AFRICA
                                                                               EUROPE
                                                                               ASIA
        15,7%                                                                  AMERICAS
                                                         43,4%
                                                                               OCEANIA
                                                                               ANTARCTICA
                                                                               OTHER

                                                                       Source: Quantec, 2017
                             24,2%

                                                                                                                   invest in cape town 2017/18 |   15
• trade and foreign direct investment profile

 In 2016, Cape Town exported 100% of all the Western
 Cape’s refined petroleum oil, semiconductor devices,
 cigarettes, refined copper, oils and other products of the
 distillation, discs and tapes, and articles of jewellery.3

 In 2016, Cape Town imported 100% of all the Western
 Cape’s electrical generators, footwear and men’s and
 women’s clothing, guts, bladders and stomachs of animals,
 ceramic wares for laboratory, cigars, crustaceans and meat
 of bovine animals.4

                 cape town’s annual growth in exports, 2006 - 2016 (% in USD)

                                                                                                                                          R14bn
      50.00%

      40.00%

      30.00%
                                                                                                                                          Refined
      20.00%
                                                                                                                                          petroleum
      10.00%                                                                                                                              largest exported
         0.00%
                                                                                                                                          product from
                  2006          2007       2008      2009      2010       2011         2012       2013       2014       2015       2016
                                                                                                                                          Cape Town
    -10.00%

     -20.00%

                                             Growth (%)                   Average (%)

                                                                                                                                          R3.7bn
                                                                                              Source: Quantec (2017)

                      cape town’s top 10 exported products, 2016                                                                          apples,pears
             16 000    13 886
                                                                                                                                          & quinces
             14 000
             12 000
Value (Rm)

             10 000

                                                                                                                                          23%
              8 000
              6 000                4 850
                                             3 707
              4 000                                    2 926
                                                                  1 818        1 616      1 542      1 499      1 448      1 347
              2 000
                  0
                                                                                                                                          of all exports from
                                                                                                                        )
                                                                                                                    ats
                                  it

                                             s

                                                      es

                                                                co

                                                                            ets

                                                                                                                     ns

                                                                                                                    ets

                                                                                                                      s
                      um

                                            ce
                              ru

                                                                                                                  art
                                                    ap

                                                                  c

                                                                                                                 tio

                                                                                                                                          Cape Town are from
                                                                                                                bo
                                                                          fill
                                         uin

                                                                                                               fill
                                                               ba
                            sF
                   ole

                                                                                                              ep
                                                  Gr

                                                                                                             ara
                                                            To

                                                                                  nd
                            ru

                                                                           h

                                                                                                            sh
                                       dq

                                                                       Fis
                etr

                                                                                                        gin

                                                                                                                                          the agriculture and
                         Cit

                                                                                                       rep
                                                                                 sa

                                                                                                       g fi
                                       an
              dP

                                                                                                     En
                                                                               ht

                                                                                                   pp

                                                                                                   din
                                    rs

                                                                               c
             ne

                                                                                                                                          fishing sector
                                                                            Ya
                                 ea

                                                                                     e-u

                                                                                               clu
          fi

                                ,p
       Re

                                                                                   ak

                                                                                             ex
                               s

                                                                                  M
                           ple

                                                                                           h(

                                              Source: Quantec (2017)
                                                                                       Fis
                         Ap

  3. This represents products exceeding R500 million. 4. This represents products exceeding R500 million

16 | invest in cape town 2017/18
trade and foreign direct investment profile •

In 2016, Cape Town exported almost 89% of South Africa’s tobacco and 87% of ships, boats and floating structure and,
imports 81% of South Africa’s Fish and crustaceans, molluscs and 56% of beverages, spirits and vinegar.

                                     KEY COMMODITIES TRADED BY CAPE TOWN AND SOUTH AFRICA, 2016
                      TOP 10 EXPORTS (Rm)                                 CAPE TOWN                SOUTH AFRICA           % OF SOUTH AFRICA
 Mineral fuels and mineral oils                                               15 079                   107 194                  14.07%
 Edible fruit and nuts                                                        12 403                   42 421                   29.24%
 Fish and crustaceans                                                         4 993                     6 426                   77.69%
 Nuclear reactors, machinery and mechanical appliances                        4 857                    67 489                    7.20%
 Electrical machinery and equipment                                           3 316                    23 864                   13.90%
 Tobacco and manufactured tobacco substitutes                                 2 642                     2 970                   88.98%
 Pearls, precious or semi-precious stones                                     2 591                    195 408                   1.33%
 Essential oils and resinoids                                                 1 884                     7 736                   24.35%
 Ships, boats and floating structures                                         1 839                     2 122                   86.65%
 Plastics and articles thereof                                                1 800                    17 208                   10.46%
                      TOP 10 IMPORTS (Rm)                                  CAPE TOWN               SOUTH AFRICA           % OF SOUTH AFRICA
 Mineral fuels and mineral oils                                               56 456                   147 769                  38.21%
 Electrical machinery and equipment                                           11 338                   118 793                   9.54%
 Nuclear reactors, machinery and mechanical appliances                        9 601                    150 735                   6.37%
 Knitted or crocheted articles of apparel and clothing accessories,           5 505                    11 177                   49.25%
 Articles of apparel and clothing accessories,
                                                                              5 118                    12 570                   40.71%
 not knitted or crocheted
 Plastics and articles thereof                                                4 301                    33 121                   12.99%
 Footwear, gaiters and the like; parts of such articles                       3 811                    12 638                    30.16%
 Beverages, spirits and vinegar                                               3 619                     6 483                    55.81%
 Optical, photographic, cinematographic                                       2 981                     29 685                   10.04%
 Fish and crustaceans, molluscs                                               2 949                     3 624                    81.37%
Source: Quantec (2017)

3.5.2 Foreign Direct Investment                                                                                            It is becoming
Between January 2003 and December 2016 a total of 307 FDI projects were recorded into Cape Town.
These projects represent a total capital investment of R84.04billionn which is an average investment of                    more apparent
R273.71million per project. During the period, a total of 21,881 jobs were created (FDI Intelligence, 2017).        that companies are
                                                                                                                    investing in Cape Town
Domestic market growth was cited as the top motive for companies investing in Cape Town (around 63%),
                                                                                                                    to establish a strategic
followed by proximity to markets or customers (25%) (FDI Intelligence, 2017).
                                                                                                                    base from which to
It is becoming more apparent that companies are investing in Cape Town to establish a strategic base from           launch or expand their
which to launch or expand their businesses into other African markets. According to Darren Franks, managing         businesses into other
director of Eutopia Middle East and Africa, said: “Cape Town is a booming city for high tech and emerging
                                                                                                                    African markets.
technologies, so it made sense to base the new office there. The new office will provide us with a valuable
springboard to the African continent and offer a more local service to our key clients (FDI Intelligence, 2017).”

                                                                                                                       invest in cape town 2017/18 |   17
• foreign direct investment

Despite the decrease in project numbers and capital expenditure (capex) by 17.9% and 7.4% between 2015 and 2016, over the past decade (between
2006 and 2016) both projects and capex increased by an average growth rate of 22.6% and 7.3% respectively.

fdi inflows to cape town january 2003 - december 2016

                             16 000                                                                                                               45

                             14 000                                                                                                               40

                             12 000                                                                                                               35
                                                                                                                                                  30
                             10 000
 Value (ZARm)

                                                                                                                                                        Projects
                                                                                                                                                  25
                              8 000
                                                                                                                                                  20
                              6 000
                                                                                                                                                  15
                              4 000
                                                                                                                                                  10
                              2 000                                                                                                               5
                                 0
                                      2003 2004 2005       2006    2007     2008     2009    2010      2011    2012 2013 2014 2015 2016
                  Capex (ZARm) 5 914       2 524   2 318   6 265   3 338    15 188   6 399   10 2916   6 027   8 460    7 264    3 816    3 236       2 996

                  Projects            11    8       10      13         14    18       23       26       29      31       39       34       28          23
                                                                                                                       Source: FDI Intelligence, (Sep 2017)

                    The top source markets                              1. United Kingdom (27% of projects and 18% of capex);
                      for FDI into Cape Town                            2. United States (24% of projects and 28% of capex);
                         from 2003 to 2016,                             3. Germany (6.5% of projects and 6.5% of capex);
                           were as follows:                             4. China (4.2% of projects and 2.2% of capex)

                Selected companies that have invested in Cape Town over the past 10 years:

                    Amazon has                   Hisense opened a              GlaxoSmithKline             Kimberly-Clark of               IBM opened three
                      expanded                   new headquarters             (GSK) investments             South Africa has                satellite locations
                    its customer                facility in Cape Town           opened a plant            expanded its paper,              in Africa, including
                  contact centre in               to coordinate the            in Cape Town to           printing & packaging                  Cape Town.
                     Cape Town.                 company’s presence           increase production         manufacturing facility
                                                    across Africa.               of its drugs.               in Cape Town.

                 Harvard University              Airbus invested                Oracle opened a           Juwi opened a Cape                 Wind Prospect’s
                 opened a centre for             in upgrading its               software and IT         Town office in response             Cape Town office
                African Studies office            servicing and                  services sector            to rapid regional              will serve the entire
                    in Cape Town.               maintenance facility              in a design,          growth and as part of its           African continent.
                                                  in Cape Town.                development and           international growth
                                                                                testing project.                strategy.

18 | invest in cape town 2017/18
foreign direct investment •

The top five destination markets for FDI from Cape Town between 2003 and 2016 were Nigeria,
the United Kingdom, Kenya, Angola, Zambia and the United Arab Emirates. African markets
made up six of the top 10 destination markets for FDI from Cape Town between 2003 and
2016. These African markets were Nigeria, Kenya, Angola, Zambia, Ghana, and Mauritius.

                                                                                           mozambique
                                                                                            5 Projects
                                                                                               2,9 %

                                                                                              uganda
                                                                                             4 Projects
                                                                                                2,3 %

                                                                                               kenya
                                                                                            11 Projects
                                                                                               6,4 %

                 Ghana
               5 Projects
                  2,9 %

                nigeria
              21 Projects
                  12 %

                angola
              10 Projects
                 5,8 %

                namibia
               3 Projects
                  1,7 %
                                                                      zambia                 mauritius
                                                                    10 Projects              5 Projects
               botswana                                                5,8 %                    2,9 %
               3 Projects
                  1,7 %
                                 Source: FDI Intelligence, (2017)
                                                                                  invest in cape town 2017/18 |   19
• good governance

                              3.6	Good governance
           3rd                       The City of Cape Town is one of the first
                                       municipal entities in South Africa to have taken
                                                                                          and Prime -2, respectively. These credit ratings by Moody’s
                                                                                          place Cape Town in the investment grade, where the
      consecutive                      several important measures to ensure good
                                       governance. In 2017, the City of Cape Town
                                                                                          associated risk of borrowers repaying its debts is fairly low.
                                                                                          Moody’s decision for its ratings were based on the City’s
      clean audit                      was again rated highly for its sound fiscal        good budgetary performance, strong liquidity position and

         report                       position and prudent financial management
                                     by the international credit rating agency
                                                                                          moderate debt levels (Moody’s, 2016).

                                  Moody’s maintaining the highest possible level of       The City has also achieved its 12th consecutive unqualified
                             credit quality within the national context by obtaining a    audit report and its third consecutive clean audit report in
                          long- and short-term global sovereign credit rating of Baa2     the 2015/16 financial year.

     3.7 City                                     3.8 	Infrastructure and Costs
                                                  3.8.1 Transport Infrastructure:
     Initiatives                                  Road, Railway, Airport and Port
     The City of Cape Town is home                The City of Cape Town provides a well-connected transport infrastructure system and is
     to several initiatives aimed at              prioritizing extensive upgrades and investment in the improvement of public transport
                                                  systems and transport linkages to increase the economic and social functionality of the city.
     expanding its functionality,
     attractiveness and efficiency
     as an investment destination,
     including:

     1.  The Port of Cape Town terminal
         expansion

                                                        Airport
                                                                                                                      Cape Town
     2. Atlantis Green Technology
         Special Economic Zone
         designation

                                                                                                                    International
                                                      The Cape Town International (CPT)
     3. Cape Health Technology Park
                                                      Airport is a world-class airport, is the
         project
                                                      second largest in South Africa and the
     4. Cape Town Air Access
         programme
                                                      third largest in Africa. In 2017, the airport
                                                      was awarded the Best Airport in Africa and
                                                                                                                       2nd largest in SA
     5. The development of a cruise
         liner terminal
                                                      came in second place for the award of Best
                                                      Airport in Africa for Staff Service Excellence
                                                                                                                      22nd best in world
     6. The implementation of                         (Skytrax,2017). The airport also retained
         the City’s Transit Oriented                  its rating as the 22nd best airport in the
         Development (TOD) strategy                   world by Skytrax.
         and the corresponding roll-out
         of further bus rapid transport               Located approximately 12 miles (20 km)
         routes                                       from the city centre of Cape Town, the
     7. Phase 2 of the roll-out of                    CPT Airport operates with international                             (Brand South Africa, 2017).
         broadband fibre across Cape                  and domestic flights. It is the only airport                        Several international airlines
         Town                                         in the Cape Town metropolitan area that                             offer direct flights to Cape
     8. Re-alignment of the airport’s                 offers scheduled passenger services (Cape                           Town, including from London,
         runway                                       Town International Airport, 2017). The                              Amsterdam and Windhoek.
     9. Extension of the Cape Town                    airport had total passenger traffic of 10                           All of South Africa’s airlines
         Convention Centre                            million in 2016 (City of Cape Town, 2017).                          fly to Cape Town, with the
     10. The development of the                                                                                           route between Cape Town and
                                                      The airport has domestic and international                          Johannesburg particularly
         premium foreshore property
                                                      terminals, connected by a central terminal                          well served (ibid, 2017).
         around the unfinished bridges

20 | invest in cape town 2017/18
infrastructure & c0st •

3.8.2 Information Technology Infrastructure
Information technology (IT) infrastructure is well established in the City of Cape Town with the city having   R418 million
invested R950.5 million (including phase 1 pilot) on its capital broadband infrastructure cost as at end of
July 2017 (estimated to be R1 989 million by 2021). This includes the proof of concept (phase1) which
                                                                                                                  generated by
occurred as from 01 July 2009 to 30 June 2014) as part of its broadband infrastructure project. This city        installing own
owned network increases the City’s bandwidth by approximately 3000 times at current connected sites.            broadband links
The following impact was made by the project to date:

848 kilometers               475             Free Wi-Fi         30 MyCiTi 135 Metro Police cameras              = Return On
 of fibre-optic
cable installed
                         buildings
                           in total
                                            installed at
                                             715 access
                                                                stations
                                                                connected
                                                                              connected in (AthLone,
                                                                              Manenberg, Bellville,
                                                                                                               Investment of

                                                                                                                   63%
and owned by the         connected          points at 225     (three depots, Francie van Zijl, Parow,
   city (planned        on the Metro          locations        27 stations)   Hans Strijdom, Robert
 1 827 kilometers       Area Network                                         Sobukwe, Silverton and
      by 2021)              (MAN)                                                   Wynberg)

The resultant financial benefits are already evident in that a cost saving of R418 million was made by the
City installing its own broadband links. Further, R307 million in costs were saved by cancelling rented
broadband links and R58.4 million of revenue was generated through the leasing of spare capacity in the
                                                                                                                R58.4 million
City’s lines to commercial operators. This constitutes a Return on Investment of 63%.                          revenue generated
                                                                                                                through leasing spare
This improvement of IT infrastructure, can be used to catalyse the development of the rapidly growing ICT          capacity in City’s
sector in the city, as well as helping to support entrepreneurial growth through providing citizens with         lines to commercial
increased access to the internet.                                                                                      operators

                                                                                                               invest in cape town 2017/18 |   21
Cape Town Air Access is the focal point for international air route       •    New route establishment (facilitating the establishment of new
development in the Western Cape and signifies an impressive                    routes).
collaboration between the Western Cape Provincial Government
(WCG), the City of Cape Town (CCT),                                       The team at Wesgro has contributed in landing 10 new routes and
                                                                          facilitating 11 route expansions for the Western Cape province in
Airports Company South Africa (ACSA), Cape Town Tourism (CTT),            the past two years. This has resulted in an increase in capacity at
South African Tourism (SAT), Wesgro and private sector partners.          Cape Town International Airport of 700,000 inbound seats, which last
                                                                          year helped the airport reach the 10 million passengers mark for the
The primary mandate of the air access team is to promote, develop and     first time ever.
maintain international air routes in and out of Cape Town International
Airport through:                                                          Just under 2 million international passengers visited the airport in
•    Route retention (ensuring the success of existing routes),           2016 and this is expected to increase to 2.5 million in 2017. In fact
•    Route expansion (increasing frequencies and capacity on existing     growth in international traffic at CTIA increased by 27% in the first
     routes), and                                                         half of 2017 compared to the same period last year.

Cape Town International Airport 2017
      UNITED ARAB EMIRATES                                                                                            FRANCE
      Dubai                                                                                                           Paris
      TURKEY                                                                                                          SWITZERLAND
      Istanbul                                                                                                        Zurich
      ETHIOPIA                                                                                                        NAMIBIA
      Addis Ababa                                                                                                     Walvis Bay, Windhoek
      NETHERLANDS                                                                                                     SINGAPORE
      Amsterdam                                                                                                       Singapore
      GERMANY                                                                                                         ZAMBIA
      Frankfurt, Munich, Cologne                                                                                      Livingstone
      KENYA                                                                                                           ANGOLA
      Nairobi                                                                                                         Luanda
      UNITED KINGDOM                                                                                                  MAURITIUS
      London Gatwick, Heathrow                                                                                        Mauritius Island
      BOTSWANA                                                                                                        QATAR
      Maun, Gaboron                                                                                                   Doha
                                                                                                                      ZIMBABWE
                                                                                                                      Victoria Falls

       Air Access has added 700 000                           Cape Town Airport is the 3rd largest
       international seats since July 2015.                   airport in Africa
                                                                                                                    Year    Nr of passengers
       CTIA is the most punctual airport in                   Airport charges being dropped by 35%
       South Africa for 2016                                  on average from the 1st April 2017                    2014    8,6 million
                                                                                                                    2015    9,4 million
       Cape Town Airport is the 2nd largest                   CTAA and CTIA won the Routes Africa
       airport in South Africa                                award in 2016                                         2016    10 million

Partners:                                                                         Advisory Support:

                                                                                                              an inspiring place to do business
                                                                                                                            www.wesgro.co.za
electricity & water •

3.8.3 Electricity and Water
Extensive investment in electricity infrastructure across the country is apparent, whereby a
large proportion of the focus is on renewables. Although electricity costs in South Africa are
increasing, the country still retains a relatively low position in terms of global electricity pricing.
                                                                               Table 5: International comparisons of electricity costs, 2015
                                   Cape Town’s energy supply is
                                                                                      INTERNATIONAL COMPARISONS OF ELECTRICITY COSTS, 2015
                                   mostly provided by the national
                                   grid, with energy demands set at                                         US dollar per c/
                                                                                          Country                                     % change from 2014
                                   approximately 2 400MW. Two thirds                                             kWh
                                   of residents are serviced by the City,         Italy                          15.70                         -6.8%
   2 400MW                         with the remaining 25% served by
                                                                                  Germany                        15.22                         -1.2%
    energy demand                  Eskom. A large proportion of Cape
                                   Town’s electricity is supplied by              United Kingdom                 14.16                        +1.3%
                                   Koeberg power station, a nuclear
                                                                                  Belgium                        11.17                        +9.9%
                                   power station located approximately
 electricity supplier              36km north of the city centre. There           Portugal                       11.05                         -0.4%
                                   are plans to diversify the forms               Spain                          11.04                        +1.0%
                                   of energy provision to Cape Town
25%                                and initiatives have arisen which              Slovakia                        9.90                         -1.6%

          city of CT               will enhance the use of renewable              United States                   9.43                         -5.7%
          eskom                    energy (through the Atlantis Green
                                                                                  France                          8.97                        +4.2%
                                   Technology Industrial Park) to take
                       75%         advantage of the growing oil and             South Africa                      8.46                        +8.2%
                                   gas opportunities.                          Source: NUS Consulting Group (2016), Local Energy Market Report, Business Tech, 2016

Table 6: Comparison of electricity use and access in South African cities, 2016
                   COMPARISON OF ELECTRICITY USE AND ACCESS IN SOUTH AFRICAN CITIES, 2016
                                                                                                                                                    Water is
                                                                                                                                                  derived from
                                    2016 Medium to Large power
                                    users Average Energy Charge            2016 Household Average Annual Growth in                            6 catchment
      Comparative Cities            (R cents/kilowatt hour) exclud-
                                                                           access to electric- the number of households                           dams
                                                                            ity for lighting     accessing electricity for
                                    ing Value Added Tax (VAT) and           (population %)        lighting, 2011 - 2016
                                       excluding service charges
                                                                                                                                                    treated in
 Cape Town                                        73,34                           90%                        1,7%                                 20 water
 Johannesburg                                    104,55                           91%                        2,1%                              treatment plants
 Tshwane (Pretoria)                              100,75                           89%                        2,2%
 eThekwini (Durban)                               73,93                           90%                        1,8%
Sources: City of Cape Town, 2017; City of Johannesburg, 2016; eThekwini Municipality, 2017; Quantec, 2017

                                                                                                            96%
            Cape Town’s potable water is amongst the best in the country, scoring 96% for
            the quality of drinking water according to the Blue Drop Water Certification
              assessment. Water is derived from six catchment dams which are largely
             extracted from mountain catchments, and treated in 20 water treatment
         plants. The City’s Water and Sanitation Department has received numerous
                                                                                                        Best potable
         awards including the Platinum Award for excelling in the Blue Drop Awards                      water in the
         Programme, and certificates of excellence from the Water Institute of South
          Africa. The City is also endeavoring to become a more sustainable consumer
                                                                                                         country
                                                                                                            Blue Drop Water
           of water and is, simultaneously, exploring a number of alternative options to                      Certification
                                         supplement the city’s existing water supply sources.

                                                                                                                         invest in cape town 2017/18 |      23
• Industrial & prime office space

                                                  3.8.4 Industrial and Prime Office Space
                                                  Cape Town has evolved into a world-class business destination offering a
                                                  quality and modern environment for business and innovation. The total
                                                  current value of property in the Central Business District (CBD) amounts to
                                                  more than R31 billion (Cape Town Central City Improvement District, 2017)
                                                  and is set to increase. Approximately 31,000m2 of large-scale buildings are
                                                  to be complete by the end of quarter 1 in 2018, including the construction of
                                                  a new office block for KPMG in the CBD (16,000 m2) and Waterway House at
                                                  the V&A Waterfront (15,000 m2) (Jones Lang Lasalle, 2017).

                                                  Office vacancies within the CBD have decreased relative to 2015, reaching
                                                  7,3% in June 2017. This is in contrast to higher vacancy rates of 13,3%;
                                                  12,6% and 10,7% in the City of Johannesburg, eThekwini and the City of
            Key Office Market                     Tshwane CBD’s respectively (SAPOA, 2017:9). The majority of offices within

            Indicators (Q1 2017)
                                                  the CBD consist of AAA, A, and B-grade office space, marking the CBD as
                                                  one of the most dynamic and sought-after locations for office rentals (Rode
                                                  Report, 2016:45).

                     200
                                                  Fast growing office locations in the city include the CBD, Bellville and
                                                  Century City. Century City houses some of the most modern and exciting
                                                  office space which is centered on “green” building and innovative design.
                   Prime Gross                    Similarly, Claremont, an upmarket suburb, is a prominent node for offices

                Rent (ZAR/m2 pm)
                                                  and businesses, with a large presence of smaller businesses in the specialist
                                                  sectors.

                       8%           Figure 10: Cape Town office stock (m2)*

                  Prime Yield         CBD Cape Town                                                                       936 593

                                              Bellville                                       541 838

                   7,6%
                                          Century City                           336 672

                                            Pinelands                      237 716

             Cape Town Vacancies           Claremont             110 722

                                         Rondebosch/
                                                                99 731
                                           Newlands

                  2540m2              V & A Waterfront           119 853

                  Total Gross                                   200 000        400 000      600 000       800 000      1 000 000

                 Leasable Area        *Grades A+, A & B Source: Rode, 2017 (pp. 53), 2017

                 (GLA, ‘000m2)

24 | invest in cape town 2017/18
Industrial land •

3.8.5 	Industrial Land
The city plays host to a number of industrial activities in different areas including the Atlantis
zoned industrial area which has been delineated a key development node offering an expanse
of 1,000 hectares of land. This includes a zone for noxious industry as well as an identified hub
for manufacturing green technologies (Atlantis Green Technology Industrial Park).

                                                                         35%     Wholesale & retail trade, repair of motor vehicles & motor cycles
                                                                         28%     Manufacturing
                                                                         8%       Transportation & storage
                                                                         7%       Construction
                                                                         4%       Professional, scientific & technical activities
                                                                         4%       Administrative & support services activities
                                                                         3%       Accommodation & food service activities
                                                                         2%       Other service activities
                      Figure 11: Percentage of                                    Electricity, gas, steam & air conditioning supply
                                                                         1%
                        industrial businesses
                        in each sector across                            1%      Water supply, sewerage, waste management & remediation activities
                           Cape Town, 2016                               1%      Information & communication
                                                                         1%       Education
                                                                         1%       Financial & Insurance activities
                                                                         1%       Human health & social work activities
                                                                         0%       Arts, entertainment & recreation
                                                                         0%       Real estate activities
                                                                         0%       Public administration & defence, compulsory social security
                                                                         0%       Mining & quarrying
                                                                         0%       Agriculture, forestry & fishing

  Vacant land within the industrial
                                                         The graph above depicts the split of industrial businesses
                                                         by sector within the industrial areas in Cape Town.
   area boundaries =459 land parcels                     Businesses specialising in the Wholesale and Retail trade
                                                         sector are predominant in industrial areas (36%), while
                                                         the manufacturing sector closely follows at 28%. Land
Vacant building within the industrial                    parcels within the industrial area boundaries that are not

  area boundaries =114 land parcels                      economically active either consist of vacant land, vacant
                                                         buildings, road reserves or wetlands.

                                                                                                     invest in cape town 2017/18 |          25
• Industrial land

                                           In addition to Atlantis, key industrial areas include Epping, Montague Gardens, Ndabeni, Paarden
                                           Island and Airport Industria, as well as other outlying areas along the N2, N1 and R300 highways.
                                           According to Rode (2017), the Cape Peninsula has relatively low vacancy factors5 in its industrial areas
                                           (Figure 12), suggesting a promising return on industrial property rentals (Rode, 2017: 4). A number of
                                           city incentive schemes for the growth of industry operations are available, as outlined in Section 7.

                                           Figure 12: Vacancy factors of industrial areas in Cape Town, Quarter 1 (2017)
                    Parow Industria                                                                                                                            3.5%
                  Parow Beaconvale                                                                                                            3.0%
                      Ottery Hillstar                                                                                                         3.0%
                      Sand Industria                                                                                                          3.0%
               Landsdowne Nerissa                                                                                                             3.0%
                       Athlone 1 & 2                                                                                                          3.0%
                         Racing Park                                                                                                          3.0%
                       Viking Place                                                                                                           3.0%
        Bellville South/Sacks Circle                                                                                                   2.8%
                       Epping 1 & 2                                                                                             2.6%
                              Airport                                                                                           2.6%
                                                                                                                             2.5%
               Brackenfall Industria
         Bellville Stikland/ Kaymor                                                                                          2.5%
                           Maitland                                                                                          2.5%
                       Ottery Sunset                                                                                         2.5%
                  Killarney Gardens                                                                                          2.5%
                                                                                                                      2.3%
                    Bellvile Triangle
     Elsies River (excl. Central Park)                                                                                2.3%
                                                                                                                      2.3%
                Montague Gardens
                                                                                                               2.1%
                      Marconi Beam
                                                                                                             2.0%
                     Okavango Park
                                                                                                             2.0%
                          Kuils River
                                                                                                             2.0%
                Evertie Brackenfell
           Tygerberg Business Park                                                                           2.0%
                         Diep River                                                                          2.0%
 Woodstock/ Salt River/ Observatory                                                                          2.0%
                     Paarden Island                                                                          2.0%
                                                                                                      1.8%
                            Ndabeni
                                                                                                   1.7%
         Saxenburg Industrial Park
                                                                                            1.5%
                      Capricorn Park
                                                                                            1.5%
                 Retreat/ Steenberg
                                                                                            1.5%
                            Elfindale
                          Parow East                                                 1.3%
                                                                                     1.3%
                            WP Park
                                                                            1.0%
                        Blackhealth
                        Kraaifontein                                        1.0%
                   Bellville Oakdale                                        1.0%

                                     0.0%             0.5%           1.0%            1.5%            2.0%             2.5%             3.0%             3.5%            4.0%

                                         Source: Rode, 2017 (pages 67-69)

5   These industrial vacancy factors are not to be interpreted as actual vacancy percentages which indicate the floor area available for leasing at any given time, but rather as
    graduations on a 0-9 vacancy scale, where 0 equates to no vacancy and 9 equates to substantial vacancy. These factors are for all unit sizes (250 m², 500 m², 1.000 m²,
    2.500 m² and 5.000 m²) combined, as surveyed by Rode. Vacancies could however, differ across the different-sized units (Rode, 2017: 59).

26 | invest in cape town 2017/18
Cape Town Accolades •

3.9	Cape Town Accolades
Cape Town is undoubtedly one of the most internationally recognized cities. A variety of activities are within a
20-minute drive from the CBD including hiking, beaches, internationally acclaimed restaurants and bars, vineyards
and wine tasting, national reserves, and cultural landmarks such as Robben Island and Table Mountain, a 7th Wonder
of Nature. Cape Town receives regular accolades which are related to lifestyle, opportunities, service offerings and
overall living standards. From 2011 onwards, Cape Town has received numerous accolades, including amongst others:

1.   Cape Town voted best African business tourism         8.    Cape Town has been named as Luxury City
     event destination in 2017(International Congress            Destination of the Year for the second consecutive
     and Convention Association, ICCA, 2017). It is the          year in the Luxury Travel Guide Africa & Middle East
     fourth consecutive win for the city.                        Awards 2016.
2.   Cape Town International Airport voted best in         9.    The Best City in the World (Telegraph Travel Awards,
     Africa in 2017 (Skytrax World Airport Awards,               2015/2016);
     2017)                                                 10.   One of the Top 10 cheapest global travel cities (Trip
                                                                 Adviser, 2013);
3.   Featured in Fodor’s Go List 2017
                                                           11.   Number 1 Convention city in Africa & Middle
                                                                                                                             The private health
4.   Western Cape voted Golf Destination of the Year,
     2017, Africa and Gulf States (IAGTO – International         East (International Congress and Convention                  sector is world-
     Association of Golf Tour Operators).                        Association, 2012-2015);                                     class and offers
5.   Awarded the Condé Naste Readers’ Travel Awards        12.   One of the top African cities in the category Top            leading teaching
     2016 for Best Overseas City for Restaurants & Bars,         10 Cities in Africa & the Middle East (Condé Nast               hospitals.
     as well as the second best overseas city in the             Traveler Readers’ Choice Awards for 2013);
     World.                                                13.   Best Airport in Africa and Airport Staff Service
6.   The 2015-16 Telegraph Travel Awards chose Cape              Excellence 2010 – 2015 (Skytrax, 2010-2015);
     Town as Best City (for the fourth year running)       14.   Number 1 on the New York Times’ 52 Places to Go in         There are numerous
7.   In Condé Nast’s Reader’s Choice Awards, Cape                2014 (Condé Nast Traveler Readers’ Choice Awards
                                                                                                                                public and
                                                                 for 2013);
     Town took the honour as the number one food city
                                                           15.   The Cape Town International Convention Centre was
                                                                                                                                private top
     in the world for 2016
                                                                 voted as the best conference and events venue in            schools including
                                                                 South Africa (SACCI, 2015 – 2016);                            international
                                                           16.   Africa’s Leading Meetings and Conference                   German, Italian and
                                                                 Destination (World Travel Awards 2013);                      French schools
                                                           17.   Top City in Africa and the Middle East (Travel &
                                                                 Leisure’s annual online poll 2015);
                                                           18.   One of the World’s Top 20 Cities 2010 (Condé Naste
                                                                 Traveler Readers’ Travel Awards);                               Top tertiary
                                                           19.   One of the World’s Top 10 Most Loved Cities (CNN);
                                                                                                                                  education
                                                           20.   Best City Award 2016 (The Telegraph Awards);
                                                           21.   One of the Top 10 Beaches in the World (National
                                                                                                                               institutions are
                                                                 Geographic, 2013);                                           available within
                                                           22.   World’s Best Luxury Entertainment & Lifestyle                the city and host
                                                                 Destination (Ethisphere, 2015);                                a vast number
                                                           23.   World Design Capital 2014; and,                               of international
                                                           24.   One of the World’s Most Beautiful Cities 2010
                                                                                                                                   students.
                                                                 (Forbes)

                                                                                                             invest in cape town 2017/18 |   27
• Sectoral pockets of excellence

                                                                                                         Cape Town Business
                                                                                                         Services Indicators
                                                                                                         Sources: IHS Markit (2017), FDI Intelligence (2017)

                                                                                                                R 20 091 mil
                                                                                                                           (7,2%)
                                                                                                                Gross Value Added
                                                                                                                 (GVA) / share of
                                                                                                                  Cape Town GVA

                                                                                                                          1,01
                                                                                                                  Location quotient6

                                                                                                             R9 763 million
04               Sectoral pockets                                                                            Ten year Foreign
                                                                                                            Direct Investment

                 of excellence                                                                                  (FDI) value

                  4.1 Business Services
                                                                                                                   4.72%
                                                                                                           Ten year GVA Growth contri-
                               The business service sector, including Business Process
                               Outsourcing (BPO) and Information Technology (IT), has been
                                                                                                                bution (2006-2016)
                               the largest contributor to employment growth in Cape Town
                               over the last 10 years. In 2016, Cape Town accounted for

                                                                                                              209   834
                               82% of the Western Cape and 13% of South Africa’s business
                               services sector.

                               The City has attracted a number of foreign companies into its
                               business services sector, with 61 investment projects being                Formal employment
                               funded over the period between 2006 and 2016. The top two
                               business services subsectors attracting FDI during this time

                                                                                                                        24,9%
                               were professional services (31 projects) and creative industries
                               (17 projects) (FDI Intelligence, 2017).

                                                                                                          Contribution to employ-
                                                                                                         ment creation in Cape Town
6. This indicator provides an indication of Cape Town’s comparative advantages as compared to the rest      between 2006-2016
of South Africa’s metropolitan municipalities. A location quotient value of greater than one indicates
that a sector has a comparative advantage.

28 | invest in cape town 2017/18
You can also read