Bioenergy for Sustainable Local Energy Services and Energy Access in Africa - Demand Sector Report 2: Dairy Focus Country: South Africa
←
→
Page content transcription
If your browser does not render page correctly, please read the page content below
Bioenergy for Sustainable Local
Energy Services and Energy
Access in Africa

Demand Sector Report 2: Dairy
Focus Country: South Africa

SEPTEMBER 2021
This material has been funded by UK aid from the
UK government via the Transforming Energy
Access programme; however, the views expressed
do not necessarily reflect the UK government's
official policies.
This report has been prepared by NIRAS-LTS under contract to the Carbon Trust.
NIRAS-LTS accept no liability whatsoever to any third party for any loss or damage
arising from any interpretation or use of the information contained in this report, or
reliance on any views expressed therein.
This document may be cited as:
NIRAS-LTS, E4tech, AIGUASOL and Aston University (2021). Bioenergy for Sustainable Local Energy
Services and Energy Access in Africa, Demand Sector Report 6: Dairy, South Africa. For Carbon Trust and
UK Government. London.
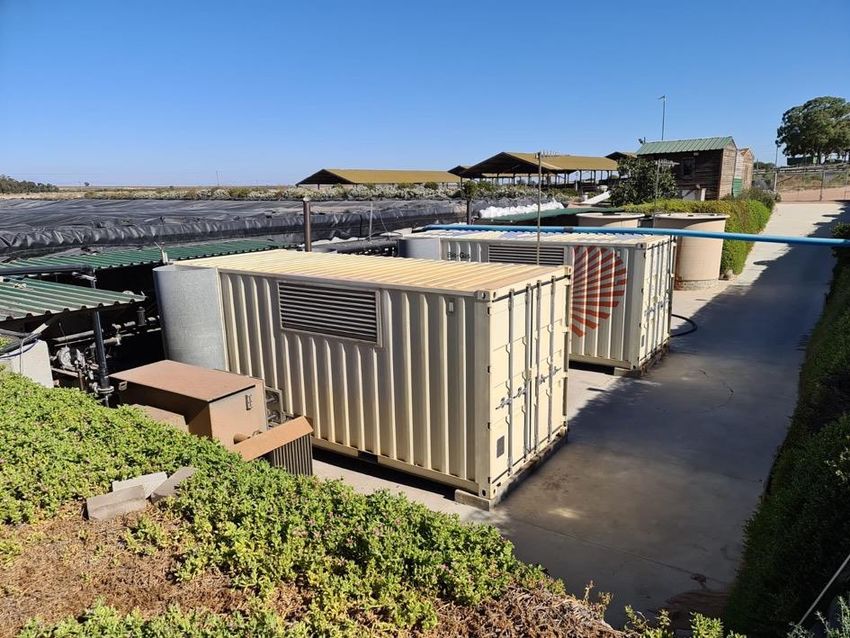
Cover photo: Biogas CHP plant at Uilenkraal dairy farm, Darling, South Africa. Credit: Darius Boshoff
NIRAS-LTS International Ltd
Pentlands Science Park, Bush Loan
Penicuik
EH26 0PL
United Kingdom
+44 (0)131 440 5500
mail@ltsi.co.uk
@LTS_Int
www.ltsi.co.uk
Registered in Scotland Number 100833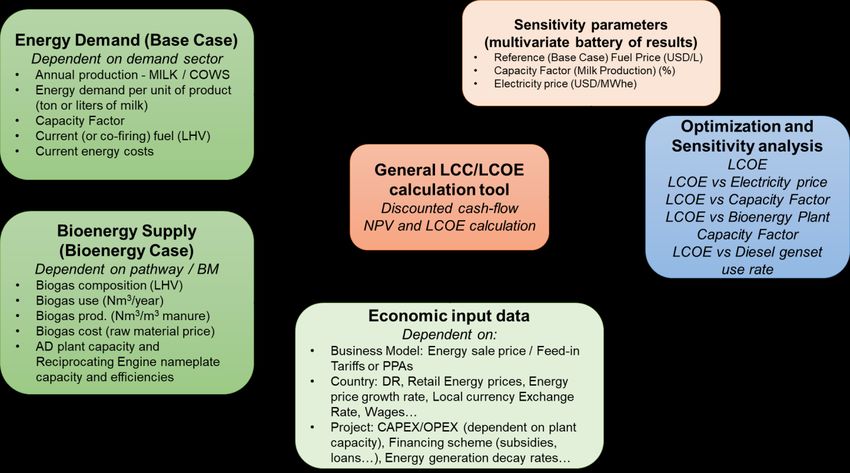
September 2021   www.ltsi.co.uk

ACKNOWLEDGEMENTS
This research would not have been possible without the kind assistance of numerous
people in South Africa, for whom the whole team is grateful. A full list of designations
and organisations is annexed to this report.
Special thanks are due to Andrew Taylor and Vianca Nigrini of Cape Advanced
Engineering, a specialist provider of biogas technology and services, and to the owners
of the Uilenkraal Dairy Farm in the Western Cape, especially William and Coenraad
Basson, for their kind cooperation over months of remote communications and
interviews, and their generous hospitality during a site visit in January 2021.

                                                                                                i
September 2021   www.ltsi.co.uk

EXECUTIVE SUMMARY
NIRAS-LTS partnered with Aston University, E4tech and AIGUASOL to research the
opportunities and constraints for bioenergy development in sub-Saharan Africa (SSA)
across seven shortlisted industries, through five interlinked themes: biomass resources,
technology, economic competitiveness, commercial viability and institutional, market
and regulatory frameworks. This report, the sixth in the series, focuses on the bioenergy
opportunities for anaerobic digestion (AD) in the dairy sector in South Africa.
South Africa has the largest commercial dairy industry in SSA. The sector is undergoing
consolidation, presenting an opportunity for producing energy from cattle manure in
farms where large herds are stalled indoors. However, despite South Africa’s leadership
in SSA’s biogas industry, there has been limited adoption of AD within its dairy sector.
Resource assessment indicates that the opportunity for AD in South Africa’s dairy sector
exists mainly on large commercial dairy farms with at least 400 stalled, lactating cows
(implying herds larger than 800 in total, as only 50% of cows are usually in-milk). About
240 dairy herds in SA meet this requirement, with a combined minimum of around
180,000 lactating cows. The power generation potential from manure-based AD and the
electricity demand from the dairy sector are both highest in Western Cape, Eastern
Cape, KwaZulu-Natal and Free State Provinces, where milk production is concentrated,
making these the most promising regions for further AD-based electricity production.
Much of the AD technology used for large-scale AD was developed in subsidised
European environments, and replication in SSA is hampered by high cost and technical
complexity. This has motivated a number of specialist South African companies to
develop locally-manufactured alternatives to European technology, which cuts costs and
can stimulate wider adoption. These companies offer installation and management
services that permit the investor to focus on their core business, leaving the complex
management of the AD system and associated CHP plant to the technology provider.
Economic analysis reveals a favourable reduction in the net cost of electricity for a 400
kW biogas-powered CHP plant at a dairy farm. However, further adoption in South
Africa’s dairy sector is likely to be limited to those few large farms that have significant
on-site power demands, either because they have their own milk processing plants or
have a co-located enterprise such as a feed mill. But the number of combined milk
producer/processors has been falling, with production being predominantly rural and
processors mostly located in towns and cities, so the opportunity is limited.
Other key barriers to replication relate to electricity policy. For most potential adopters,
low internal heat and power requirements mean that commercial viability of an AD
investment relies on the ability to sell surplus power at an attractive tariff, with minimal
bureaucracy. While there have been encouraging recent amendments to the electricity
regulations that mandate Eskom, the national utility, to work with municipalities and
large industries to procure electricity directly from small-scale producers, uptake has
been limited owing to high costs and administrative requirements for ‘wheeling’
electricity using Eskom’s grid. For more dairy farms to become interested in generating
and selling power from AD, Eskom will need to significantly reduce its wheeling charges
and administrative requirements, and improve its rural network infrastructure to
accommodate smaller scale embedded generators.

                                                                                                   ii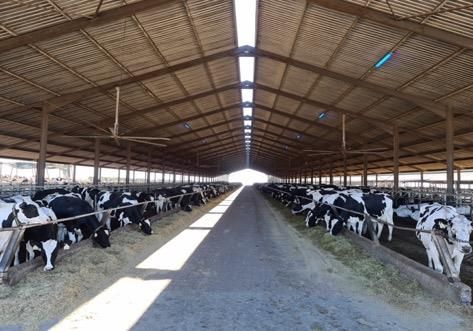
September 2021    www.ltsi.co.uk

Contents
Acknowledgements ..........................................................................................i
Executive summary ......................................................................................... ii
List of acronyms ............................................................................................ iv
1     Introduction ............................................................................................1
2     Methodology ............................................................................................2
      2.1    Overall methodology ..................................................................................... 2
      2.2    Institutional, market and regulatory framework assessment ............................... 2
      2.3    Biomass resource assessment ........................................................................ 3
      2.4    Technology assessment ................................................................................. 3
      2.5    Economic competitiveness analysis ................................................................. 3
      2.6    Commercial viability assessment ..................................................................... 4
      2.7    Gender and inclusion assessment .................................................................... 4
      2.8    Multi-Criteria analysis .................................................................................... 4

3     Overview of the dairy sector ....................................................................5
      3.1    Sector landscape .......................................................................................... 5
      3.2    Bioenergy in the dairy sector .......................................................................... 5
      3.3    Institutional, regulatory and finance framework ................................................ 6

4     Overview of Bioenergy Case ..................................................................12
      4.1    Project summary .........................................................................................12
      4.2    Technical details ..........................................................................................12
      4.3    Economic assessment ...................................................................................15
      4.4    Commercial success factors ...........................................................................16

5     Potential for wider adoption ..................................................................18
      5.1    Biomass resource assessment .......................................................................18
      5.2    Technology .................................................................................................20
      5.3    Economic viability ........................................................................................22
      5.4    Commercial prospects for replication ..............................................................24
      5.5    Gender and inclusion ....................................................................................28
      5.6    Institutional, market and regulatory framework ...............................................28
      5.7    Replication potential in other target countries ..................................................30

6     Summary and conclusions for replication ..............................................34
Appendix 1 : Bibliography .............................................................................37
Appendix 2 : People consulted ......................................................................42
Appendix 3 : Assumptions in biomass resource assessment .........................43
Appendix 4 : Life-Cycle Cost toolkit functions ...............................................45
Appendix 5 : Multi-Criteria Analysis input data .............................................46
Appendix 6 : Photos of Uilenkraal dairy farm and AD plant ...........................47

                                                                                                                           iii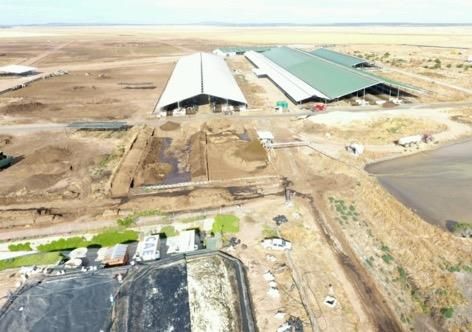
September 2021   www.ltsi.co.uk

LIST OF ACRONYMS
ABEX      abandonment expenditure
AD        anaerobic digestion
AFD       Agence Française de Développement
BBBEE     Broad-Based Black Economic Empowerment
BSEAA     Bioenergy for Sustainable Local Energy Services and Energy Access in
          Africa
CAE       Cape Advanced Engineering
CAPEX     capital expenditure
CFA       Climate Finance Accelerator
CHP       combined heat and power
DALRRD    Department of Agriculture, Land Reform and Rural Development
DBSA      Development Bank of Southern Africa
DFFE      Department of Forestry, Fisheries and the Environment
DMRE      Department of Mineral Resources and Energy
DPE       Department of Public Enterprises
FiT       Feed-in Tariff
G&I       Gender and Inclusion
IPP       Independent Power Producer
IRP       Integrated Resource Plan
LCC       Life Cycle Cost
LCOE      Levelized Cost of Energy
MCA       Multi-Criteria Analysis
MEB       Mass-Energy Balance
Milk SA   Milk South Africa
MPO       Milk Producers' Organisation
Mt        mega tonne (1 million tonnes)
NERSA     National Energy Regulator of South Africa
OPEX      operational expenditure
PPA       Power Purchase Agreement
REIPPPP   Renewable Energy Independent Power Producer Procurement
          Programme
SAMPRO    South African Milk Processors’ Organization
SANEDI    South African National Energy Development Institute
SSA       Sub-Saharan Africa
SSEG      Small Scale Embedded Generators
SUNREF    Sustainable Use of Natural Resources and Energy Finance
TEA       Transforming Energy Access
USD       United States Dollar
ZAR       South African Rand

                                                                                         iv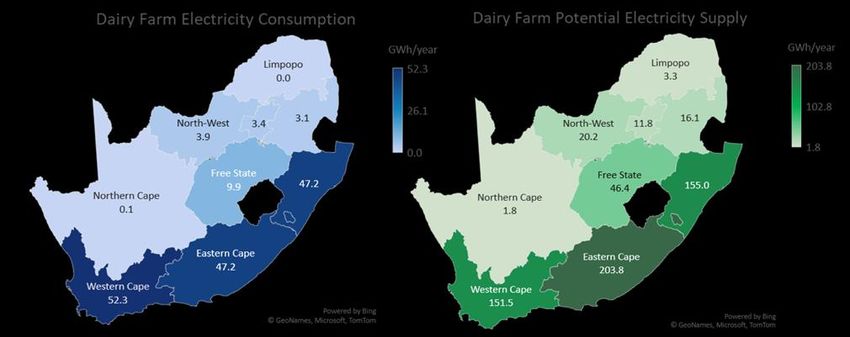
September 2021   www.ltsi.co.uk

1 INTRODUCTION
NIRAS-LTS partnered with Aston University, E4tech and AIGUASOL to implement a two-
year project entitled ‘Bioenergy for Sustainable Local Energy Services and Energy
Access in Africa - Phase 2’ (BSEAA2). BSEAA2 was part of the Transforming Energy
Access (TEA) programme, which is funded with UK aid from the UK government. TEA is
a research and innovation platform supporting the technologies, business models and
skills needed to enable an inclusive clean energy transition. TEA works via partnerships
to support emerging clean energy generation technologies, productive appliances,
smart networks, energy storage and more. It increases access to clean, modern energy
services for people and enterprises in sub-Saharan Africa (SSA) and South Asia,
improving their lives, creating jobs and boosting green economic opportunities.
BSEAA2 was intended to identify and support the development of innovative,
commercial bioenergy pathways and technologies to accelerate the adoption of
bioenergy in SSA. Building upon BSEAA Phase 1, which took place in 2016/17, the
second phase focused on opportunities for the development of anaerobic digestion (AD)
and combustion for electricity and/or heat generation in the range 10 kW to 5 MW, with
a Technology Readiness Level of 5+. That is, technologies that had been successfully
piloted in a representative commercial setting.
The research team investigated the challenges and opportunities affecting the
commercial deployment of these technologies in ten focus countries in SSA (Ethiopia,
Ghana, Kenya, Mozambique, Nigeria, Rwanda, South Africa, Tanzania, Uganda and
Zambia), investigated through six relevant themes: biomass resources, technology,
economics, business models, institutional, market and regulatory frameworks, and
gender and inclusion (G&I). The research targets bioenergy entrepreneurs, investors
and policymakers, aiming to catalyse action for the further development of commercial
bioenergy in SSA.
Commercial opportunities and constraints for bioenergy development were assessed
within seven shortlisted industries, referred to as ‘demand sectors’. These demand
sectors and their associated bioenergy pathway and focus countries are presented in
Table 1-1. This report, the sixth in the series, focuses on the AD opportunity in the dairy
sector in South Africa.
                     Table 1-1 Shortlisted demand sectors for BSEAA2 research
 No. Demand sector            Biomass resource                 Technology            Country
     Cement                   Biomass residues, part-
 1                                                                                   Nigeria
     manufacturing            replacing fossil fuel            Combustion
                              Biomass briquettes, part-        for heat
 2    Tea processing                                                                 Kenya
                              replacing fuelwood
                                                               Combustion
 3    Wood processing         Wood processing residues                               Tanzania
                                                               for CHP
 4    Palm oil processing     Palm oil mill effluent                                 Ghana
                              Fruit & vegetable
 5    Horticulture                                             AD for CHP            Kenya
                              processing residues
 6    Dairy                   Cattle manure                                          South Africa
                                                               AD for
 7    Sisal processing        Sisal processing residues                              Kenya
                                                               electricity

                                                                                                           1
September 2021   www.ltsi.co.uk

2 METHODOLOGY
2.1 OVERALL METHODOLOGY
During a 6-month preliminary assessment (2019-20), the research team screened a
range of bioenergy ‘pathways’ in SSA involving AD or combustion, comprising a specific
biomass feedstock, conversion technology, end use and demand sector. The aim was
to identify the most promising pathways for the adoption of bioenergy-based
combustion or AD across the target countries, for which the existence of at least one
operational venture could be verified. This resulted in the shortlisting of the seven
priority demand sectors in five countries. During the following 12 months (2020-21),
these demand sectors were investigated in detail across the five research themes, to
explore the experiences of both adopters and non-adopters of bioenergy technology.
Information was gathered from site visits to representative commercial operations and
from other stakeholders active in bioenergy in SSA, from published literature and from
partners of the TEA Programme, UK Energy Catalyst and Innovate UK. A bibliography
is in Appendix 1 and a list of people consulted is in Appendix 2.
For each Demand Sector, a ‘Base Case’ and a ‘Bioenergy Case’ were identified:
   •   The Base Case refers to the industry standard for energy use in the given
       demand sector in the target country; that is, the default heat, power or combined
       heat and power (CHP) solution used by a majority of similar businesses.
   •   The Bioenergy Case refers to a specific enterprise (or ‘flagship project’) that
       has transitioned to the use of bioenergy for heat and/or electricity generation in
       the target demand sector, using either combustion or AD.
The Base Case and Bioenergy Case for the dairy sector are defined in Table 2-1.
                   Table 2-1 Base Case and Bioenergy Case for the dairy sector

 Base Case                                  Bioenergy Case
 Dairy farms meeting their electricity      Dairy farms meeting part of their electricity
 requirements from the grid                 requirements from AD-based combined heat
                                            and power (CHP) generation.
                                            Flagship project: Uilenkraal Dairy,
                                            Western Cape, South Africa

This report analyses the Bioenergy Case flagship project across the six study themes of
biomass resources, technology, economics, commercial viability, governance
frameworks and G&I to identify the factors that have enabled the adoption of
sustainable bioenergy. The findings are compared with Base Case examples to identify
the opportunities and constraints for other enterprises in the same demand sector to
adopt similar solutions. Based on this analysis, the potential and requirements for wider
adoption of the Bioenergy Case in the chosen demand sector are assessed, both for the
target country and for the other BSEAA2 countries.

2.2 INSTITUTIONAL, MARKET AND REGULATORY FRAMEWORK ASSESSMENT
The institutional, market and regulatory assessment involved extensive web-based
research and interviews with government, private sector and NGO informants working

                                                                                                         2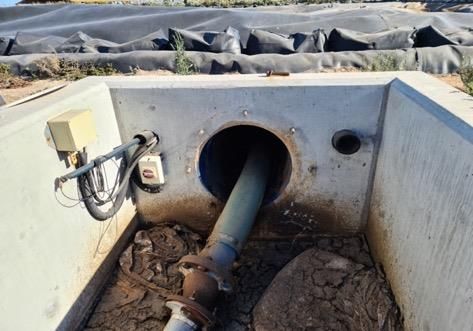
September 2021    www.ltsi.co.uk

in bioenergy in South Africa. The methodology focused on: a) the dairy sector, within
the context of South Africa’s overall agricultural development; b) the electricity sector
and its growth and evolution; and c) the renewable energy policy and regulatory
framework. Interviews were held with the national energy regulator (NERSA), the state-
owned power utility (Eskom), the Independent Power Producer (IPP) Office under the
Department of Mineral Resources and Energy, and other national and provincial
government representatives. Interviews were also conducted with Metier Private Equity,
Mergence Capital, SUNREF/AFD, the Development Bank of Southern Africa, the
Southern African Biogas Industry Association and other private sector dairies and
bioenergy stakeholders active in South Africa (full list in Appendix 2). A remote
interview plus a field visit took place to the Uilenkraal dairy farm in the Western Cape.

2.3 BIOMASS RESOURCE ASSESSMENT
The objective of the resource assessment was to determine resource availability,
bioenergy potential, feedstock-technology interface and mass-energy balance (MEB) for
the relevant feedstocks in each demand sector, in this case dairy cattle manure in South
Africa.1 Existing data on livestock and manure production were used, adopting biomass
feedstock categories from FAO (2004) and IEA & FAO (2017). Country-specific resource
potential was calculated based on the amount of manure generated, the fraction
recoverable at large centralised dairies and its bioenergy potential (see data in Appendix
3). An MEB model was also developed, to simulate the energy system using validated
performance and efficiency data. Based on the known feedstock inputs of the flagship
project, the model quantifies expected material flows and outputs of heat and power
under optimised performance conditions, allowing replication potential to be estimated
based on the preceding assessment of the biomass resource.

2.4 TECHNOLOGY ASSESSMENT
The technology assessment aimed to determine the technological implications of
bioenergy use for heat and/or power production in each demand sector, in this case the
dairy sector in South Africa, based on technical considerations and practical experiences
at the Bioenergy Case flagship project at Uilenkraal dairy farm. The Uilenkraal AD
operation has been widely profiled in the bioenergy literature, being one of the first
such facilities in SSA. Exploring their experiences from a technical perspective also
required interaction with the farm’s owners through both remote contact and a site visit.
The technology and its supply chain landscape were characterised, and opportunities
and requirements for replication linked to technology were assessed.

2.5 ECONOMIC COMPETITIVENESS ANALYSIS
The objective of the economic competitiveness analysis was to compare energy costs
under the Base Case and the Bioenergy Case, to investigate potential economic drivers
for wider adoption of bioenergy in this demand sector. A 10-year discounted cash flow
analysis was carried out using an Excel-based Life-Cycle Cost (LCC) modelling toolkit
developed by AIGUASOL (see Appendix 4).2 The main economic indicator considered

1 The term ‘manure’ means cattle excreta, while ‘slurry’ refers to excreta plus urine, and ‘wash water’ refers to the water used
to clean stalls and milking parlours. For readability, ‘manure’ is used in much of this report as a catch-all term, but strictly
speaking the dairy residue stream comprises cattle slurry plus wash water.
2 10 years is a standardised period chosen for economic analysis based on an averaging of longer periods generally applicable

for sustainability assessments and shorter periods applicable for investors consideration, and is not necessarily indicative of
the functional lifetime of a particular project.

                                                                                                                                3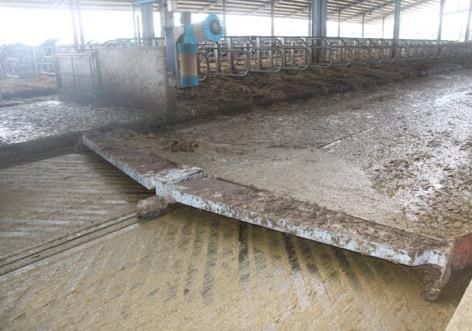
September 2021   www.ltsi.co.uk

was the Levelized Cost of Energy (LCOE), in USD/MWh. LCOE comprises CAPEX (upfront
investment and other amortizable costs), OPEX (personnel, consumables and operating
costs) and ABEX (abandonment expenditures). LCOE in this case was calculated for
electricity only. The LCC model was also used to perform sensitivity analyses on LCOE
considering a range of values for relevant input parameters.

2.6 COMMERCIAL VIABILITY ASSESSMENT
The objective of this assessment was to outline the commercial case for bioenergy use
in each demand sector, the factors affecting its successful adoption at the flagship
project and the potential for wider uptake in the same sector, based on barriers,
enablers, market potential and finance. The Bioenergy Case at Uilenkraal was first
analysed to identify the elements for commercial success linked, for example, to supply
chain ownership and demand for heat and electricity, and other factors such as waste
disposal and financing. Information about the operation was obtained from stakeholder
interviews and literature review. This was followed by an analysis of the wider
commercial potential for AD in the dairy sector, analysing the barriers and enablers for
supplying electricity under various scenarios. Taken together with an assessment of
market size and conditions, the barrier analysis gave an indication of wider market
potential. Finally, potential sources of finance and their relevance for bioenergy projects
such as this were assessed.

2.7 GENDER AND INCLUSION ASSESSMENT
The objective of the gender and inclusion research was to identify G&I-related issues in
each demand sector, and to highlight potential areas for improved awareness, inclusion
and participation of women. The research framework was adapted from a UNDP (2004)
toolkit, and was structured around: access to assets; beliefs and perceptions; practices
and participation; and institutional laws and policies. The research focused mainly on
the production and supply of feedstocks, and, where applicable, the bioenergy
conversion process. A literature review was also carried out, and further information
was gathered through interviews with informants working in G&I and at the flagship
project.

2.8 MULTI-CRITERIA ANALYSIS
A multi-criteria analysis (MCA) was carried out to summarise the degree to which each
of the study’s five thematic strands are conducive or detrimental to the successful
adoption of the particular bioenergy solution in each demand sector. Each theme was
given an average ‘score’ from 1 to 10, based on the degree to which various factors
(non-weighted) under each theme make a positive contribution (high score) or act as
an impediment (low score) to the viability of the Bioenergy Case. The MCA results are
presented in the report’s concluding chapter as a multi-point spider diagram, to provide
a graphical summary of the factors most likely to support or impede successful adoption
of bioenergy in the demand sector in question. The input data for the MCA are in
Appendix 5.

                                                                                                  4
September 2021 www.ltsi.co.uk
3 OVERVIEW OF THE DAIRY SECTOR
3.1 SECTOR LANDSCAPE
South Africa is SSA’s leading dairy producer and has the largest and most
commercialised dairy processing industry on the continent. Milk output has grown at an
average rate of 5% p.a. since 2000. South Africa’s national cattle herd numbers just
below 13 million, of which 20% are dairy cows. Most of the milk supply comes from the
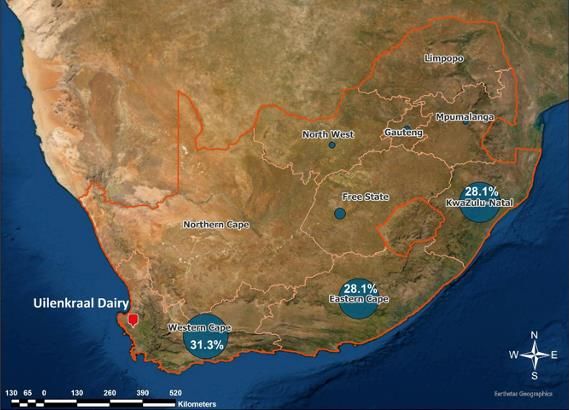
Eastern Cape, Western Cape and KwaZulu-Natal Provinces (Figure 3.1).
Figure 3.1: Milk output of main milk-producing provinces (Source: authors’ compilation with data from
Milk SA (2020a))
Milk production is important for income and employment at both small and large scale,
employing more than 40,000 people (Milk SA, 2020a). The sector is well organised, with
several national industry bodies, sophisticated commercial marketing and adherence to
international quality, hygiene and animal husbandry standards. This enables South
African dairy farmers to export their products all over the world.
South Africa’s dairy industry has seen considerable consolidation over the past two
decades, with the number of dairy farms decreasing from 50,000 in 1997 to just under
1,200 in 2020, with an average herd size of 459 in 2019, and some 170 farms now
having more than 1,000 head of dairy cattle (ibid.).
3.2 BIOENERGY IN THE DAIRY SECTOR
South Africa dominates the commercial biogas landscape in SSA and accounts for 23 of
the 51 commercial-scale AD projects identified in the ten BSEAA target countries
(BSEAA2 Stage 2 report). South Africa has pioneered AD innovation, with several ‘first
5September 2021 www.ltsi.co.uk
of a kind’ projects. For instance, the use of novel feedstocks (e.g. Napier grass tested
by Sucropower), novel technologies (e.g. an induced blanket reactor developed by
Renen) and novel business models (e.g. a 4.6 MW plant built and operated by Bio2Watt
at a cattle feedlot to supply power to an industrial off-taker).3
Greater adoption of this bioenergy solution has the potential to deliver environmental
benefits by reducing greenhouse gas emissions linked to the use of grid-based electricity
(given South Africa’s reliance on coal-fired power plants), avoiding methane emissions
and potential eutrophication from spreading cattle manure on fields. But while South
Africa is a leader in SSA’s biogas sector, there has been very limited successful adoption
of AD within the country’s dairy sector. Uilenkraal in the Western Cape is the only dairy
farm with an operational AD plant using cattle manure as feedstock for CHP.
With the ongoing concentration of dairy farming into a smaller number of ever-larger
concerns, it might be expected that the economic and technical potential for using cattle
manure and slurry for AD-based heat and power production would be growing, due to
economies of scale and improving access to manure from modern facilities with indoor
milking. But while dairy farms are becoming larger and fewer in number, a smaller
proportion are processing their own milk, so they have lower electricity requirements
and hence less motivation to self-generate power. In fact, the number of 'producer
distributors’ has decreased by two thirds over the past 11 years, from 170 in 2009 to
68 in 2020 (Milk SA, 2020a). The commercial opportunity for AD is therefore mixed.
This research explores the landscape for AD in South Africa’s dairy industry, and the
potential for further adoption within the sector.
3.3 INSTITUTIONAL, REGULATORY AND FINANCE FRAMEWORK
3.3.1 Institutional framework
The institutional framework for South Africa’s dairy sector is summarised in Figure
3.2. The main support and regulatory body is the Agricultural Production, Health & Food
Safety Branch of the newly created (2019) Department of Agriculture, Land Reform and
Rural Development. The Agricultural Research Council provides development and
capacity-building support for dairy farmers and for dairy products. The Chemicals and
Waste Management Branch of the Department of Forestry, Fisheries and the
Environment (DFFE) is responsible for regulating the management, disposal and use of
cattle and milk processing wastes, while the Food Control Section of the Department of
Health is responsible for dairy product quality, standards and hygiene. The Department
of Trade, Industry & Competition regulates commercial aspects of the dairy sector.
The commercial dairy sector is well-organised and represented by Milk South Africa
(Milk SA), founded in 2002 as a non-profit company to address the needs of the entire
industry, whose members comprise the Milk Producers' Organisation (MPO) and the
South African Milk Processors’ Organisation (SAMPRO). MPO represents producers of
unprocessed milk and provides training and support for sustainable dairy farming, while
SAMPRO is a membership organisation for the secondary dairy industry (e.g. UHT milk,
yoghurt and other milk-based products), with an active training subsidiary. Milk SA
3
See www.ibert.co.za/reference/sucro-power-mandini ; renen.co.za ; www.bio2watt.com
6September 2021 www.ltsi.co.uk
brings MPO and SAMPRO together to promote South Africa’s dairy producers, processors
and exporters, and to train them to the highest international standards.
Figure 3.2. Institutional framework for dairy sector in South Africa
The institutional framework for South Africa’s electricity sector is summarised in
Figure 3.3. Eskom is the national electricity utility and owns over 90% of the country’s
generation capacity, the entire transmission system and 60% of the distribution
network. In 2002, Eskom was converted from a statutory body into a public company
as Eskom Holdings Limited, in accordance with the Eskom Conversion Act (2001).
Municipalities and private companies own and manage the other 40% of electricity
distribution. Over 200 municipalities and large corporations have their own independent
electricity companies, some with their own generation capacity, and all with their own
distribution networks (Baker & Phillips, 2019).
The Department of Public Enterprises (DPE) oversees Eskom.4 South Africa’s electricity
sector is regulated under the National Electricity Regulatory Authority (NERSA). The
Department of Minerals Resources and Energy (DMRE) oversees the Renewable Energy
Independent Power Producer Procurement Programme (REIPPPP), which was set up in
2011, based upon the first Integrated Resource Plan (2010), to promote investment in
renewable electricity. The REIPPPP is run in conjunction with the National Treasury and
the Development Bank of Southern Africa (DBSA).5 It includes a Small Renewables
Independent Power Producer Procurement Programme covering procurement of 400
MW from projects between 1 and 5 MW (IPP Office, 2021).
4
See dpe.gov.za/about/
5 See www.ipp-renewables.co.za/
7September 2021 www.ltsi.co.uk
Figure 3.3. Institutional framework for electricity sector in South Africa
The REIPPPP is designed to stimulate innovative, commercially viable renewable energy
investments, both to meet South Africa’s rapidly growing electricity demand and to
contribute to the country’s aggressive climate change reduction targets, by replacing
coal-based power generation. Biogas is one of five eligible technologies.6 It has a target
of 17,800 MW of renewable energy by 2030 and has so far contracted 6,422 MW of
generation.7 While this accounts for only 6% of national capacity, the REIPPPP has
helped to increase renewable energy generation capacity from less than 700 MW in
2011 to an installed capacity of some 3,876 MW in 2019, with the remaining contracted
generation (2,546 MW) to be installed by 2021 (Republic of South Africa, 2019).
The REIPPPP is operated by the DMRE’s Independent Power Producer (IPP) Office,8
which runs a series of bid windows targeting specific renewable energy resources and
technologies.9 Bidders propose projects that meet the specified capacity, resource and
power purchase prices most competitively. The IPP Office negotiates Power Purchase
Agreements (PPAs) for successful applicants, working with the National Energy
Regulator of South Africa (NERSA) and Eskom.
Since the launch of the REIPPPP, 6,422 MW has been procured from 102 renewable
energy projects. The programme has been a success due to clarity in procurement
requirements and knowledge that procurement offers will be commercially bankable.
But because the REIPPPP sets an eligibility threshold of >1 MW generation capacity,
small-scale power producers generating ≤1 MW are not eligible. Thus, while the REIPPPP
has been very successful in increasing renewable electricity generation capacity, it has
excluded small-scale renewable electricity producers, particularly those using
bioenergy, including dairy wastes.10
6 See www.ipp-smallprojects.co.za
7 Bioenergy constitutes 51 MW of REIPPPP-procured capacity from four projects (all based on sugar cane bagasse).
8 The IPP Office, while under the DMRE, is separately located and is jointly funded by the DMRE, the National Treasury and the
DBSA. See: www.ipp-projects.co.za
9 The REIPPPP has had five rounds of bid windows (BW): BW1 (2011), BW2 (2012), BW3 (2013), BW3.5 (2014) and BW4
(2014). A fifth window is imminent as there has been nearly a 7-year delay in the bidding schedule.
10 Small-scale solar PV is an exception. By Dec 2019, >250 MW of small-scale solar PV had been installed in South Africa.
8September 2021 www.ltsi.co.uk On the consumer level, increasing numbers of large power users are starting to buy directly from non-Eskom suppliers, or at least limit their exposure to Eskom. Given Eskom’s growing fragility and unreliability, both in generation and distribution, South Africa’s President and its Minister of Mineral Resources pledged in late 2020 to open generation to non-Eskom sources. This marked the start of a major transformation of the power sector, as set out in the DMRE’s 2019 Integrated Resource Plan (IRP). In October 2020, the DMRE Minister gazetted amendments to the ‘Electricity Regulations on New Generation Capacity’, in terms of Section 35(4) of the Electricity Regulation Act of 2006 (DMRE, 2020b). These amendments opened the way for ‘municipalities in good financial standing to develop their own power generation projects’ for generating up to 100 MW of electricity. This must be in accordance with the IRP and the municipality’s own Integrated Development Plan. The amendments extend the procurement of new renewables, cogeneration, baseload, mid-merit, peak load, energy storage and cross-border generation capacity to organs of State ‘active in the energy sector’, which includes municipalities. The amended legislation also allows private, corporate and municipal power generators to sell to the grid if they generate more than 100 kW and allows new generators to invest in generation up to 100 MW with minimal paperwork. On 10 June 2021, following an extensive public consultation process by the DMRE, President Ramaphosa allowed these producers to sell excess electricity to the grid through agreements with Eskom and municipal authorities. Schedule 2 of the Electricity Regulation Act will be amended for this purpose. The final version of the amendment and associated rules are expected to be published in August 2021 (Republic of South Africa, 2021). It is anticipated that the above process will be much quicker than obtaining licences (Burkhardt & Mbatha, 2021).11 Large generators are the first to realise the opportunities of these pledges (Winning, 2021). The framework for Small Scale Embedded Generators (SSEGs) has also been set up within Eskom (Eskom, 2021) and within many municipalities (including the Cities of Cape Town, Ekurhuleni and Johannesburg). However, smaller-scale renewable electricity generators and SSEGs have yet to realise anything tangible from the recent announcements. SSEGs are typically
September 2021   www.ltsi.co.uk

residential estates, for selling electricity as ‘willing buyer-willing seller’ contracts. It is
important for NERSA to help promote such a development.
3.3.2 Policy and regulations
Dairy waste management: The disposal or use of manure, milk processing waste and
effluents associated with cleaning and disposing of those wastes are covered by national
and provincial laws and regulations under the Department of Agriculture, Land Reform
and Rural Development (DALRRD)’s Agricultural Production, Health & Food Safety
Branch and its Food Control Section; DFFE’s Chemicals and Waste Management Branch;
and the Department of Health. There are no regulations governing the spreading of
manure on fields. Similarly, no permits or licences are required if a farm gives animal
waste away, according to the Fertilizers, Farm Feeds, Agricultural Remedies and Stock
Remedies Act (Department of Agriculture, 1947). However, if a farm sells digestate as
an organic fertiliser, it needs to register with the above-mentioned DALRRD. This implies
that a farm can spread cattle manure as it wishes, but if it is upgraded to AD digestate,
then a licence is needed for its sale.
Electricity management: On the electricity side, South Africa has produced two IRPs,
the latest in 2019 (Republic of South Africa, 2019). The IRP is the National Electricity
Plan for the expansion of electricity supply, designed to identify investments required
for the country to meet its forecast electricity demand at the minimum cost.12 The IRP
is developed and overseen by the DMRE, which sets the policy framework and works
closely with NERSA. South Africa’s National Development Plan 2030 provides
overarching guidelines for the energy policy and regulation, and sets a target of
procuring at least 20,000 MW of electricity from renewables by 2030 by implementing
the IRP (National Planning Commission, 2011).
Over the past two years, shortages of electricity, reduced grid reliability, insufficient
firm generation capacity, and other problems with the national grid system have led
South Africa’s President and Minister of Mineral Resources and Energy to call for
considerable new investment in generating capacity from a number of sources.13
3.3.3 Finance
The REIPPPP has greatly facilitated the financing of renewable energy projects. A project
selected by the REIPPPP can obtain debt or equity financing with virtually any large
bank (such as Nedbank or Standard Bank) and with investment finance institutions
(such as Investec, ABSA Corporate & Investment Banking or Rand Merchant Bank) and
development finance institutions (such as DBSA or the Industrial Development
Corporation). A number of equity investors (both South African and international) have
invested in REIPPPP-qualified projects, including Globeleq, Loreko Metier Sustainable
Capital and Africa Infrastructure Investment Managers, among others.
For renewable energy projects that do not qualify for REIPPPP support, particularly
projects under 1 MW, securing finance is more difficult and more expensive. That said,
a non-REIPPPP project that has a PPA with Eskom, a municipal electricity company or a
major off-taker (e.g. a large mining concern or industry) will almost certainly still be

12 The 2019 IRP envisages the development of over 16.3 GW from a mix of sources, including 2 GW of emergency power to
meet short-term electricity gaps to be connected to the grid by June 2022, 6.8 GW from solar and wind, 513 MW from energy
storage, 3 GW from gas and 1.5 GW from coal. There is no mention of bioenergy. (Republic of South Africa, 2019).
13
   See, for example, “Minister Gwede Mantashe gazettes amendments to Electricity Regulations on New Generation Capacity”
www.gov.za/speeches/dmre-16-oct-2020-0000#

                                                                                                                          10
September 2021 www.ltsi.co.uk
bankable. There are a number of programmes in South Africa that provide finance and
technical support to renewable energy projects to help them reach bankability.
The Climate Finance Facility is a specialized lending facility of the DBSA that provides
financing for climate-related infrastructure projects in the Southern African
Development Community, of which South Africa is a member. The Facility provides
financing for mini-grid solar and urban solar farms in the range USD 5-10 million,
through instruments such as long-term subordinated debt and credit enhancement,
including tenor extension (up to 15 years) (DBSA, 2019).
The Embedded Generation Investment Programme supports the development and
upscaling of embedded generation projects in solar PV and wind energy, developed by
IPPs operating in South Africa. Funded by the DBSA and the Green Climate Fund, this
programme offers a credit support mechanism that enables funding of embedded
generation renewable energy projects, through the provision of risk capital for projects
implemented by private sector entities and local municipalities (DBSA, 2021).
The Sustainable Use of Natural Resources and Energy Finance (SUNREF) programme,
developed by the French Agence Française de Développement (AFD) Group with
financial support from the Swiss Government, mobilises South African banks to finance
investments to increase the use of renewable energy technologies. One area of SUNREF
focus is agro-processing. It partners with South African National Energy Development
Institute (SANEDI) and South Africa’s Industrial Development Corporation (IDC). AFD’s
credit line is a debt fund only, but can be combined with the IDC’s equity products in
some cases. SUNREF aims to facilitate access to affordable sustainable energy, to allow
companies to acquire higher quality equipment, to make cost savings, and to be more
competitive through better energy management and improved environmental
performance. SUNREF II is currently underway and includes a credit facility and
technical assistance (Zyl, 2020).
On 3 June 2021, the British High Commission, together with the National Business
Initiative and GreenCape, launched the Climate Finance Accelerator (CFA) with a call
for proposals for low carbon projects. The CFA is designed to help South Africa achieve
its ‘green’ targets (primarily in renewable energy, but also energy efficiency) set out in
its Nationally Determined Contributions under the UNFCCC’s 2015 ‘Paris Agreement’.
Beyond finance, the CFA provides a range of services to potential green investors,
ranging from access to other investors, to networking and coaching on best practices
(British High Commission, 2021). While no dairy AD projects have received finance from
the facilities and programmes highlighted above, these programmes do offer technical
assistance. Interviews with the South African Biogas Industry Association, SUNREF and
SANEDI did not, however, indicate any technical assistance for dairy AD, although there
was some interest in large-scale AD in the agro-industrial sector.
Finally, developers’ own finance and, in the case of imported equipment and machinery,
export supplier finance/credit/guarantees/insurance, is often available for top-of-the-
line equipment from such agencies as EH Group, Germany; COFACE, France; Denmark's
Export Credit Agency; UK Export Finance; the US Development Finance Corporation
(ex-OPIC); the US Export-Import Bank; and SACE (Gruppo CDC), Italy’s export credit
agency, among a number of others, when equipment is sourced from these countries.
11September 2021 www.ltsi.co.uk
4 OVERVIEW OF BIOENERGY CASE
4.1 PROJECT SUMMARY
The adoption of manure-based AD at the Uilenkraal dairy farm in the Western Cape is
a flagship project for the adoption of bioenergy technology and can be used to explore
the opportunities for other South African dairy farms considering similar investments.
Uilenkraal is a total mixed ration14 dairy cattle feedlot located 20 km north of Darling,
Western Cape. The farm is owned by the Basson family and has around 3,000 Holstein
Friesian cows and 800 oxen. Fresh milk is chilled at the farm and trucked offsite for
processing. While most dairy farms have only limited electricity requirements for milking
and chilling, Uilenkraal has additional power needs to run an onsite feed mill that
produces concentrated animal feed, under the Nutrikor brand.
In 2013, the farm owners went into partnership with Cape Advanced Engineering Ltd
(CAE), in nearby Atlantis, to install an AD system fed with cattle manure and wash
water for CHP production. The operational details below were kindly provided by
Uilenkraal and CAE, except where separately referenced. Appendix 6 contains a
selection of photos.
4.2 TECHNICAL DETAILS
The layout of Uilenkraal’s AD system is summarised in Figure 4.1.
MILKING SHED MILK COOLING IRRIGATION 2 X BACKUP FEEDMILL
400V & STORAGE 3000V DIESEL GENSETS 400V
600kVA each
400 kVA 600 kVA
transformer transformer
Eskom
11kV
500kVa 400V
3,000V 1000 kVA 1,000 kVA
transformer
transformer transformer
400V
LV
400V 2X GAS
GENERATORS
250kVA each
Hot Water Biogas
Manure
Pump Digestate Liquids
& slurry
COW SHEDS 180-320 m3/day GRIT & SAND FEED PIT DIGESTER SEPARATOR LAGOON
REMOVAL 7,000 m3
Solids
Dried digestate for bedding
FARMLAND
SOLAR DRYING Pasture & crops
w
Material flos Heat Electricity
Figure 4.1. Schematic diagram of Uilenkraal AD plant
14Total mixed ration is the dominant method globally for feeding high producing, indoor-housed dairy cows. The cattle are fed
a nutritionally balanced ration, allowing them to consume as close to their actual energy requirements as possible and
maintaining the right physical characteristics for proper rumen function.
12September 2021 www.ltsi.co.uk
4.2.1 Technology description
50% (1,500) of Uilenkraal’s dairy cows are usually in-milk and are confined indoors on
concrete floors, where their manure can be collected for biogas production. The other
dairy cows are with calves in outdoor pens with dirt floors, from which the waste is not
suitable for AD due to contamination with sand. Half of the farm’s 800 oxen are also
confined on concrete floors and their manure adds to that of the in-milk dairy cows,
giving a total of 1,900 cattle generating collectable and usable manure.
Uilenkraal initially used hydraulic scrapers for collecting the wastes. These broke down
due to sand abrasion and manure is now scraped using a tractor, three times per day,
after each milking session. The manure is blended with milking parlour wash water and
pushed into a concrete channel. This is angled at about 3 degrees to facilitate separation
of wind-blown sand as the manure/slurry blend flows to a holding tank, from where it
is pumped to the biogas digester at a rate of 180-320 m3 per day. The feed rate varies
significantly, according to CAE’s flow rate monitors, from zero to as much as 400 m 3
per day.
The balloon-type digester has a 7,000 m3 capacity and is built over a U-shaped pit that
is 6 m deep with sloping sides. While it resembles a standard lagoon digester, the
installation incorporates a heating and mixing system (the latter added around 2017).
It has an uninsulated single membrane with a water seal around the edges, weighted
down with sandbags. If there is no gas in the membrane it lies flat. Rainwater then has
a tendency to accumulate and has to be pumped off.
The digester has internal piping to circulate hot water from the gas generators’ cooling
system. Exhaust heat from the generators is not captured. CAE report that the high
moisture content of the biogas makes this an inefficient option. There are three heat
monitors inside the digester, with a target substrate temperature of 35-38oC. These
monitors appear to be faulty at times, with readings from 9 to 46oC recorded during the
site visit, and it is not clear that the heating system is working as intended.
Gas mixing takes place at the centre of the digester, where a supporting wall is located.
Air is injected to remove H2S. After a 20-40 day retention time, the gas (with around
60% methane content) is directed via a moisture scrubber to two 250 kVA/200 kW 3rd
generation ‘Organergy’ containerised gas generators from CAE.15
4.2.2 Power supply and demand
The farm owners estimate that the manure from four cows can produce sufficient biogas
to support a 1 kW electrical load. The 1,900 cows at Uilenkraal could therefore support
up to 475 kW.16 The farm’s power records show that the AD plant in fact supplied only
154 MWhe per month during 2020, translating to an average load of 211 kW. This
means that the plant is supplying as little as 44% of its estimated electricity potential,
based on the number of cows stalled and the owner’s expectations.
The farm’s electricity consumption records show that total average demand during 2020
was 293 kW. The electricity is used predominantly (60%) for the feed mill as well as
the milk plant (20%) and irrigation system (20%). With the AD plant supplying an
15CAE’s latest (5th generation) units are fitted with turbochargers that increase their rating to 300 kVA.
16
400 of the cattle are oxen and have lower manure output than the Friesians, so the assumption of 1 kW per 4 cows may be
optimistic across the whole herd.
13September 2021 www.ltsi.co.uk
average of 211 kW, it therefore met only 72% of the farm’s power requirements for
the year. The 28% shortfall (715 MWhe) was drawn from the grid.
Uilenkraal has two 600 kVA diesel standby gen-sets in case both the grid and biogas
generators are out of action. These run for up to two hours per day during the worst
periods of grid unreliability and produce electricity at three times the cost of grid power.
The biogas helps minimise the use of diesel when the grid power cuts out.
The farm’s power load drops to around 70 kW at night. One gas generator is usually
switched off and the other is throttled back. This reduces the heat available for digester
heating, so potentially has a negative impact on gas productivity.
It is clear that the design capacity of the system is not being fully achieved. On the
supply side, the gas generators are operating at as little as 44% of their potential, based
on the number of cattle feeding the system, while on the demand side, they are meeting
only 72% of the farm’s total power requirements. This reflects a combination of supply
and demand limitations. First, the digester is probably under-performing due to sand
ingress, crusting and (possibly) heater faults. Second, the gas generators (with 400 kW
combined capacity) cannot meet the peak power load of 700 kW when the feed mill is
operational. Third, there is no off-taker for the average surplus of 107 kW, which is
mainly available at those times when the feed mill is not active. Being unable to sell
excess power to the grid when the farm load dips, CAE is occasionally forced to flare
gas. These inefficiencies in both power generation and power consumption illustrate the
challenges of optimising such a system, and the complexity of plant sizing and load-
matching.
4.2.3 Use of digestate
The fibrous portion of the digestate is extruded through a screw press, dried in the sun
and mixed with sawdust to provide cattle bedding. This fibre was previously dried using
a biogas burner, but this was decommissioned as it consumed too much gas. The liquid
digestate is spread onto crops and pasture with a simple tractor/spreader system
(previously used for the spreading of manure). The best results are reportedly seen in
the damper winter season, whereas in summer the nutrients can ‘burn’ dry plants. While
a number of advantages of biogas digestate over untreated slurry as fertilizer are
mentioned in the literature, 17 the farm owner surprisingly reports no discernible
productivity improvement. The nearby Fair Cape Dairy is undertaking trials on the
efficacy of fortified biogas digestate as a soil improver.
4.2.4 Operation and maintenance
CAE has one operator permanently on site for routine monitoring and maintenance of
the AD plant and generators, and can bring in up to four additional staff at short notice
to rectify faults. The system is monitored remotely and triggers alarms if key
parameters are abnormal.
Ingress of sand into the digester has been an ongoing problem, especially during dry
and windy summer afternoons. As much as 2 m3 of sand was entering every day,
blended with the cattle manure, and some 2,000 m3 (3,200 t) of sand had to be
mechanically removed from the digester after three years of operation. The problem
17Digestate is said to be easier to pump and apply than untreated slurry; flows into soil faster; makes N and P more available;
avoids burning of plants; increases soil microorganisms and humus; improves pasture palatability; and reduces odours,
pathogens and weeds (Hawkins & Stanway, 2013).
14September 2021 www.ltsi.co.uk
was addressed by constructing two traps that now block 80% of the sand. CAE is
developing a system for extracting sand without removing the gas membrane.
Lagoon-type AD plants are technologically straightforward and cheaper than continuous
stirred tank reactors, but as a modified plug-flow system they bring a risk of crusting
and underperformance due to unequal heat distribution and control. The Uilenkraal
digester experienced repeated crusting during the first two years of operation, caused
by a combination of straw from animal bedding and the fibrous portion of the feed
rations that the cattle tend to selectively reject. This resulted in plant shutdown for
almost a year. The digester was eventually opened up and the crust, which was 4 m
thick in some places, was removed with a swamp excavator. Six 300 mm propeller
mixers were retrofitted to address the issue, though these may be under-sized and are
not operated continuously. The site visit revealed that the crusting is again becoming a
problem, and may require a second round of remedial measures.
The generators are serviced every 15,000 hours up to a projected lifespan of 60,000
hours, with replacement of pistons, connecting rods, bearings and liners, including new
valves, valve seats, valve guides and rockers.
The farmer has some concerns that improvements in the formulation of cattle feed to
optimise milk production may result in a reduction in gas production in the digester,
because more of the metabolizable energy is taken up by the cows and not left in the
manure. This could affect the performance of the AD system.
The farm owner reports that “It is not a turnkey system. Five years down the line we
are still learning”. Despite the challenges faced, the farm is making significant savings
on electricity (see next section) and the venture has been a valuable learning site for
CAE to improve its AD and generator technology, which it has been continually
upgrading for additional installations in South Africa and Namibia.
4.3 ECONOMIC ASSESSMENT
Table 4-1 summarises the data used in the LCC model for the Uilenkraal dairy, as the
Bioenergy Case, comparing it with a Base Case dairy farm drawing all electricity from
the grid. The economic assessment is modelled from the perspective of the farm
owners, and does not account for the costs and revenues of CAE, as the independent
technology provider and operator of the power plant.
Table 4-1: Key project data for economic modelling
Category Parameter Value
Discount rate 5.75%18
General General growth rate 4.10% (Consumer Price Index)19
parameters Electricity retail price ZAR 1.85/kWh (125.56 USD/MWh)20
Currency exchange rate 14.733 ZAR/USD (3-year average)
Source of electricity Eskom grid plus 2 x 600 kWe gensets
Base Case Electricity consumption 2,593 MWh/year
No. of livestock 1,900 cattle and oxen stalled indoors
18 www.photius.com/rankings/2020/economy/central_bank_discount_rate_2020_0.html
19 www.cia.gov/the-world-factbook/countries/south-africa/#economy
20 Eskom Ruraflex tariff, averaged from Uilenkraal’s 2020 invoices including all extra charges. It is assumed that the average
cost of grid electricity will remain the same after the reduction in power purchase following the installation of the AD plant,
although for various reasons related to tariff bands and ancillary charges for different levels of consumption at different times
of day, this may not be the case in practice.
15September 2021 www.ltsi.co.uk
Category Parameter Value
Biogas generators supplying most
electricity, supported by the grid. 600 kWe
Source of electricity
diesel genset for emergencies, with
negligible use
Gas generator rating 2 x 200 kWe
Bioenergy Power supply from AD 1,848 MWhe /yr (72% of total; balance
Case plant from Eskom)
ZAR 11 m (~USD 1.143 m) 21 plus ZAR 1.4
CAPEX (for AD+CHP)
m (~USD 0.105 m) retrofit, Yr 422
OPEX USD 36,600 per yr23
ZAR 0.74/kWh to CAE24 (USD 50.36/MWh);
Electricity price
Eskom power price as above.
Using these input parameters, the LCC model shows that the Uilenkraal AD plant
delivers a significant reduction in the cost of electricity for the farm, as shown in Figure
4.2. It is estimated that it delivers a reduction in LCOEelectricity from around USD 194 to
USD 172 per MWh, compared with the Base Case scenario.
Figure 4.2: LCOE comparison for electricity, Base Case vs. Bioenergy Case
4.4 COMMERCIAL SUCCESS FACTORS
The supply chain for Uilenkraal’s AD operation is summarised in Figure 4.3.
21 Average exchange rate in 2013: 0.104 USD/ZAR (www.excelrates.com/historical-exchange-rates/ZAR-USD)
22 Average exchange rate in 2017: 0.075 USD/ZAR (www.excelrates.com/historical-exchange-rates/ZAR-USD)
23 Assumes three full-time equivalent workers for manure scraping and feedstock management. As the analysis is from
Uilenkraal’s perspective, OPEX does not include CAE’s costs of operating and maintaining the gas generators.
24 Tariff charged by CAE to Uilenkraal in Feb 2021, reviewed periodically.
16You can also read


