Natural Gas & LNG Trends in Asia - The Volume Game is Strong - DBS
←
→
Page content transcription
If your browser does not render page correctly, please read the page content below

78
SECTOR BRIEFING

DBS Asian Insights
DBS Group Research • August 2019

                                   Natural Gas & LNG
                                       Trends in Asia
                                     The Volume Game is Strong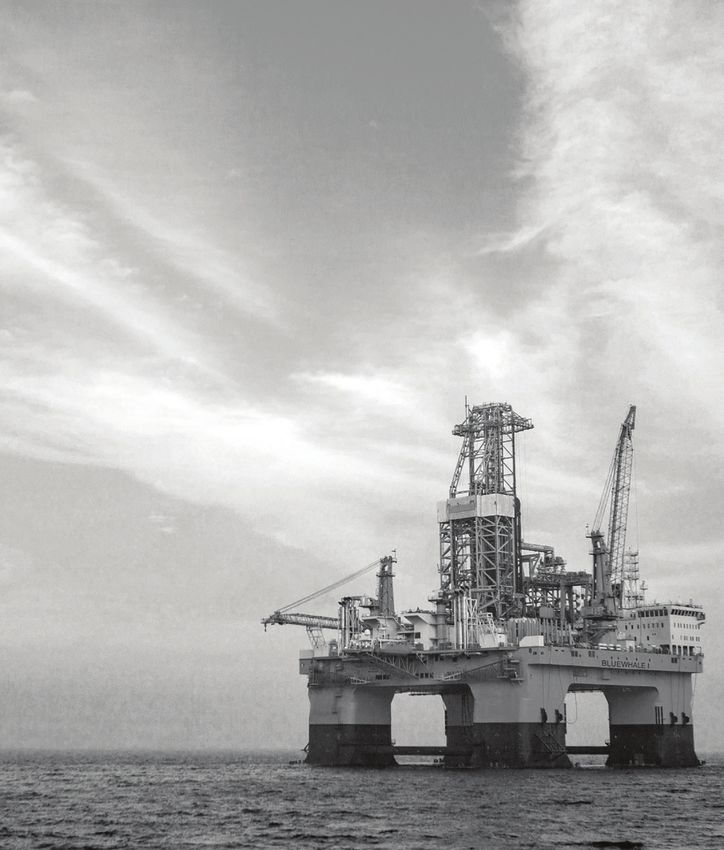
DBS Asian Insights
SECTOR BRIEFING 78
 02

Natural Gas & LNG
Trends in Asia
The Volume Game is Strong

Suvro SARKAR
suvro@dbs.com

Pei Hwa HO
peihwa@dbs.com

Patricia YEUNG
patricia_yeung@dbs.com

William SIMADIPUTRA
williamsima@dbs.com

QUAH He Wei
hewei@alliancedbs.com

Duladeth BIK
duladethb@th.dbs.com

Sabri HAZARIKA
Emkay Global Research

Singapore Research Team

Produced by:
Asian Insights Office • DBS Group Research

   go.dbs.com/research
   @dbsinsights
   asianinsights@dbs.com

Wen Nan Tan          Editor
Martin Tacchi        Art Director
DBS Asian Insights
                                      SECTOR BRIEFING 78
                                                            03

04   Executive Summary

08   Natural Gas Demand Overview
      Gas – An Important Part of Global Energy Demand
      Global Energy Mix Forecasts
      Global Natural Gas Demand Scenario
      Key Risks to Demand Projections

24   Regional Gas Demand & Policy Highlights
      China: Supportive Policy Environment
      India: Renewed Growth Impetus
      Indonesia: Commencement of Gas-fired Power
      Plants
      Vietnam: Emerging Demand Centre for LNG
      Bangladesh: Emerging Demand Centre for LNG

59   LNG Supply Trends
      Natural Gas Production Trends
      Major Players in LNG Export Market

71   LNG Pricing Trends
      Natural Gas Pricing Mechanism
      What is the S-Curve Pricing Model?
      Gas and LNG Prices Outlook
DBS Asian Insights
SECTOR BRIEFING 78
04
Executive Summary
Natural gas demand In our earlier report on Energy Mix 2030, we had concluded that despite a clear shift towards
will be strongest renewables in the future energy mix, from 15% in 2016 to 22% in 2030, we believe overall
amongst fossil fuels demand for the three key fossil fuels – coal, oil, and natural gas – will not peak till 2030, but
as we transition to grow at varying rates. Natural gas is projected to be the fastest growing fossil fuel in future.
a cleaner energy Natural gas, which has seen the strongest demand growth of late (2.8% CAGR over 2000-
environment 2018), will continue to grow at around 2% CAGR to 2030 by our estimates, while demand
for coal and oil will grow at a much slower pace. Most of the top 15 energy consuming
countries are looking at growth in natural gas demand on a 2030 timeframe, mainly as an
intermediate substitute between clean energy and dirtier fuels.
Favourable demand The overall outlook on natural gas demand is highly favourable, against the backdrop of
drivers in place for robust economic growth in developing economies, mounting global natural gas supply
natural gas and supportive government policies. As natural gas prices fall, its cost competitiveness in
relation to other fuels, especially coal, rises as well, promoting fuel switching. This has driven
natural gas demand in Europe in the past, but the next chapter of growth will be in Asia –
the region is expected to account for more than 50% of incremental gas demand to 2030,
bolstered by expeditious growth in China and to a smaller extent, India and other countries
in South and South East Asia. Beyond Asia, the Middle East is another promising market
that is poised to drive the consumption of natural gas.
The growth prospects Natural gas consumption is a mix of domestic production, pipeline imports and LNG imports.
for Liquefied Natural The LNG trade currently accounts for around 11% of global natural gas consumption and
Gas (LNG) appears even growing. We expect global LNG trade to sustain a robust CAGR of around 9% in the
more encouraging next couple of years. This is underpinned by dwindling growth in inter-country pipeline
infrastructure, declining domestic gas production in regions with finite or no pipeline
capacity, and an increase in new markets with LNG regasification capabilities. And with the
IMO2020 fast approaching, we should slowly see greater LNG bunkering demand, as more
offshore vessels switch to the fuel.
Advent of LNG has LNG has enabled countries hampered by limited reserves or deficient indigenous gas
reshaped the global production to gain access to natural gas, when pipeline infrastructure is unfeasible or non-
consumption of natural existent. Unlike pipeline gas, LNG supply is highly flexible and not bounded by logistical
gas, especially in Asia- limitations (though some countries have destination clauses) and can be redirected according
Pacific to regional fluctuations in supply and demand. This quality enables LNG to be particularly
useful in meeting excess demand during the peak seasons. With a volume CAGR of 6.5%
over the past seventeen years, LNG has been the fastest growing fossil fuel, as improved
cost efficiencies on the back of technological advancements and pipeline constraints drove
more countries to embrace the fuel. The Asia-Pacific region, with limited domestic gas
resources and pipeline infrastructure, has been the biggest driver of the LNG trade.DBS Asian Insights
SECTOR BRIEFING 78
05
Fall in gas prices will be Average Henry Hub prices for natural gas in the US have come down to between US$2/
positive for natural gas mmbtu and US$3/mmbtu in the last 3 years, down from highs of around US$9/mmbtu back
and LNG demand in 2008, before the shale revolution. As domestic shale gas production surged in the US, the
fall in domestic spot prices has resulted in increased consumption in the US, and as the US
prepares to export more gas overseas, and even to Asia-Pacific, lower imported LNG prices
should also spur the growth of LNG consumption in major importing markets.
Unavailability of required infrastructure is the only risk to growing LNG trade of required
import and processing infrastructure for LNG in target countries would be the key
impediment for LNG growth in future. We will study the infrastructure requirements for
LNG in more detail in an upcoming report. On the other hand, cross-border pipeline gas
competes directly with LNG in meeting domestic natural gas demand. Thus, availability of
established cross-border gas pipelines would adversely influence LNG demand.
China is the single Chinese demand accounts for almost 40% of total incremental natural gas demand estimates,
largest driver of natural going forward. This is driven by China’s desire to combat domestic environmental pollution
gas and LNG demand levels. China has set a target for natural gas to account for 15% of its energy mix by 2030 (up
in the near to medium from 6-7% currently). The natural gas consumption CAGR in China was a robust 16% from
term 2005 to 2015. Although demand for natural gas slowed down with consumption of just 3%
and 8% in 2015 and 2016 respectively since the collapse of the oil price during 2014, gas
consumption rebounded substantially to double-digit after the Chinese government launched
more supportive policies to stimulate demand. In 2018, total gas consumption reached
282bcm, a growth of 18%. We expect the growth rate to sustain at low-teens for the coming
few years with total gas consumption reaching around 440bcm by 2022. Despite efforts to
increase local gas production and new gas pipelines from Russia, this will also translate into
healthy LNG demand growth trends in excess of 10% CAGR in the near term.
India natural gas India is another emerging driver of natural gas demand in the region. Natural gas demand
demand will rebound growth had slowed down to 2-3% in FY19 vs 6-7% in FY17-18; but we expect to see
over the next few years improvement in demand growth to around 9% CAGR over the next couple of years on
after a tepid FY19 the back of new supplies and demand from City Gas Distribution, refineries and industries.
Power sector demand would also improve on the back of low spot LNG prices. LNG demand
growth from India is likely to be in line with overall gas demand growth.
US exports are a The dramatic increase in US shale gas production and LNG liquefaction capacity enabled
disruptive force in the the country to swiftly climb the ranks to become a global LNG powerhouse, a remarkable
global LNG market feat considering that the US barely exported any LNG before 2016. The country exported
21mt of LNG in 2018, up 600% from 2016, with 6.7% of global market share. Similarly,
liquefaction capacity stood at 21.8mtpa in 2018, up significantly from 5.5mtpa in 2016,
with five LNG terminals turning operational during the period. With the consumption
boost by the global trend in shifting the energy mix towards natural gas to combat carbon
emission, US LNG exports are set show highest growth trends in near term among all
exporting countries.DBS Asian Insights
SECTOR BRIEFING 78
06
Global LNG supplies Despite strong LNG demand trends globally, not only in Asia-Pacific, but also in developed
overwhelm demand in markets like Europe which are seeing fuel switching in the power sector owing to record low
near term LNG prices, we believe LNG supply capacity will be higher than actual demand requirements
in the near term, with LNG supply capacity expected to grow at 11% CAGR over the next two
years compared to 9% CAGR in LNG demand. The supply surge will be driven primarily by the
US, followed closely by Russia, as more export terminals come on stream.
Spot pricing gaining According to data from the International Gas Union (IGU), the proportion of oil-linked LNG
momentum in LNG imports has fallen from about 80+% in 2005 to around 75% in 2016 to around 66% in 2018.
imports 2018, however, has shown the most significant change in LNG imports, driven by the continued
rise in Henry Hub benchmarked US LNG exports, but also by a general rise in spot LNG cargoes.
Despite the rise in LNG imports of around 5.5% in 2018 compared to 2017, oil-indexed LNG
imports actually fell in 2018, as gas-on-gas priced (benchmarked to spot gas indices) contract
cargoes and spot LNG cargoes rose in eminence. Spot LNG cargoes totalled some 126 bcm
in 2018 (30% out of total LNG imports of 416bcm), compared to 92 bcm in 2017 and just
70 bcm in 2016. This has been driven by Asian countries, parts of Europe and emerging LNG
importers. This makes expectations of spot Henry Hub prices important from the Asian context
as well, where there has been historically a dependence on oil price movements.
Henry Hub prices Typically, gas price forecasts for a country level depend on the following factors: i) overall GDP
should remain subdued growth and growth rate of gas consumption, ii) growth rate of domestic gas production, iii)
growth of net imports and iv) cost of domestic production. While natural gas demand in the
US has been holding up and expected to do so in the future as well, it is overwhelmed by the
rise in supply in recent years. With oil prices expected to remain above US$60/bbl, increase in
shale oil production will also boost associated gas production in the US. This means gas storage
levels at end of 2019 are expected to be higher than the number in 2018. Breakeven prices for
new gas fields in the US are also expected to remain below US$3/mmbtu. Hence, we believe
gas prices in 2019/20 will weaken from 2018 levels (around US$2.7-2.8/mmbtu compared to
US$3.1/mmbtu average in 2018).
Asian spot LNG For importing countries, in addition to earlier mentioned factors, prices need to take into
benchmarks should account liquefaction and shipping costs for LNG. But surging LNG supplies into Asia, especially
rebound from current from the US and Russia, among others, have resulted in spot LNG prices falling to levels of
trough, but will remain around US$4.5/mmbtu in June 2019, compared to an average of over US$9/mmbtu in 2018
lower than historical (more than 50% decline). Historically, spot LNG prices in Asia have been highly correlated to
levels international crude oil price levels owing to the high proportion of oil linked pricing contracts.
But with more gas-on-gas pricing (benchmarked to spot gas indices) coming in and price slopes
of oil linked contracts also declining to 11-12% range rather than historical 13-15% range,
prices have adjusted downwards. We believe Asian spot LNG prices will rebound from current
trough levels over the next two years to incentivise infrastructure builds in the region, but will
be still be lower on average than historical levels. Medium term supply pricing estimates into
Asia lead us to forecast Asian spot LNG prices to average around US$6-7/bbl on an annual basis
in the medium to long term.DBS Asian Insights
SECTOR BRIEFING 78
07
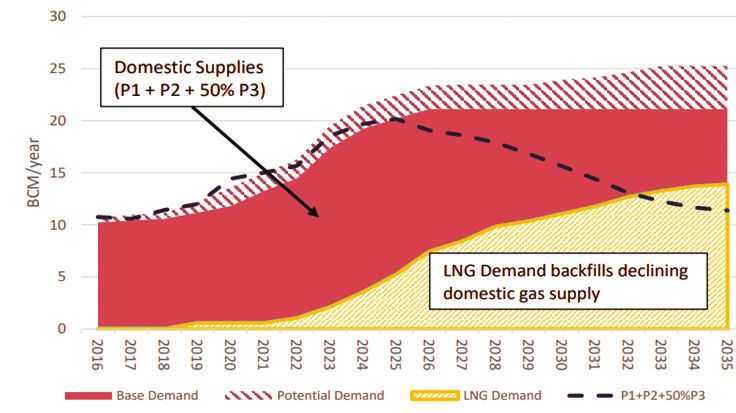
Trends and near term forecast of global LNG demand
(In million tonnes) 2016 2017 2018 2019F 2020F
Japan 83.3 84.5 83.2 81.2 79.6
South Korea 33.7 38.6 44.5 42.1 40.2
Taiwan 15.0 16.8 17.1 17.5 18.0
China 26.8 39.5 54.8 62.5 67.3
India 19.2 20.7 23.3 25.8 27.9
Rest of Asia 9.0 12.1 16.2 24.4 30.5
Europe 38.3 46.8 50.1 70.7 83.5
Rest of world 34.1 32.7 27.3 24.6 25.8
Global LNG Demand 259.4 291.7 316.6 348.8 372.8
Growth y-o-y 12.4% 8.5% 10.2% 6.9%
Source: International Gas Union, DBS Bank forecasts
Trends and near term forecast of global LNG supply
In million tonnes 2016 2017 2018 2019F 2020F
Qatar 78.7 76.7 78.7 79.0 79.0
Australia 43.8 56.4 68.6 78.5 80.9
United States 2.9 12.9 21.1 32.0 56.4
Russia 10.8 11.1 18.9 28.6 30.9
Rest of world 122.2 131.3 129.3 135.7 139.6
Global LNG Supply 258.3 288.4 316.5 353.9 386.7
Growth y-o-y 11.6% 9.8% 11.8% 9.3%
Source: International Gas Union, DBS Bank forecasts
LNG supply will overshadow demand in the near term, lowering prices and
boosting LNG demand in the medium term
Source: International Gas Union, DBS Bank forecastsDBS Asian Insights
SECTOR BRIEFING 78
08
Natural Gas Demand
Overview
Gas: An Important Part of Global Energy Demand
Growth in global GDP The world economy continues to grow, driven by increasing prosperity in the developing
will continue to boost world. Global GDP growth is projected to average around 3.25% p.a. to 2030, not too
demand for energy different from growth rates in the past two decades or so. Global output is partly supported
by population growth, with the world population increasing by around 1.2 billion to reach
nearly 8.5 billion people in 2030, a CAGR of just over 1%. But the main driver of economic
growth is increasing productivity (i.e. GDP per person), which accounts for the majority of
global expansion and is expected to lift more than 2.5 billion people out of the low income
group. The increasing prosperity of the developing world is a key force shaping economic
and energy trends over the next 25 years. Over 80% of the expansion in world output
is driven by emerging economies, with China and India accounting for over half of that
expansion. While African countries will likely account for nearly half of the increase in global
population, contribution to world GDP growth will be less than 10% as it continues to be
weighed down by weak productivity.
Growth rates will The expansion in global output and prosperity drives the growth in energy demand, with
however slow down, growth in energy consumption led by fast-growing developing economies. Global energy
compared to previous demand is forecast to grow at around 1.5% CAGR till 2030, as highlighted earlier, but this
decades is a slowdown from over 2% energy demand CAGR in the previous 20 years. The slowing
demand growth is largely due to deceleration in population growth trends, and better energy
efficiency – that is, energy intensity (units of energy used per unit of GDP) falling more quickly
than in the past. Global GDP is projected to grow by 3.25% till 2030, but the increase in
energy consumption is only 1.5%. The other key trend contributing to lower energy intensity
is increasing electrification of final end-user demand, especially in transport and heating.
The world’s energy The world’s energy intensity has been declining on average by 1.4% per year for the
system is highly last two decades. One of the main reasons for this is accelerating electrification of the
sensitive to changes in energy system, as electricity use is more efficient than burning fossil fuels directly with less
energy efficiency heat loss. This effect is accentuated by the move towards renewables – as solar and wind
generation capacity has insignificant associated energy losses. The efficiency trend will be
further boosted by the mainstreaming of electric vehicles, which typically consume less
energy compared to liquid fuel powered vehicles. There are lower efficiency improvements
in aviation, maritime and rail transport sectors as internal combustion engines are likely to
be the mainstay in these sectors in the medium to long term.DBS Asian Insights
SECTOR BRIEFING 78
09
Clear trend towards We expect global energy demand to increase at an average rate of about 1.5% p.a. from
renewables, but 2017-2030, which is premised on the back of a 3.25% p.a. growth in global GDP, offset
fossil fuel demand by improvements in energy efficiency (i.e. declines in energy intensity). Despite a clear shift
to continue growing towards renewables in the energy mix, from 15% in 2016 to 22% in 2030, we believe
nonetheless demand for the three key fossil fuels – coal, oil, and natural gas – will not peak till 2030,
albeit growing at differing rates. Natural gas demand will be strong and in 2030 is expected
to be c.33% higher than 2016’s level, by our estimates, while demand for coal and oil will
grow much slower.
Natural gas demand China is the single largest driver of natural gas demand through to 2030, accounting for
will be strongest almost 40% of total incremental natural gas demand in 2030 as compared to 2016 levels,
amongst fossil fuels, on our estimates. This is driven by China’s desire to combat domestic environmental pollution
driven by Chinese levels. China has set a target for natural gas to account for 15% of its energy mix by 2030
consumption (up from 6-7% currently). Notably, out of the top 15 energy consuming countries, 12 are
looking at growth in natural gas demand on a 2030 timeframe, mainly as an intermediate
substitute between clean energy and dirtier fuels.
Global Energy Mix Forecasts
Change in global energy mix – Change in China’s energy mix – Change in India’s energy mix –
2016 vs. 2030 (DBS expectations) 2016 vs. 2030 (DBS expectations) 2016 vs. 2030 (DBS expectations)
Source: BP data, Government data, DBS Bank forecastsDBS Asian Insights
SECTOR BRIEFING 78
10
Global Natural Gas Demand Scenario
What is the role of natural gas today?
Natural gas is used across a multitude of sectors, but generally, natural gas is largely used
for the generation of electricity (most of which is generally utilised for cooling), heating
(space/water/industrial) purposes, and increasingly, as a feedstock for petrochemicals and
fertilisers. Within the transportation sector, natural gas is used as fuel for natural gas vehicles,
while liquefied natural gas or LNG is used as ship fuel for offshore vessels. Naturally, the
composition of natural gas usage diverges across geographic regions, because of uneven
resource endowment and different economic development status. The charts below
illustrate the differences in composition of natural gas demand in a developed country like
the US vs. a developing country like India.
India natural gas demand US natural gas demand
composition composition
Source: Ministry of Petroleum and Natural Gas, India Source: EIADBS Asian Insights
SECTOR BRIEFING 78
11
Asia has been a key The consumption of natural gas has grown across all geographic regions, albeit at varying
driver of natural gas degrees, with significantly higher growth from emerging markets. Asia Pacific and the Middle
demand East, which were the fourth and fifth largest consuming regions respectively back in 2000
(accounting for 12% and 8% of global consumption then), are now the world’s second
and fourth largest consuming markets. On the contrary, while North America remained
the leader in natural gas consumption, its share of global consumption reduced to 26% in
2017 from 31% in 2000. Similarly, Europe’s significance to global natural gas demand has
also faded, with its share of global consumption falling to 14% in 2017 from 20% in 2000.
Breakdown of natural gas usage by region
Source: BP Plc (Note - Bcm: billion cubic metres)
Developing countries are now taking a bigger share of the natural gas demand pie
Source: BP PlcDBS Asian Insights
SECTOR BRIEFING 78
12
Drivers of natural gas and LNG demand growth
Natural gas consumption growth has varied considerably across geographies in the past.
The difference primarily reflects the contrast in economic growth rates and improvements in
energy efficiency between regions. Other factors include earlier and more rampant adoption
in developed markets, and more importantly, the proliferation of natural gas infrastructure.
Such infrastructure, which include long distance natural gas pipelines and LNG regasification
terminals, are crucial in providing supply to regions with inadequate domestic natural gas
production, like the Asia Pacific.
Advent of LNG is LNG has allowed countries hampered by limited reserves or deficient indigenous gas
reshaping global production to gain access to natural gas, when pipeline infrastructure is unfeasible or non-
consumption of natural existent. Unlike pipeline gas, LNG supply is highly flexible and not bounded by logistical
gas, especially in Asia- limitations (though some countries have destination clauses) and can be redirected according
Pacific to regional fluctuations in supply and demand. This quality enables LNG to be particularly
useful in meeting additional demand during peak seasons. With a volume CAGR of 6.5%
over the past seventeen years, LNG has been the fastest growing fossil fuel, as improved
cost efficiencies on the back of technological advancements and pipeline constraints has
driven more countries to embrace the fuel. The Asia-Pacific region, with limited domestic
gas resources and pipeline infrastructure, has been the biggest driver of the LNG trade, as
can be seen in the following charts.
LNG’s share of total natural gas supply has nearly doubled from 2000-17
Source: BP PlcDBS Asian Insights
SECTOR BRIEFING 78
13
Asia-Pacific region is by far the largest importer of LNG…
Source: International Gas Union
…contributing >80% of LNG demand growth in the past eight years
Source: International Gas UnionDBS Asian Insights
SECTOR BRIEFING 78
14
Summary of factors driving natural gas demand
Driver Description Impact
Natural gas
Economic Similar to other fossil fuels, economic growth is a paramount driver of demand as
growth strong economic activity leads to greater energy consumption.
Energy Continued technological innovation will enable the same functions to be performed
efficiency with less energy.
Weather There are limited short-term alternatives to natural gas as a fuel for heating and
anomalies electricity generation (for cooling purposes) during peak demand periods. Thus,
there are often spikes in demand amid extreme weather patterns.
Fuel switching In the short-run, fuel switching often occurs based on changes in the marginal
cost of consumption, if substitution is practical or if excess capacity permits.
Otherwise, fuel switching could also occur if there are significant unplanned power
plant outages, or if the length of planned power plant outages exceeds initial
expectations.
Over a longer period, capacity constraints become less relevant (as new power plants
can be built), and instead, future expectations of overall cost competitiveness among
fuels, as measured by the levelised cost of energy and levelised avoided cost of
electricity, become more pertinent.
Changes in Growth in indigenous natural gas production has a positive correlation with
indigenous demand, provided it is meaningful enough to slash import dependency – a larger
natural gas proportion of cheaper domestic gas would moderate fuel costs and consequently
production spur the consumption of natural gas.
Gas pipeline The expansion of domestic gas transmission and distribution networks is crucial for
grid and promoting access to gas in households, and commercial and industrial buildings.
storage Similarly, gas storage is essential for managing seasonal fluctuations in gas demand.
infrastructure Hence, augmenting the underlying gas network would translate into higher
demand.
Constructive Governments around the world are increasingly implementing favourable policies
government to spur natural gas consumption. Policies include mandating the consumption of
policies natural gas in certain sectors, carbon pricing schemes, and even subsidies on the
production of natural gas.
Additional factors driving LNG demand
Driver Description Impact
Liquefied natural gas
Cross-country Cross-border pipeline gas compete directly with LNG in meeting domestic natural
gas pipeline gas demand. Thus, an increase in cross-border gas pipelines would adversely
development influence LNG demand.
Infrastructure Countries that are reliant on gas imports, but with low or no pipeline gas capacity
composition have no choice but to use LNG for natural gas consumption. Natural gas demand
in strategic growth in this category of countries will be more constructive in boosting LNG
growth demand.
centres
Development An increase in the number of countries with LNG receiving terminals will propel
of LNG demand for LNG. Additionally, innovative technology like the deployment of
receiving floating, storage and regasification units can reduce the time and capital required to
capabilities gain LNG receiving capabilities, and consequently encourage consumption.
Source: DBS BankDBS Asian Insights
SECTOR BRIEFING 78
15
Weather plays an important part – gas demand tends to surge in winter, as seen in Japan’s historical LNG import
trends (LHS) and warm summers also lead to higher gas demand, albeit a smaller extent than winter (RHS)
Note: A heating degree day (HDD) is a measurement designed to quantify the demand for energy needed to heat a building.
It is the number of degrees that a day’s average temperature is below a certain temperature, say 65o Fahrenheit (18o
Celsius), which is the temperature below which buildings need to be heated. On the other hand, a cooling degree day (CDD)
is a measurement designed to quantify the demand for energy needed to cool buildings. It is the number of degrees that a
day’s average temperature is above a certain temperature, say 65o Fahrenheit (18o Celsius).
Source: Bloomberg Finance N.V., DBS Bank
Shifting between fuels is another driver – in the US, power generation demand has historically alternated
between coal and gas generation, depending on the spread between gas and coal prices
Note: % on the RHS index illustrates proportion of gas in total gas +coal fired generation; LHS index is a measure of difference
between gas prices and implied coal prices (spread) on a US$/mmbtu basis (US$ per one million British Thermal Units)
Source: EIA, DBS BankDBS Asian Insights
SECTOR BRIEFING 78
16
Shifting between fuels is another driver – in Japan, incremental natural gas consumption is inversely
proportional to nuclear power generation
Note: million tonnes of oil equivalent
Source: BP Plc, DBS Bank
Policy initiatives are Despite being less capital intensive, natural gas is consistently more cost competitive than
important to grow coal mainly in countries with abundant gas supplies. Fuel cost continues to be a big hurdle in
demand for natural gas countries reliant on gas imports, even though global gas prices have decreased considerably
as it may not always be in recent years. However, gas is slowly catching up as more countries introduce carbon
competitive to coal on pricing policies to tip the balance against coal (gas produces 40%-60% less greenhouse
a LCOE basis emissions compared to coal, depending on the technology of the power plant).
What is the levelised cost of electricity?
According to the EIA, the levelised cost of electricity (LCOE) represents the average revenue
per unit of electricity generated that would be required to recover the costs of building and
operating a generating plant during an assumed financial life and duty cycle.
Key inputs include:
• Capital investment
• Financing costs
• Fuel cost
• Other fixed and variable O&M costs
• Carbon taxes
• State/federal tax credits and incentivesDBS Asian Insights
SECTOR BRIEFING 78
17
More countries are adopting carbon pricing initiatives to restrict carbon emissions
Source: World Bank
Coal consumption in the UK plummeted after the introduction of carbon pricing in
2013; on the other hand, natural gas demand stayed resilient
Source: BP Plc
Fall in gas prices will be Average Henry Hub prices for natural gas in the US have come down to between US$2
positive for natural gas per one million British Thermal Units (mmbtu) and US$3/mmbtu in the last 3 years, down
and LNG demand from highs of around US$9/mmbtu back in 2008, before the shale revolution. As domestic
shale gas production surged in the US, the fall in domestic spot prices has resulted in
increased consumption in the US, and as the US prepares to export more gas overseas, and
even to Asia-Pacific, and lower imported LNG prices should also spur the growth of LNG
consumption in major importing markets.DBS Asian Insights
SECTOR BRIEFING 78
18
The shale revolution in the US drove domestic gas prices down substantially and
consequently led to higher consumption
Source: EIA, Bloomberg Finance N.V.
Availability or Cross-border pipeline gas competes directly with LNG in meeting domestic natural gas
unavailability of required demand. Thus, availability of established cross-border gas pipelines would directly influence
infrastructure also has LNG demand. On the other hand, lack of required import and processing infrastructure for
a big bearing on gas LNG in target countries would also be an impediment for LNG growth.
consumption trends
Availability of pipeline infrastructure for US gas imports has restricted LNG demand
growth in Mexico despite rising natural gas consumption
Source: BP PlcDBS Asian Insights
SECTOR BRIEFING 78
19
Growth in LNG demand has been more pronounced in countries with limited or no
pipeline infrastructure
Source: International Gas Union
How is demand for natural gas and LNG likely to change in
the long run?
Broadly speaking, the overall outlook on natural gas demand is highly favourable, against
the backdrop of robust economic growth in developing economies, mounting global
natural gas supply, and supportive government policies. Natural gas is projected to be the
fastest growing fossil fuel, with estimates among oil supermajors, leading consulting firms
and government agencies ranging between 1.5-2.0% in the next five to twenty years. Our
own forecast is at the higher end of this range, at around 2.0% CAGR to 2030. Historical
trends are likely to persist, as developed markets continue to take the back seat and give
way to emerging markets. Asia in particular, is the most crucial chapter to the growth
story – the region is expected to account for more than 50% of incremental gas demand
between 2017-2035, bolstered by strong growth in China and to a slightly smaller extent,
India. Beyond Asia, the Middle East is another promising market that is poised to raise its
consumption of natural gas.
LNG’s growth prospect We expect global demand of the fuel to sustain a robust CAGR of around 9% in the next
appears even more two years. This is underpinned by dwindling growth in inter-country pipeline infrastructure,
encouraging declining gas production in regions with finite or no pipeline capacity, and an increase in new
markets with LNG regasification capabilities. And with IMO2020 fast approaching, we should
slowly see greater LNG bunkering demand, as more offshore vessels switch to the fuel.DBS Asian Insights
SECTOR BRIEFING 78
20
Consensus natural gas demand growth at around 1.5-2.0% over next 15 years
Source: Various companies/ institutions as shown above
LNG import trends (select Asian importers account for almost 70% of total)
Source: International Gas Union
Global LNG demand projections and near term forecasts by geography
(In million tonnes) 2016 2017 2018 2019F 2020F
Japan 83.3 84.5 83.2 79.6 78.8
South Korea 33.7 38.6 44.5 42.1 40.2
Taiwan 15.0 16.8 17.1 17.5 18.0
China 26.8 39.5 54.8 62.5 67.3
India 19.2 20.7 23.3 24.5 26.7
Rest of Asia 9.0 12.1 16.2 20.3 25.4
Europe 38.3 46.8 50.1 75.8 85.3
Rest of world 34.1 32.7 27.3 28.7 30.1
Global LNG demand 259.4 291.7 316.6 351.0 371.8
Growth y-o-y 12.4% 8.5% 10.9% 5.9%
Source: International Gas Union, DBS Bank forecastDBS Asian Insights
SECTOR BRIEFING 78
21
LNG import demand drivers by country/region
Country Summary of critical demand drivers
China • Natural gas consumption has boomed in China with favourable government policies –
conversion of coal fired boilers, and rural coal-to-gas conversion for winter heating, in
addition to industrial and commercial use.
• Domestic supply growth not enough to meet demand growth, widening gap for imports;
future gas production targets also likely to fall behind schedule.
• Growth in China’s LNG demand will be moderated though by rising pipeline imports,
especially from Russia.
India • Massive expansion of City Gas Distribution sector with 136 areas auctioned in recent
bidding rounds; industrial-commercial piped gas demand will be met through imported
LNG
• Fall in spot LNG prices should revive interest from the power sector, significant demand
uptick possible if gas-fired power plants’ PLF improves to 50% from current 23% levels.
• RIL and ONGC’s KG deepwater assets to bring sizeable domestic gas supplies over next few
years, though timing of peak supplies could vary, and necessitate more LNG imports than
currently anticipated.
Japan • The resurgence of nuclear energy is anticipated to erode demand for gas-fired power
generation. However, the Nuclear Regulatory Authority’s (NRA) decision to not extend
deadlines for mandatory anti-terrorism measures could lead to the shutdown of several
operating nuclear reactors and delay the restart of others. This would bolster LNG demand
by around 1-2mtpa.
• Renewable power capacity, which has been growing rapidly owing to Feed-in-Tariffs (FiT) in
Japan, is also expected to displace gas-fired power generation.
• An ageing population and declining industrial activity should put a lid on gas demand
growth in the residential and industrial sectors.
Korea • Despite the government’s plans to boost natural gas consumption in the long-term, LNG
demand in the short run is likely to deteriorate, due to the addition of new nuclear and
coal-fired plants over the next few years.
• Residential and commercial gas demand should continue to climb on the back of enhanced
gas access, driven by the expansion of the domestic gas transmission and distribution
network.
Taiwan • Favourable prospects for LNG demand growth attributable to the government’s plans to
phase out nuclear power generation by 2025.
• However, LNG demand growth is constrained by its limited regasification capacity –
regasification utilization exceeded 120% in 2018.
Europe • LNG demand is primarily supported by the region’s subdued natural gas production, which
declined to a 25-year low in 2018.
• Additionally, concerns over the region’s over-dependency on pipeline gas from Russia will
likely spur a transition into LNG, given the region’s unutilized regasification capacity.
• Current European gas prices should drive demand for gas-fired power generation, as gas
prices have fallen close to the lower bound of the fuel-switching range, indicating that even
the less efficient gas plants are cheaper than the more advanced coal plants.
Source: DBS BankDBS Asian Insights
SECTOR BRIEFING 78
22
Key Risks to Demand Projections
US-China trade war is the chief near-term risk
The risk of a protracted full-fledged trade war with multiple rounds of tariffs on a wider
array of imports seems more probable now than earlier, given the more hawkish rhetoric
from both sides, and sudden skirmishes on the technology front. In the event of an all-out
trade war, our economists expect that in 2020:
• China’s real GDP growth would fall to 5%
• US GDP growth would ease to 1%
• Global growth to weaken by 0.5-0.75ppt
This may have significant repercussions on global energy demand, especially since China is
anticipated to constitute for the majority of demand growth in our forecast period.
Faster than envisaged rise in renewable energy capacity
could erode natural gas’s market share in electricity
generation
After years of technological improvements, renewable fuel sources are now progressively
able to compete with fossil fuels on an equal footing and are projected to be consistently
more affordable by 2020, according to the International Renewable Energy Agency. While
natural gas is complementary to renewable fuel, which tends to be inherently unreliable
and an intermittent source of energy without further advancements in battery technology,
sustained advances in renewable energy will steadily diminish the significance of natural gas
in power generation. Additionally, the re-emergence of nuclear energy in certain countries
could also pose a threat to natural gas demand.
Global LCOE of renewable energy technologies has come down tremendously over the past 8 years
Source: International Renewable Energy AgencyDBS Asian Insights
SECTOR BRIEFING 78
23
Rapid improvements in energy efficiency could curb demand
Although this trend will likely only materialise gradually over our forecast horizon, it should
not be overlooked, given the substantial enhancement in energy efficiency over the last
decade.
Complex supply chain requirements could stifle demand
growth
The LNG industry a is highly complicated and integrated value chain, comprising liquefaction,
shipping, regasification, storage and delivery to end-customers. A disruption to any part of
the equation could hinder demand growth. For example, repeated delays and hiccups in
regasification project developments have historically stifled LNG demand growth. Within
emerging regions, such projects are not only subjected to elevated regulatory uncertainty,
but also to considerable execution risks, as advanced technical capabilities and deep pockets
are a prerequisite for successful completion. In a similar vein, inadequate expansion of LNG
carrier capacity could prevent suppliers from reaching end consumers in a timely manner,
and consequently threaten LNG demand growth.DBS Asian Insights
SECTOR BRIEFING 78
24
Regional Gas Demand &
Policy Highlights
China: Supportive Policy Environment
With an objective to ‘Make the skies blue again’, China has embarked on various policies to
reduce the proportion of dirtier fuels in its energy mix, while boosting the usage of cleaner
fuels. In particular, as part of the 13th Five-Year Energy Development Plan issued in January
2017 by National Development and Reform Commission (NDRC) and National Energy
Administration (NEA), a mandatory target was introduced for the first time for coal, with the
aim of reducing its proportion to the energy mix to below 58% in 2020 (from about 62%
in 2016 and 60% in 2017, so China may very well overshoot the target if this trajectory
continues). Meanwhile, China plans on ramping up usage of natural gas to above 10% by
2020 and above 15% by 2030.
In terms of fossil fuel use, as state-owned enterprises (SOEs) dominate the production of fuels
in China, we can reasonably expect the high-level policy objectives to trickle down to the
company level, giving credence to the targets set.
Summary of China’s key energy mix targets from various papers released by the government
2020 2030 2050
Primary energy consumption (tonnes of coal 5bn 6bn
equivalent)
Non-fossil fuel proportion in energy mix >15% >20% >50%
Non-fossil fuel proportion in power >50%
generation activities
New Energy Demand Should mostly be met by
clean energy
Coal share of energy mix 10% >15%
Energy consumption per unit of GDP Down 15% compared to
2015
Carbon emission per unit of GDP Down 18% compared to
2015
Energy self-sufficiency rate >80%
Source: NDRCDBS Asian Insights
SECTOR BRIEFING 78
25
Natural gas demand has enjoyed strong growth in China
Natural gas consumption CAGR was a robust 16% from 2005 to 2015. Although demand for
natural gas slowed down with consumption growing by just 3% and 8% in 2015 and 2016
respectively since the oil price collapse during 2014, gas consumption growth rebounded
substantially in the double-digits after the Chinese government launched more supportive
policies to stimulate demand. In 2018, total gas consumption grew 18% to reach 282 billion
cubic metres (bcm). We expect the growth rate to sustain at low-teens in the coming few
years with total gas consumption reaching around 440bcm by 2022.
Natural gas consumption in China
Source: CEIC, DBS Bank
Estimated breakdown of natural gas consumption
Source: CEIC, DBS BankDBS Asian Insights
SECTOR BRIEFING 78
26
We reckon that the major growth driver was industrial sector in the past few years, thanks
to stable economic growth, ongoing urbanisation development and government’s push to
replace coal with gas. We estimate that gas consumption by the industrial and commercial
sectors to total gas consumption will climb from 47% in 2016 to 53% in 2022. While we
expect industrial sector to remain a major growth driver going forward, other sectors, such
as transportation, will also see higher gas penetration as government diversifies gas sources
with an increase in supply.
Demand for natural gas has accelerated since 2H2016 as the Chinese government started
to strictly enforce environmental regulations and issued favourable policies to stimulate
clean energy usage. The NDRC issued the 13th Five Year Plan (FYP) for natural gas, which
includes detailed targets for upstream, midstream and downstream segment of the value
chain. By the end of 2020, natural gas as a proportion of primary energy consumption is
targeted to increase from around 6% in 2015 to 10% in 2020. Moreover, the government
also targets to further increase the proportion to above 15% by 2030. We believe the
targets set are achievable given that the government is determined to boost clean energy
consumption in China.
The “Action Plan on Prevention and Control of Air Pollution” promulgated by the State
Council includes measures to reduce air pollution in China. One of the main targets is to
shut small coal-fired boilers (25% of the gas volume growth in China during 2015-2020 and is a key
task for the government to tackle in order to achieve its gas consumption target in FYP. The
central government will penalise local governments if they fail to meet the target. Thus,
in order to strengthen policy implementation, local governments have rolled out subsidiesDBS Asian Insights
SECTOR BRIEFING 78
27
for industrial/commercial players to conduct the conversion. As a result, most targets to
eliminate coal boilers below 10 steam t/h by 2017 were met. Looking forward, we believe
the pace of coal-fired boilers conversion will continue. In fact, many provinces have issued
additional policies to eliminate coal boilers between 10-35 steam t/h.
Selective coal-boiler conversion subsidies
Province City Subsidy
Gansu Lanzhou • Rmb100,000 per steam tonne for coal boilers above 0.7MW
• Rmb100 per sqm for coal boilers below 0.7MW used by public facilities
(甘肃) (兰州) (such as hospitals, schools, local government buildings)
Henan • Conversion completed before Oct 2018: >Rmb60,000 per steam tonne
• Conversion completed after Oct 2018 but before Oct 2019 : >Rmb40,000
(河南) per steam tonne
Hebei • Disposal only: Rmb30,000 per steam tonne
(河北) • Replacement with clean energy: Rmb80,000 per steam tonne
Jiangsu Suqian • Rmb0.76 per cubic metre of gas consumption for two years
(江苏) (宿迁)
Jilin Changchun • Rmb20,000 per steam tonne for coal-boilers above 20 steam tonnes / hour
(吉林) (长春)
Shandong • Rmb 35,000 / MW for coal-boilers below 100MW
(山东)
Source: NDRC, DBS Bank
More natural gas for Winter heating is believed to be one of the main contributors to air pollution in China. The
winter heating as well Beijing-Tianjin-Hebei region will be the focus as rural residents currently use scattered coal
as a primary heat generation fuel. Scattered coal has the characteristics of low efficiency
and high pollution. The emission intensity of scattered coal is 17.5 times more than coal
used for electricity generation. As a result, rural households accounted for >70% of total
residential coal consumption.
Household coal consumption in China
Source: CEICDBS Asian Insights
SECTOR BRIEFING 78
28
The Chinese Subsidy schemes have been introduced by local governments to subsidise gas usage and
government has issued installation costs. Given increasing environmental and health awareness, we believe the
multiple related policies subsidy schemes provide sufficient incentives to encourage natural gas usage, despite slightly
to tackle the use of higher costs for rural users. The subsidy scheme will last for three years to help users reduce
scattered coal for costs during the transition period. In addition, the formation of coal-free zones will help to
heating purposes prevent companies from selling and using coal, which should push up local coal prices, and
reduce the attractiveness of a possible switch back to coal. In 4Q2017, the government issued
the “Clean Winter Heating Plan for Northern China” (“北方地区冬季清洁取暖规划”). The
plan targets the clean energy heating rate to reach 70% by 2021, from c.17% in 2016. The
coal-to-gas conversion target for heating should boost gas demand by 23bcm from 2017-
2021 in the core “2+26” cities in Pan Hebei-Tianjin-Beijing area.
Selective rural incentives by local governments
Province City Subsidy
Beijing • 30% equipment cost subsidy - maximum of Rmb12,000 (villages 500 households)
Tianjin • Municipal Ministry of Finance provided total subsidies of Rmb320m
(天津)
Hebei Handan • Gas equipment: 70% cost subsidy with a maximum of Rmb 2,700
(邯郸) • Gas pipeline discounted installation fee of Rmb2,600
• Natural gas tariff (heating) subsidy: Rmb1 / m3 for maximum Rmb1,200
Hengshui • Installation subsidy: Rmb2,600
(衡水) • Natural gas tariff subsidy : Rmb1.5 / m3
Xingtai • Natural gas tariff subsidy: Rmb1 /m3 with a maximum of Rmb900
(邢台)
Shijiazhuang • Installation and equipment: Rmb3,900
(石家庄) • Natural gas tariff subsidy: Rmb1 / m3 with a maximum of Rmb900
Baoding & • Gas equipment: 70% cost subsidy with a maximum of Rmb 2,700
Langfang • Coal-forbidden zones will no longer adopt tier-pricing system
(保定&廊坊) • Natural gas tariff (heating) subsidy: Rmb1 / m3 for a maximum of 1,200 m3
• Gas pipeline connection subsidy Rmb4,000
Source: NDRC
Rural coal-to-gas conversion can greatly contribute to the increase in gas consumption as
coal consumption for rural households is higher than urban households due to the lack
of central heating systems. We estimate there are c.62m rural households in the Beijing-
Tianjin-Hebei areas, which could boost natural gas demand by 31.2bcm assuming 40%
convert to gas heating. We expect rural coal-to-gas conversion to account for >8% of
the increase in natural gas consumption during 2015-2020. Furthermore, we believe
the increasing formation and expansion of coal-free zones are part of the measures to
ensure that policies are successfully executed. The establishment of coal-free zones prevent
companies or residents from selling or using coal.DBS Asian Insights
SECTOR BRIEFING 78
29
Regulating operators for healthy development of gas sector
In Oct 2016, the NDRC issued a document on the trial implementation of natural gas pipeline
transmission pricing scheme. The return on asset for inter-provincial pipelines (long distance)
is set at 8% based on a minimum utilisation rate of 75%, which means that a utilisation rate
below 75% will have lower returns. The tariff mechanism is set for the pipeline company and
will be adjusted every three years. Local governments have started to limit the return on intra-
provincial (medium to short) pipeline transmission recently, by lowering the transmission fee.
In addition, the NDRC released regulatory guidance opinion on gas distribution prices in June
2016 to clarify its stance and removed industry concerns of a potential steep cut in distribution
margins. According to the guidance opinion, the return on attributable asset (ROA) for city
gas distribution business cannot exceed 7%. This will have a negative impact on projects with
high dollar margin and ROA >7%, though there are not many such projects with high returns.
The average ROA for major gas distributors in China ranges from 3-5%. Therefore, we do not
expect a significant impact on earnings growth for gas distributors.
Increasing focus on LNG as domestic gas supply hinges on shale
Increasing LNG imports Domestic production of natural gas has been up by ~7% each year in the past decade, compared
with just 4% in the US. However, the increase in gas supply is still not sufficient to satisfy the
robust demand which is growing at ~13% each year and the gap has been filled by imported
LNG and pipeline gas. In 2018, domestic production was responsible for only ~55% of total
supply while imported LNG and pipeline gas accounted for ~27% and 18% respectively.
We expect the imported LNG ratio will nudge up further in 2019 with rising demand for
natural gas in China. With Power of Siberia, a new natural gas pipeline from Russia to China,
coming onstream by the end of 2019, supply of piped gas will increase. Nevertheless, we
believe the percentage of imported LNG will account for c.30% of total supply in the next
few years, up from just 12% in 2011. As domestic production catches up over time, the
percentage of domestic supply to total supply should rise.
Declining percentage of domestic production with increasing reliance on imports to meet demand
Source: Wind, DBS BankDBS Asian Insights
SECTOR BRIEFING 78
30
China domestic gas The oil and gas upstream sector in China is highly concentrated, and the gas market is no
production is highly exception. The big three - Petrochina, Sinopec and CNOOC - account for ~80% of domestic
concentrated gas production in China. This is much higher than the US, as the top three largest producers
in aggregate are only responsible for ~10% domestic supply.
Shale contribution is China produced ~155.1 bcm of gas domestically in 2018, of which 56% was by Petrochina,
picking up; growing 18% by Sinopec and 6% by CNOOC. The bulk of the of domestic gas production came from
importance as source conventional natural gas sources, which represent ~84% of total gas production. Shale gas
of gas supply in China is a relatively new source of supply that only came about in 2012 and has since grown to
account for ~8% share of domestic gas production and should remain the key growth driver
ahead. The remaining 8% of gas was from coalbed methane and synthetic natural gas.
Breakdown of gas production – by producer (2018) Breakdown of gas production – by product (2018)
Source: CEIC, DBS Bank Source: National Bureau of Statistics, NDRC
Breakdown of gas production
Source: National Bureau of Statistics, DBS BankDBS Asian Insights
SECTOR BRIEFING 78
31
Ambitious targets for In the 13th Five Year Plan, China’s aim is to produce 30 bcm of shale gas a year by 2020,
shale gas production representing 59% CAGR from output of 11.8 bcm in 2018. This seems rather ambitious and
probably only around half of the target would be realised based on existing production plans
of key producers - CNPC (parent of Petrochina) and Sinopec - which play a leading role in
driving gas production growth in China. Looking beyond 2020, China has set a longer-term
goal of producing 80-100 bcm of shale gas in 2030, which implies 17-20% CAGR between
2018-2030.
CNPC has been aggressively expanding shale gas capacity, in line with the national policy of
exploiting shale reserves as a cleaner energy source to replace coal. It pumped 4.27 bcm of
shale gas (+40% yoy) in the southwestern province of Sichuan in 2018 and target to produce
12 bcm of shale gas annually by 2020, rising to 22 bcm of shale gas by 2025, and 42 bcm by
2030. Sinopec’s Fuling field in Chongqing in Southwest China is the largest single gas field
in China, producing ~6 bcm in 2018. It aims to lift its domestic shale gas production by two-
thirds to reach 10 bcm by 2020.
China has world’s China has the 10th largest natural gas reserves in the world (~5,440 bcm as of early 2018
largest shale gas based on EIA data) but the world’s largest for shale gas reserves (~1,000 bcm as of early
reserves, but extractions 2018 based on China Mineral Resource Report 2018), largely concentrated in Sichuan and
are geologically Chongqing. Currently, it is the third largest shale gas producer, after the US and Canada.
challenging
While shale is expected to be the main growth driver of domestic gas supply, it might be
challenging to repeat the shale gas boom in the US. Shale drilling in China faces hurdles as
shale formations are located in mountainous terrains, where infrastructure is non-existent,
well drilling costs are higher, regulatory support is limited and water supplies are scarce. Since
drilling began around 2010, many oil majors have quit due to poor prospects. The latest one
was BP who had reportedly exited two shale gas production sharing contracts with CNPC in
Sichuan province due to poor drilling results.
Hence, Chinese gas production plan will likely fall behind schedule and will continue to rely
heavily on gas imports to fill the gap in the near to medium term.
Lower gas price to stimulate demand
More measures to City gate price is currently regulated by the government but upward adjustment of 20%
lower gas price and negotiation between suppliers and users are allowed as government moves towards
marketisation of natural gas price. Deregulated sources of supply (offshore conventional gas,
unconventional gas and imported LNG) are not bound by this price regulation. After several
rounds of reduction in city gate prices, we reckon natural gas price is more competitive than
other alternative fuels, except coal. Nevertheless, we believe there is still room for natural gas
price to fall further.
For instance, the formation of a national pipeline company can increase connectivity betweenDBS Asian Insights
SECTOR BRIEFING 78
32
suppliers and buyers and lower transmission cost. Pipeline transmission fees is one of the
major cost components of gas distributors and is estimated to account for c.30% of the
selling price. Based on our calculations, a 15% reduction in intra-provincial tariffs will lead to
c. Rmb0.03-0.06 reduction in city-gate prices.
The formation of a national pipeline company will also allow a higher volume of transactions
to be traded on natural gas exchanges. Although natural gas transactions on the Shanghai
Petroleum and Natural Gas Exchange reached a record high at 60.46bcm last year, that
for LNG stood at just 4.5m cubic metres. With increase in supply in LNG and higher LNG
transaction volume being traded on the exchanges, we see there is potential for natural gas
prices to fall in the long term.
Alternative fuel vs natural gas price
Source: CEIC, DBS Bank
Recent policies on city gas price and transmission fee
Date Policy
April 2015 • Unification of city gate price of incremental and existing volume for non-residential users
• Reduction of city gate price for incremental volume by Rmb0.44/m3
• Increase of city gate price of existing volume by Rmb0.04/m3
Nov 2015 • Reduction of the maximum city gate price for non-residential users by Rmb0.70/m3
• Replacement of ceiling city gate price with benchmark price set i.e. negotiation between
suppliers and buyers allowed
• Allowed upward adjustment of 20% in benchmark price
Aug 2016 • Installation and equipment: Rmb3,900
• Natural gas tariff subsidy: Rmb1 / m3 with a maximum of Rmb900
• Request all provincial governments to lower intra-provincial transmission fee
Sept 2017 • Reduction of benchmark city gate price for non-residential users by Rmb0.10/m3
May 2018 • Reduction of benchmark city gate price for non-residential users by Rmb0.10/m3
June 2018 • Unification of city gate price for residential and non-residential users
April 2019 • Reduction of intra-province transmission fee
• Reduction of benchmark city gate price for non-residential users by Rmb0.20/m3
Source: NDRC
Source: NDRCDBS Asian Insights
SECTOR BRIEFING 78
33
Natural gas price in China
City gate price
Medium
Long distance
-short distance End
Upstream ex- pipeline Distribution
pipeline selling
plant price transmission margin
transmission price
tariff
tariff
Source: NDRC, DBS Bank
Gas power plants The LCOE for gas power plants in China consists of 62% fuel cost, 7% capex, 17% O&M
will also be more cost, 7% finance cost and 7% tax. Therefore, the LCOE is largely dependent on the upstream
competitive natural gas price. Since the natural gas price in China is relatively high compared to some
international peers in the US and Europe, its LCOE is also comparatively higher.
Prior to the oil price decline in 2014 and city gas price cut in 2015, the LCOE of gas power
projects was much less competitive compared to coal-fired plants. The city gate price was
revised down by Rmb0.7/m3 in 2015 and another Rmb0.1/m3 in 2017, which has helped to
drive down LCOE by c.Rmb0.1 / kwh to c.Rmb0.76/kwh. As the Chinese government seeks to
lower gas price by cutting midstream transmission fees and restrict distribution margins, gas
price is expected to remain at a low level, which is positive for the sector.
LCOE of gas power plants – Global
Source: BNEF, DBS BankYou can also read