Understanding current and forecast visitor flows to the South Island ber 2018
←
→
Page content transcription
If your browser does not render page correctly, please read the page content below
Understanding current and forecast visitor
flows to the South Island
2FWRber 2018

Anthony Byett, Consulting Economist, Taupo
Mieke Welvaert, Adolf Stroombergen and Benje Patterson, Infometrics
Consulting Ltd, Wellington

NZ Transport Agency research report 650
Contracted research organisation – Infometrics Consulting Limited
ISBN 978-1-98-856117-2 (electronic)
ISSN 1173-3764 (electronic)

NZ Transport Agency
Private Bag 6995, Wellington 6141, New Zealand
Telephone 64 4 894 5400; facsimile 64 4 894 6100
research@nzta.govt.nz
www.nzta.govt.nz

Byett, A, M Welvaert, A Stroombergen and B Patterson (2018) Understanding current and forecast visitor flows
to the South Island. NZ Transport Agency research report 650. 83pp.

Infometrics Consulting Limited was contracted by the NZ Transport Agency in 2018 to carry out this research.

                This publication is copyright © NZ Transport Agency. This copyright work is licensed under
                the Creative Commons Attribution 4.0 International licence. You are free to copy, distribute
and adapt this work, as long as you attribute the work to the NZ Transport Agency and abide by the other
licence terms. To view a copy of this licence, visit http://creativecommons.org/licenses/by/4.0/. While you
are free to copy, distribute and adapt this work, we would appreciate you notifying us that you have done so.
Notifications and enquiries about this work should be made to the Manager National Programmes, Investment
Team, NZ Transport Agency, at research@nzta.govt.nz.

Keywords: cost-benefit analysis, destination management, road infrastructure, South Island New Zealand,
tourism, tourism flows model, visitor attractions
An important note for the reader
The NZ Transport Agency is a Crown entity established under the Land Transport Management Act 2003. The
objective of the Agency is to undertake its functions in a way that contributes to an efficient, effective and
safe land transport system in the public interest. Each year, the NZ Transport Agency funds innovative and
relevant research that contributes to this objective.

The views expressed in this research report are the outcomes of the independent research, and should not be
regarded as being the opinion or responsibility of the NZ Transport Agency. The material contained in the
report should not be construed in any way as policy adopted by the NZ Transport Agency or indeed any
agency of the NZ Government. The report may, however, be used by NZ Government agencies as a reference
in the development of policy.

While research reports are believed to be correct at the time of their preparation, the NZ Transport Agency
and agents involved in their preparation and publication do not accept any liability for use of the research.
People using the research, whether directly or indirectly, should apply and rely on their own skill and
judgement. They should not rely on the contents of the research reports in isolation from other sources of
advice and information. If necessary, they should seek appropriate legal or other expert advice.
Acknowledgements
The authors would like to gratefully acknowledge the contribution to this research from the following:

•   Peer reviewer David Simmons, Lincoln University

•   Members of the Steering Group:

    –   Otago Regional Council: Jane Turnbull

    –   NZ Transport Agency: Steve Higgs

    –   Ministry of Business, Innovation and Employment: Michael Webster, Elisa Eckford

    –   Ministry of Transport: Ralph Samuelson

    –   Tourism Industry Association: Steve Riley

    –   Regional Tourism NZ: Charlie Ives

    –   Queenstown Lakes District Council: Polly Lambert

    –   Tourism West Coast: Jim Little
Contents
Executive summary ................................................................................................................................................ 7
Abstract ...................................................................................................................................................................... 8
1          Introduction .................................................................................................................................................. 9
2          Background areas of research ........................................................................................................... 11
           2.1         Initial comments .................................................................................................. 11
           2.2         Recent areas of work............................................................................................ 11
                       2.2.1          Tourism Industry Aotearoa (TIA) .............................................................. 11
                       2.2.2          Ministry of Business, Innovation and Employment (MBIE) .......................... 11
                       2.2.3          Ministry of Transport (MoT) ..................................................................... 12
                       2.2.4          Department of Conservation (DOC) .......................................................... 12
                       2.2.5          Other research ........................................................................................ 13
3          Current/past visitor data by location ............................................................................................. 14
           3.1         Initial comments .................................................................................................. 14
           3.2         Core national tourism measures ........................................................................... 16
                       3.2.1          International visitors arrivals (IVA)............................................................ 16
                       3.2.2          International Visitor Survey (IVS) .............................................................. 19
                       3.2.3          Domestic visitor surveys .......................................................................... 20
                       3.2.4          Tourism satellite accounts (TSA) .............................................................. 23
                       3.2.5          Monthly regional tourism estimates (MRTE) .............................................. 24
                       3.2.6          Accommodation survey (AS), previously the CAM ..................................... 25
           3.3         Using tourism indicators as measures of arrivals and as determinants of GDP ....... 27
                       3.3.1          International arrivals................................................................................ 27
                       3.3.2          Domestic arrivals ..................................................................................... 30
                       3.3.3          Total arrivals ........................................................................................... 34
                       3.3.4          Visitors to sub-regional locations ............................................................ 35
                       3.3.5          Tourism and TLA GDP and employment ................................................... 39
4          Current/past visitor data by journey .............................................................................................. 42
           4.1         Initial comments .................................................................................................. 42
           4.2         The 2007 tourism flows model............................................................................. 42
           4.3         International visitor journeys ................................................................................ 42
           4.4         Domestic visitor journeys ..................................................................................... 48
           4.5         Tourism and road usage statistics ........................................................................ 51
5          Forecasts ..................................................................................................................................................... 55
           5.1         Initial comments .................................................................................................. 55
           5.2         Tourism forecast models...................................................................................... 55
           5.3         Determinants of tourism ...................................................................................... 57
           5.4         Current forecasts ................................................................................................. 58
           5.5         Other potential forecast models ........................................................................... 62
           5.6         Discussion of current forecasts and future decisions ............................................ 64
           5.7         Constraints .......................................................................................................... 68
6          Outline of South Island tourism flows model .............................................................................. 70
7          Conclusions ............................................................................................................................................... 72

                                                                                                5
8         References .................................................................................................................................................. 75
Appendix A: Data sources ................................................................................................................................ 79
Appendix B: Graphical indicators of activity............................................................................................. 81
Appendix C: Glossary ......................................................................................................................................... 82

                                                                                           6
Executive summary
The South Island of New Zealand has been experiencing fast growth in tourism. This study sets out to
understand measures of visitor activity in the South Island and forecasts for these activities, with a key
focus being on the associated journeys. This forms part of the understanding required to undertake
destination management.
An examination of current visitor statistics shows there is a wide range of data but there is no one definitive
measure, especially at a regional level. In part this short-coming stems from challenges in defining the
visitors of interest and in part from disaggregating visitor activity from the activity of local people. One key
sector is international tourism. Methods were explored that adjusted available data to derive estimates of
international tourist arrivals to local authority areas. This work showed improved estimates of visitor
numbers are available from the International Visitor Survey, that there was some merit in deriving visitor
estimates from spending data at a local authority level but that too many assumptions were required to turn
commercial guest arrivals from the Accommodation Survey into visitor arrivals across all accommodation
options. Similar conclusions were reached when applying the same methods to measures of domestic
tourism. A key recommendation is to use multiple measures, including data derived from card spending,
phone use and app use where available, to make inferences about visitor presence.
The study also showed that multiple counts of visitors to key locations exist, giving further information
about visitor presence in an area. Collection and dissemination of this data is encouraged.
As to the journeys associated with visitor activity, again no one dataset exists to describe the quantum of
visitor use of South Island roads. Methods to derive visitor numbers were explored. In particular, it was
shown that breaking the visitor journeys into three segments could enable visitor flows to be inferred from
data currently available or easily obtainable, albeit at a cost. Data exists to provide a reasonable estimate of
international visitors to the South Island and their port of entry, likewise for domestic visitors from the North
Island. These are the major but not the only visitors to South Island locations. Estimation of visitor flows
between regions is possible by combining (a) the previously derived estimates of visitors to districts with (b)
the arrivals to the South Island and (c) partial measures about visitor flows that are available, including data
from visitor surveys, card spending and phone usage. The estimates of inter-regional flows will not be
accurate but are likely to be reasonable for infrastructure planning. An illustration of this method derived
figures such as 1.9 million international tourists arriving in the South Island in the March year 2016/17, with
1.3 million of them travelling east of the Southern Alps between Queenstown and the combined
Canterbury/Northern South Island regions. These figures relied on assumptions. Further data analysis is
required before such figures could be used for management decisions.
A fuller description of visitor flows also requires measures of route and mode use between regions and of
flows between accommodation and attractions within regions. Again these measures do not exist (at
present) but can be reasonably inferred within a flows model. A phased approach to building such a model
– or possibly interconnected models – was proposed as part of the research project. This would entail
customised analysis of administrative data. The approach could dovetail with existing regional models of
flows but would require building intra-regional models for other regions. The benefit of a combined
model of South Island visitor flows lies in being able to derive the current and forecast infrastructure use
data that is required for a fuller cost-benefit analysis of infrastructure investment. It also provides a tool
to explore scenarios around the various risks that exist.
Ultimately, forecast activity is the key to infrastructure management decisions today. Forecasts of visitor
flows of relevance to the South Island were collated. These ranged from forecasts several years ahead to
forecasts over two to three decades. There are also growing possibilities for forecasts of the months
7Understanding current and forecast visitor flows to the South Island
ahead based on bookings and web searches; these are not reported in detail here. Forecasts derived by
the three airports of major importance to South Island visits provide the core long-term forecasts available
at present. These were shown to be lower than international forecasts and historical trends, implying
some acknowledgement of constraints ahead. No set of long-term or short-term forecasts across all
South Island regions is available. Rather than pursue such a set of forecasts, which would have a large
margin of error, a recommendation is to first establish a mutual understanding of the constraints around
key locations. In other words, the currently available forecasts provide a reasonable estimate of potential
demand growth across the South Island but the local supply response will be, in the first case, constrained
by some physical limits, in particular around major natural attractions, and otherwise will be varied,
complex and uncertain. Long-term regional forecasts are unlikely to capture these dynamics. Rather a
system for coordination and adaption is required.
Another key gap in information exists around the benefit of visits. The above discussion has largely
revolved around the quantum of visitors. However the benefits to regions and to the country are variable.
A snapshot of five-year growth between 2011/12 and 2016/17 showed tourism having different effects
on local employment and gross domestic product. Further research is required – and is underway – to
understand the dynamics between regional growth and tourism. A further matter of benefit is the
satisfaction of visitors and of local residents. Sometimes the (lack of) supply of infrastructure can lead to
negative experiences for both parties (eg not enough passing lanes). In other cases, the supply of
infrastructure can lead to conflicting experiences (eg easier access increasing visitor numbers and testing
local intolerance). This is a matter where ongoing monitoring of both visitor and local sentiment is
required, although this still leaves future sentiment unknown. Current data exists and analysis of social
media offers opportunities to develop these measures further. But a major research area is how to match
measures of sentiment with costs, or in other words, what is the dis-benefit of negative sentiment that
needs to be weighed against infrastructure costs?
Abstract
Data is required for destination management, both of current visitor activity and future activity. This
report reviews the data that currently exists for visits to the South Island of New Zealand, where tourism
growth has been, and is still expected to be, strong. Not surprisingly no one dataset was found that could
reasonably describe visitor activity, nor were there forecasts for core visitor activities across each region of
the South Island. Methods were tested to show how currently available data, including an International
Visitor Survey and a measure of electronic card spending, could be adjusted to derive measures of visitor
presence. A three-part visitor flows model was presented that could be used to derive estimates of visitor
flows between and within regions. Rather than attempting to derive a regional visitor forecast, it was
recommended systems be refined to ascertain current constraints and monitor planning by public and
private sector stakeholders. A major area identified for ongoing research is the interaction between visitor
and local resident dissatisfaction and infrastructure requirements.
81 Introduction
1 Introduction
In broad terms, the issue at hand is the management of strong tourism demand growth in the South
Island.
Research suggests this requires a combination of ‘destination marketing’ and ‘destination management’ 1.
Marketing of tourism is about developing and promoting a ‘product’, but not necessarily having much
control over the whole visitor experience. Destination marketing has long been practised in New Zealand 2.
Today this occurs through Tourism NZ and the regional tourism organisations (RTOs) and through many
private sector companies, such as Air New Zealand 3, Tourism Holdings Limited and NZ Ski Limited.
The role of the NZ Transport Agency (‘the Transport Agency’) fits within destination management.
Destination management is undertaken by many parties, from both the public and private sectors. It is
about mitigating the short and long-term effects of visits while taking the competitive advantage provided
by the current attractiveness of the local region and ensuring sufficient infrastructure and services are
available to support tourism activity and, in some instances, increase the number of attractions. This
requires an understanding of tourists’ needs, including around their journeys, and ultimately also around
their experiences. The first involves a large element of forecasting – Who will these tourists be? Where will
they want to go? Where will they want to stay? What will they want to do? – while the second is largely
monitoring, which may then lead to adaptation of the plans of the many parties involved in the tourism
supply chain. Ultimately understanding the nature of tourists and their needs will enable greater tourist
satisfaction, which in turn creates the platform for a growing, profitable and sustainable tourism industry.
Implicit in this management process is the creation of a tourism system that fits the needs of the local
population.
This report focuses specifically on the data requirements to achieve this ideal. The practical goal is to:
• provide key current estimates of visitor numbers and visitor flows to and around the South Island
• review available forecasts
• identify gaps, inconsistencies and consistencies within current and forecast estimates.
The focus on the South Island arises from a request from the South Island Regional Transport Committee
chairs to the Transport Agency for research on South Island visitor flows, which is required to assist
facilitation of integrated tourism journey improvements.
Some constraint on data collection is required, such is the mass of data that exists. The data discussed in
this report was chosen with subsequent data use in mind, including by local government, such as:
• development of an effective model for forecasting international and domestic visitor numbers
• defining what the transport network needs to do/provide, including improvements required
• whether a more formal business case is required to manage an identified problem or opportunity that
contains a transport element
1 See Pike and Page (2014), UNWTO (2011) for wider discussions of tourism and more explicit definitions.
2 New Zealand was first to introduce a national tourism marketing body in 1902.
3 Although Air NZ is 52% owned by government.
9Understanding current and forecast visitor flows to the South Island
• constructing a tourism flows model for the South Island, at least to regional council level and maybe
even down to territorial authority level (since that is the level at which decisions are made)
• identifying who is responsible for coordinating, planning and implementing the South Island inter-
agency work that will be needed to achieve the desired outcomes common to the transport and
tourism
• investigating whether it would be useful to develop some new tourism products for the South Island.
The report is structured with a brief overview of related research in chapter 2, an overview of measures of
recent tourism activity that provides insights into the spatial dimension of tourism in chapters 3 and 4,
and an analysis of current forecasts and potential constraints on tourism growth in chapter 5. Broadly,
initial emphasis is on tourism data as a measure of people presence at a place and time, with discussions
then widening to consider measures over time and measures of benefit. It turned out that an important
gap in understanding was around tourist flows, so the usefulness of data for a flows model is pointed out
within each chapter and chapter 6 takes up more fully how this gap might be filled. Some concluding
observations are in chapter 7.
102 Background areas of research
2 Background areas of research
2.1 Initial comments
Tourism is a large and fast growing industry in New Zealand. Not surprisingly there are many reports and
research projects that pertain to tourism activity. Some recent work with relevance to this project is
introduced below. Findings from this work will also be knitted into discussions of visitor numbers and
visitor flows in the following chapters.
2.2 Recent areas of work
2.2.1 Tourism Industry Aotearoa (TIA)
Setting the scene is the TIA (2014) report Tourism 2025 which sets out an industry aim to increase New
Zealand tourism revenue from $32 billion in 2015/16 to $41 billion by 2025, with the intention of
‘growing value faster than volume’. Two strategies aimed towards increasing value are (a) the reduction of
seasonality and (b) the increase of regional dispersal. Planning and monitoring such strategies requires
data measured at periods of a month (or less) and possibly disaggregated below the unit of territorial local
authority area (TLA).
A recent initiative in support of the 2025 goal is the Tourism Insight Framework. Of relevance to this
project, a leadership panel has developed a plan to identify and prioritise tourism industry insight needs,
plus advocate for more funding for the government provision of a tourism dataset to meet the industry's
needs and aspirations in terms of coverage and quality.
Another stream of work – Activating Domestic Tourism – has produced a tool called domestic growth
insight tool (DGiT) that provides information on potential domestic visitors to a region. DGiT will be
discussed in detail in later chapters.
Also of relevance to potential constraints on growth, TIA commissioned a Deloitte New Zealand (2017)
assessment of the nation’s tourism infrastructure priorities. The report also includes appendices
describing many tourism data series. Many of these data series are summarised each year in a ‘mood of
the nation’ report.
2.2.2 Ministry of Business, Innovation and Employment (MBIE)
MBIE offers tourism policy advice to government and hence has a strong interest in tourism data. MBIE
gathers, analyses and presents data and insights on their website. Data for this project has been drawn
from this site.
A current initiative is the development of a 2018 Tourism Data Domain Plan. This inter-agency document
is intended to set out the questions being asked about tourism and identifying the information gaps. A
review of International Visitor Survey (IVS) sampling and inference methods is also underway.
Another dataset provided by MBIE is the annually updated forecasts of tourism growth. These will be
included in discussions of forecasts in chapter 5.
The MBIE regional growth studies developed through the government’s Regional Growth Programme,
including for the West Coast, discuss tourism opportunities. There is also work underway at present to
provide a regional investment framework, which is expected to include categorisation of regions according
to their tourism status.
11Understanding current and forecast visitor flows to the South Island
MBIE (2016) provides an update of infrastructure supply and demand, including transport (but excluding
public facilities such as restrooms and sewerage). Findings of relevance to this project are listed below.
• New Zealand scored poorly (49th out of 141 countries) in a World Economic Forum (2015) Travel and
Tourism Competitiveness Report for ‘ground and port infrastructure, which includes measures of road
and rail density and quality’ and a TIA (2015) survey pointed to the challenge and opportunity that
infrastructure in general presented to the local tourism industry.
• New Zealand airport and airline capacity is growing and is not expected to constrain international
tourism growth in the long term, albeit there may be short-term challenges.
• There has been an apparent slow response to growing demand for commercial accommodation (note,
supply has since increased significantly and continues to increase).
Another report that was part funded by MBIE, prepared for the New Zealand Trade and Enterprise ‘Project
Palace’ programme, is the Colliers/Fresh Info (2016) analysis of accommodation supply and demand. Both
infrastructure reports are considered in this report within chapter 5.
Not directly related to tourism, MBIE funded multi-party research into the resilience of infrastructure to
hazards. Termed the Economics of Resilient Infrastructure, part of the study was into the effects of the
2016 Kaikoura earthquake.
2.2.3 Ministry of Transport (MoT)
The MoT also leads a Domain Plan, this one being into transport data needs. Of use to this project, the
MoT (2017a) Stocktake of information and data sources provides a list of data and data sources.
Looking ahead, the MoT (2016) Transport outlook provides scenarios of future transport demand, which
are discussed in chapter 5.
Of complementary value to this project, the MoT has currently underway, due mid-2018, a project to
deliver statistically sound estimates of inter-regional surface travel based on users of a major phone
network. The project intends to differentiate overnight travellers and day-trippers, and may differentiate
between international and domestic travellers but will not deliver an estimate of total people flows
between regions (ie phone network users only). Statistics NZ has a longer-term project underway within its
Data Ventures team that is looking into the potential access to cellphone data.
2.2.4 Department of Conservation (DOC)
Much tourism is centred on locations managed by DOC, including the National Parks and Great Walks.
DOC (2017) has as two of its goals that ‘90% of New Zealanders’ lives are enriched through connection to
our nature and heritage and 50% of international holiday visitors are enriched by their connection with our
nature and heritage’.
DOC has management plans for each National Park, including Aoraki/Mount Cook, Westland and Fiordland
which are to be reviewed and updated in the next one to two years 4. To help shape the latter of these
plans, the Milford Opportunities project currently being undertaken for Southland District Council, MBIE,
the Transport Agency and DOC will examine how to manage the increasing number of tourists visiting
Milford Sound.
4 www.doc.govt.nz/about-us/our-policies-and-plans/statutory-plans/statutory-planning-status-report/
122 Background areas of research
Data of relevance to this project collected by DOC include people and vehicle counts at many locations and
an annual survey of New Zealanders, looking at many issues but including use of and satisfaction with
DOC parks and facilities. Results of the latest survey will be available later this year.
2.2.5 Other research
Environment Canterbury commissioned the 2016 report Harnessing the potential of data for Canterbury's
tourism and transport networks, which includes discussion (Byett 2016) of tourism data needs and data
sources.
Queenstown Lakes District Council (QLDC) commissioned a model of tourist flows within the district,
which builds on similar economic network plans undertaken in Southland and Tasman.
Another QLDC report of interest is the MartinJenkins (2018) investigation into the Queenstown effect on
other regions in the South Island.
The Transport Agency (2017) as part of the Visiting Drivers Project provided a Data Insights report which
included analysis of rental car and campervan bookings.
Background information on the type of persons visiting places is provided by regular Roy Morgan 5 and
Angus & Associates 6 surveys.
5 www.roymorganonlinestore.com/Browse/New-Zealand/Travel-and-Tourism.aspx?page=1
6 Example for Rotorua available at www.rotoruanz.com/RNZ/media/Media-
Library/Business/Do%20Business/Research%20and%20Statistics/VIP.pdf
13Understanding current and forecast visitor flows to the South Island
3 Current/past visitor data by location
3.1 Initial comments
The typical start of any measurement of tourism is the number of people visiting a location, with the
location treated as the attraction or destination in tourism marketing and transport modelling. Such
measurements will be introduced in this chapter. In economic terms, the number of visitors to any
location is the result of interaction between the demand to visit and the capacity at the location for
visitors. Factors that may potentially constrain capacity are discussed in chapter 5.
This chapter focuses on historical visitor numbers and demand influences. The core measures of tourism
activity are:
• international visitors arrivals (IVA)
• the International Visitor Survey (IVS)
• the Domestic Travel Survey (DTS) and its proxies
• the tourism satellite accounts (TSA) and their spin-off monthly regional tourism estimates (MRTE)
• the Accommodation Survey (AS), previously the commercial accommodation monitor (CAM).
Several methods are then tested to provide estimates of international and domestic visitor arrivals, using
Queenstown as an example. The core methods of measuring tourism activity are also explored as a means
(a) to confirm, or not, tourism patterns evident amongst core and non-core measures and (b) isolate any
intricacies of each measure. Where possible, but not always, data is presented for the year ending March
2016/17 and five-year changes since 2011/12, because 2016/17 is the latest March year with TSA and
tourism gross domestic product (GDP) data available, and to enable comparison across the different data
sets.
Note, one international arrival at a specific location or small area (eg a TLA) will usually represent one
unique person arriving only once, although this becomes less likely for larger areas of consideration (eg
one person may have more than one visit to the Canterbury region). However, many measures of domestic
arrivals over a year will include a large proportion of repeat arrivals by the same person.
The following three-level framework provided a useful perspective when considering data, especially in
terms of what information could be gleaned from any measurement. Different data sets are better suited
to measurement of issues at the three levels, as is discussed in this chapter.
1 Data is available that can lead to greater understanding of the major entry and exit points to the South
Island and the journeys between major South Island attractions. For example, entry via Christchurch
Airport, visitors to West Coast and Southland, trips between Christchurch, West Coast and
Queenstown, exits via Queenstown Airport. These are likely to revolve around several locations and
several inter-regional transfers. When transfer is by road, travel is likely to be predominantly on
‘national’ roads, to use the One Network Road Classification (ONRC) nomenclature, but could also be
by train or plane.
143 Current/past visitor data by location
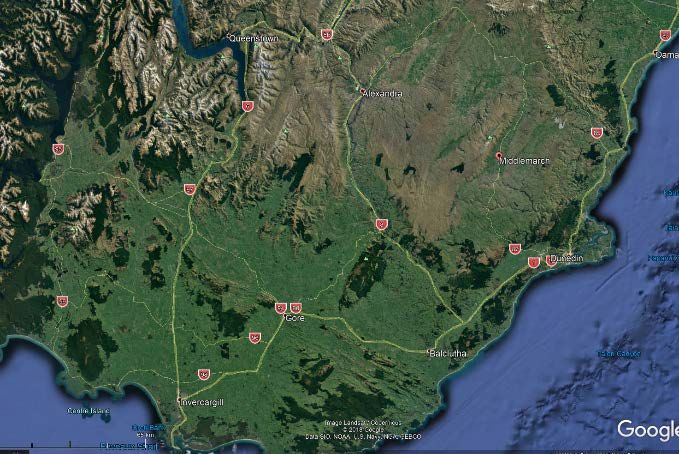
Figure 3.1 High level inter-regional flows
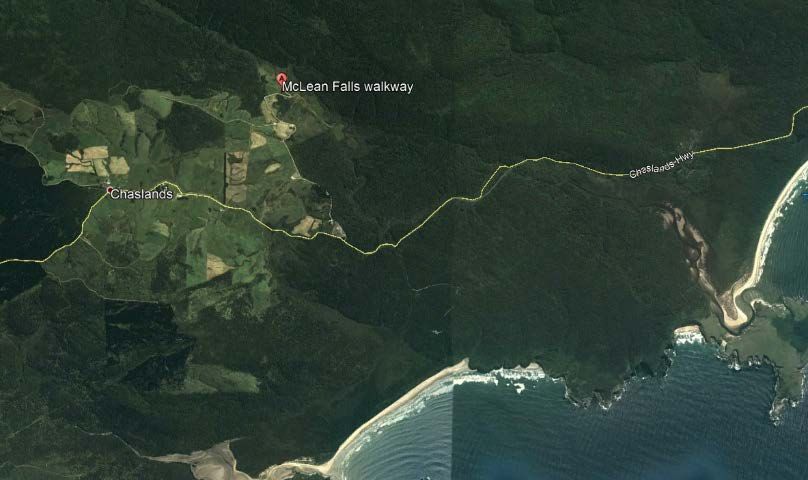
2 At the other extreme, there are visits to many smaller locations (eg McLean Falls in the Catlins Forest
Park, Oparara Arches in the Kahurangi National Park). These destinations may often be distant from
major routes and will most likely require use of ‘access’ roads. Or, in the case of Stewart Island, will
entail use of roads to access plane or boat terminals.
Figure 3.2 An example of an intra-regional flow: accessing McLean Falls off the Southern Scenic Route
(Source: Google Earth)
3 Between these two extremes, there are the many permutations of actual routes between regions and
routes to the many attractions, involving use of all classes of roads. For example, various routes are
taken between Queenstown and Dunedin, including via SH8, or via Middlemarch with a train journey
into Dunedin, or via SH6 and/or Te Anau/Milford and/or Invercargill, with or without the Catlins.
15Understanding current and forecast visitor flows to the South Island
Figure 3.3 Example of combining inter- and intra-regional flows: routes (not all shown) between Queenstown
and Dunedin (Source: Google Earth)
3.2 Core national tourism measures
From a demand perspective, the number of people who can potentially visit a location is capped, first, by
the number of people present in the country at any one time and, second, by the number of those people
who are part of the visitor pool. The first cap is known approximately. The second cap is not so clear cut,
which goes to the issue of what defines a ‘tourist’? We consider first international, then domestic tourism.
3.2.1 International visitors arrivals (IVA)
For international visitors, a count is provided via the IVA card, which is filled in by all entrants to the
country 7. In the March 2016/17 year, there were 3,543,631 international arrivals (the total excluding
under 15 year olds is 3,241,456). These people are considered international visitors because they live
abroad and intend to stay in New Zealand for fewer than 12 months. Some details from the IVA are
relevant for subsequent discussions around measures of tourism and are shown in table 3.1.
Table 3.1 Selected IVA measures for years ending March 2012 and 2017
Key characteristic YE March YE March Change % of total % of total
2012 2017 2012–2017 change 2017
Total visitor arrivals 2,617,930 3,543,631 925,701 100.0% 100.0%
Travel purpose
Holiday 1,221,440 1,841,728 620,288 67.0% 52.0%
Visiting friends and relatives 8 851,372 1,023,088 171,716 18.5% 28.9%
Business 249,312 295,184 45,872 5.0% 8.3%
Education 52,360 65,904 13,544 1.5% 1.9%
Conferences and conventions 50,744 68,976 18,232 2.0% 1.9%
Other and unknown
Length of stay (days)
Median 9.1 8.9
7 A similar count is taken of all departees.
8 See Tourism West Coast (2017, p169) fact book for breakdown by residence.
163 Current/past visitor data by location
Key characteristic YE March YE March Change % of total % of total
2012 2017 2012–2017 change 2017
Intended visitor nights (from IVA, 51,814,500 66,716,870 14,902,370
December 2011 and 2016 years)
Cf commercial international guest 12,631,596 16,598,352 3,966,756
nights (from AS/CAM)
Citizenship
Australia 761,736 927,888 166,152 17.9% 26.2%
New Zealand 471,308 525,584 54,276 5.9% 14.8%
China, People's Republic of 161,740 408,752 247,012 26.7% 11.5%
United States of America 179,804 306,976 127,172 13.7% 8.7%
United Kingdom 233,336 231,808 -1,528 -0.2% 6.5%
Other 810,006 1,142,623 332,617 35.9% 32.2%
Some points are noteworthy.
1 Even with the IVA full count of arrivals, it is not possible to provide an exact number of international
people who will undertake tourism activity each year, in part due to the difficulty differentiating
‘international’ from ‘domestic’. A significant proportion of international visitors are New Zealand citizens
who now live abroad (525,584 in 2016/17), predominantly in Australia. They are here for various
reasons and may or may not spend money in New Zealand on tourism activities. The convention is to
record people living abroad as ‘international’ and those living in New Zealand as ‘domestic’ but this may
not always be accurately recorded in non-IVA figures. This differentiation is further undermined when it
is realised that as well as the 3,018,047 non-New Zealand citizens visiting for fewer than 12 months,
98,768 non-New Zealand citizens arrived in 2016/17 with intended stays beyond 12 months, with a
similar arrival figure in earlier years. Depending on how their segmentation was recognised by non-IVA
data gatherers, they may be coded international or domestic.
2 The total number of ‘tourists’ can vary depending on whether all visitor purposes are included. The IVA
shows relatively small proportions of visitors, but significant numbers here for business (8.9%),
education (1.9%) and conferences/conventions (1.9%). These figures are of interest for three reasons: (a)
to put the size of these sectors into perspective; and (b) to warn that local tourism measurements
sometimes include and sometimes exclude education visitors, and that business visitors, while included
within New Zealand tourism figures, are not always included within tourism in other countries. Note also,
there are often multiple purposes for a visit (although only one reason is requested on the arrival card).
3 International visitors come from a wide range of countries. It may be useful to aggregate visitors by
groupings of country of residence but any grouping will need to be relevant to the decision being
undertaken, eg visitors could be grouped by English-speaking countries or countries with left-hand
drive vehicles. In this report, some international visitor data has been grouped as China, Australia and
Other, simply to illustrate points about these two largest international visitor origins. However, it is
important to note that the Other grouping is large (49% of 2016/17 IVA and 48% of IVA growth between
2011/12 and 2016/17) and diverse (24 countries having 0.5% or more origin share). In other words,
tourism activity and tourism growth is by no means dominated by visitors from Australia and China.
4 Measures of accommodation to be subsequently discussed will be significantly below the number of
nights spent by international visitors in New Zealand. A large proportion of international visitors
(1,023,088 in 2016/17), including non-resident New Zealand citizens, come here to ‘visit friends
17Understanding current and forecast visitor flows to the South Island
and/or relations’ (VFR). Again this may or may not involve extensive tourism activities. Of particular
relevance, these visitors are likely to stay in unpaid accommodation on many occasions. To be
complete, visitors here for ‘holiday’ and other purposes are also able to stay at unpaid
accommodation, including freedom camping, but their ability to access unpaid accommodation is
likely to be much less than the VFR visitors. The proportion of combined unpaid visitor nights is
unknown but an order of magnitude estimate is given by the proportion of VFR arrivals (29%). Note
even allowing for such a large proportion of unpaid accommodation still leaves a large unexplained
gap between the 66.7 million intended visitor nights in 2016/17 year (as tabled above) and the 15.6
million guest nights recorded in the 2016/17 AS. Note this issue of large numbers of international
visitors staying at non-AS properties pre-dates the emergence of Airbnb and similar platforms in
recent years. An associated complication is that intended stay is not always the same as actual stay.
Some visitors may arrive with a 30-day stay in mind and then extend their visit, including when they
gain a working visa while in New Zealand.
Expanding further on the large gap between commercial guest nights recorded and intended visitor nights
stated, a key influence is likely to be the relatively small proportion of visitors who stay well beyond 90
days 9. In 2016, 7% of visitors stayed beyond 90 days and made up 53% of intended visitor nights. Visitors
amongst these longer stays would have included fruit pickers from Vanuatu, WWOOFers 10 from Germany,
UK retirees spending an extended summer in New Zealand and non-resident New Zealand citizens who
are home for an extended stay. Many of these visitors will still visit multiple locations but are likely to
spend extended periods at one or several locations. Also the average spend-per-day of these longer-term
visitors is well below the average of short-term visitors, a factor that will be shown later to complicate
inferring visitor arrivals from spending data.
One implication of these national measurement issues, even at the arrival level which is fully counted, is
that some care is required when making inferences from any tourism figures. Steps that will reduce
erroneous inferences include being clear about the data required to address the question of interest and
seeking validation of data from alternative sources where practical.
The common figure, and the figure used within the TSA, for ‘international tourists’ in 2016/17 is 3,543,631
which rounds to 3.5 million. If short-term education were excluded 11, as is the case with MRTE figures, the
total international visitors in 2016/17 would be 3,477,727 which is still 3.5 million when rounded.
Usefulness for building a flows model:
• The IVA provides a total number of international tourists, their nationality and their purpose of visit
which can be used to derive and/or check sub-national arrivals estimates.
• The IVA provides port of arrival as first origin in a flows model (and when combined with departures
cards can provide the port of departure).
• The IVA provides total number of (intended) visitor nights to check against other accommodation
figures.
9 The general visitor visa allows nine months stay while student visas and working visas allow a longer stay.
10 WWOOFers stands for either Worldwide opportunities on organic farms or Willing workers on organic farms.
11 Another example of definition difficulties as short-term stay students are sometimes considered within tourism
figures and sometimes not, while long-term stay students are excluded from tourism. This distinction need not reflect
their travel patterns.
183 Current/past visitor data by location
3.2.2 International Visitor Survey (IVS)
The IVS provides further information on international visitors but this is a survey, not a count. A sample of
international visitors are questioned when departing New Zealand from Auckland, Wellington, Christchurch
and Queenstown international airports. The survey is conducted and processed by Kantar TNS New Zealand
Limited on behalf of Statistics NZ and MBIE. Processing comprises cleaning data, imputing missing data,
treating outliers and weighting statistics to reflect the distribution of the visitor population.
The sample size is large (approximately 8,900 pa), albeit this is only around 0.3% of international visitors.
This includes around 3,000 Australian residents and 550 Chinese residents. Invariably inferences made
from the survey will entail sampling error. For the year ending December 2017, the 95% confidence
interval was ±6.7% for total international visitor spending and ±22.7% for total spending by Chinese
residents. There is also the possibility of survey bias. While efforts are make to survey a cross section of
visitors, the response rates have been relatively low (although not unusual), ranging in 2017 from 18% for
visitors from China to 34% for visitors from Japan 12.
The survey was designed around expenditure estimates but also includes ancillary questions about places
visited, accommodation used and mode of transport. National and regional estimates of these variables
will have unknown margins of error of similar or higher magnitude to those of the expenditure variables
mentioned above.
It should be noted Statistics NZ is currently reviewing the IVS 13. An early draft of recommendations has led to
improved sampling techniques from 1 April 2018. A final report is due later in 2018. The April refinements
to the sampling process will lead to reduced margins of error in future. The extent of this reduction is not
yet known but is still likely to leave any estimates of regional visitor numbers being imprecise.
A further word of caution, the IVS was also refined in July 2013 14. Figures prior to this date would be at
risk of higher sampling and non-sampling errors and hence comparisons between recent and pre-2013
figures may be very imprecise.
In spite of the IVS shortcomings, it does produce estimates of transport use which are very helpful for
making inferences about journeys, as is required in a flows model. However, some care is required when
interpreting the data generally reported (as well as keeping in mind the margin of error). For example,
Statistics NZ reports the quarterly number of visitors to TLAs, eg 1,137,158 to the Queenstown Lakes
District in March year 2016/17. The steps involved in deriving this figure were as follows:
1 Respondents were asked to recall the places they stayed overnight during each day of their visit.
2 The number of people listing Queenstown, Wanaka, Arrowtown, Glendhu Bay and other nearby
locations were identified, after some (unspecified) initial filtering and cleaning of the data.
3 The total population of adult overnight visitors was estimated by upscaling each respondent staying at
least one night in Queenstown Lakes in proportion to the respondent’s representation in the arrival
population (eg one Chinese respondent of a certain age and purpose of visit identified as staying in
Queenstown Lakes is inferred to mean 204 similar people did likewise, ie this response contributed
205 to the 1.1 million total given above).
12A Statistics NZ (2017) evaluation of the IVS referred to declining response rates and suspicions of over-estimated
spending in 2014/15 and 2015/16
13 www.mbie.govt.nz/info-services/sectors-industries/tourism/tourism-research-data/ivs/ivs-2018-review
14 Including removing the itinerary questions and relying more on respondents to identify places visited
19Understanding current and forecast visitor flows to the South Island
4 Excluded from this count are those people: (a) who did not recall staying in Queenstown Lakes or
identified their stay in the district incorrectly, likely to be more of a problem with other districts; (b)
who visited but did not stay in Queenstown Lakes; and (c) who were children.
To give some perspective to the estimation difficulties and to provide a figure to be used later in this
report, the following steps were taken to derive the number of international visitors to the South Island.
• Using the ‘places visited’ question, respondents visiting the South Island were identified and weighted
to give an estimated number of adults visiting the South Island in March year 2016/17 as 1,565,361.
• This total is 49% of the total IVS adult population of 3,179,420 (which differs slightly from the IVA
arrivals count of adults for some unknown reason).
• However, amongst the other 51% of adults there were respondents who had not been coded as visiting
the South Island and yet some answers show they did. The IVS includes several questions that explicitly
refer to visits to the South Island, including port of arrival, port of departure, visits to national parks,
visits to art galleries and museums, and travel on the ferry between the North and South Islands. Taking
account of this data increases the proportion of adults visiting the South Island.
• The IVS also includes respondents who are coded as neither visiting the North or South Island, which is
clearly incorrect. Excluding these respondents from the calculation raises the proportion of adult visitors
to the South Island to 53% of adult visitors who were identified as visiting the North or South Island.
• Applying this ratio to the IVA arrivals, to provide consistency in figures and to include children, raises
the estimated number of international visitors to the South Island in March 2016/17 to a rounded
total of 1.9 million, which has been used for calculations in this report.
Other visitor patterns can be identified in a similar manner. Some of these statistics are used in later
sections of this report to infer journeys. Other questions of interest in the IVS, not reported here, include
scales of satisfaction, including a ‘sense of safety’ that is explicitly linked to road safety.
Table 3.2 Mode of transport for international adult visitors to New Zealand Mar 2016/17 (unadjusted IVS ratios)
General mode Ratio Of which … Ratio
Bus or coach 44% Tour bus 23%
Boat 35% Cook Strait ferry 11%
Car or van 75% Campervan 6%
Taxi or shuttle 43%
Air 29% Plane 24%
Train 10%
Usefulness for building a flows model:
• The IVS provides an estimate of international visitor spending, travel patterns and destinations that
can be used as inputs to a flows model, albeit estimates are imprecise.
• The IVS also provides national and sub-national estimates to validate independent measures.
• The IVS is a core component of the TSA.
3.2.3 Domestic visitor surveys
Internationally, a domestic tourist is defined as a person visiting outside their usual environment, further
refined to be someone travelling more than 40 km from their residence (one way) and outside the area
203 Current/past visitor data by location
they commute for work or visit daily. Note, in non-survey studies, the 40 km limit and commute area can
be determined by electronic card spending patterns or phone usage.
The issues raised earlier about measuring the number of international visitors are again relevant.
Additionally there are further complications as (a) there is no equivalent census of domestic tourism that
parallels the IVA and (b) the official estimate of domestic visitors that was derived from the annual
Domestic Travel Survey (DTS) is no longer available.
The DTS was an annual survey of approximately 15,000 people per year, seeking number of trips, number
of nights away, accommodation used and activities undertaken. Trips were broken down as overnight trips
and day trips. The survey ceased in 2012.
Using the DTS for the year to March 2012, TIA reports New Zealanders took 34.1 million day trips and
18.6 million overnight trips. Over the period from 2003 to 2012 the number of overnight trips taken by
New Zealanders increased by around 1% pa and the number of day trips decreased slightly. Some 57% of
domestic visitors stayed in private accommodation 15. Travel was predominantly by car 16 and business
trips were included amongst the figures.
As an aside to data measurement, TIA also points to domestic tourism complementing international
tourism by providing a source of visitors during seasonal and cyclical downturns.
While Statistics NZ no longer estimates the number of domestic tourists, it does estimate domestic
tourism expenditure in the tourism satellite accounts (discussed in section 3.2.4).
Other parties now provide estimates of domestic tourist numbers. Qrious has used cellphone and GPS use
across the Spark network to estimate the number of domestic and international tourist visits, including
overnight and day trippers. The national estimates were not available for this project 17 but are expected to
be available soon through the MoT ground travel data project.
Another measure derives from a one-off survey undertaken by Colmar Brunton for the TIA DGiT
programme of leisure travel. This survey comprised 6,000 responses from a structured sample of the New
Zealand population aged 18+ in September 2016. From this survey, the estimated number of day trips
taken primarily for leisure reasons was 27.6 million and overnight trips for leisure reasons was 17.4
million. The day trip total is lower than the 2012 DTS total but has considered a narrower reason for
travel. The number of overnight trips is discussed once other surveys are mentioned.
A larger survey is a Fresh Info and Automobile Association (AA) survey of over 3,000 AA members each
month. Information gathered includes the respondent’s location on each night of the trip, plus their
region of usual residence. Day trips are not considered within this survey. Results from the survey sample
are weighted up to reflect the national 15+ population using demographic information from Statistics NZ.
According to Fresh Info, there were an estimated 28.2 million domestic overnight trips in 2016 entailing
80.0 million adult visitor nights. Excluding overnight business trips the annual total was 24.8 million. Both
figures are above the aforementioned estimates from Colmar Brunton and Statistics NZ. The Fresh Info
figures equate to an average 7.5 trips per population aged 15 and over and to an average 2.8 nights per
trip.
15 www.tourism2025.org.nz/tourism-2025-archive/domestic-tourism-the-backbone-of-the-industry/
16 www.transport.govt.nz/resources/household-travel-survey/
17 Some Qrious regional reports were made available to the project
21Understanding current and forecast visitor flows to the South Island
Table 3.3 Estimated domestic tourism statistics for calendar year 2016 (source: Fresh Info)
Measure 2016 total Per adult
Overnight trips 28,228,000 7.5
Visitor nights 80,006,000
Nights per trip 2.8
Clearly there are differences between the Colmar Brunton and Fresh Info 18 results. To gain further perspective
on whether one or other figure is closer to the (unknown) actual number of visits, a comparison can be made
with Australia, where the equivalent to the DTS still exists. The Australian National Visitor Survey (NVS) annually
surveys via phone approximately 120,000 Australian residents aged 15 years and over. Table 3.4 shows the
estimated totals for the year ending December 2017, including business trips. Of interest to this project, the
average number of day trips was 10.1 per adult and annual overnight trips was 5.1 per adult. Applying these
averages in New Zealand would give March year 2011/12 day and overnight trip totals of 35 million and 18
million, similar to the figures derived from the New Zealand DTS. Applying the Australian averages to New
Zealand for March year 2017/18 equates to 28 million day trips and 19 million domestic overnight respectively.
As an aside, the Australian figures also show a 24:76 split of expenditure between day and overnight trip
expenditure, a figure not recorded in the New Zealand TSA and MRTE domestic figures.
Table 3.4 Australian domestic tourism statistics for year ending December 2017
Measure 2017 total Per trip or night Per adult % of total
Overnight trips 97,203,000 A$664 5.1
Visitor nights 350,911,000 A$184
Nights per trip 3.6
Overnight trip expenditure A$64,517,000,000 76%
Day trips 191,920,000 A$107 10.1
Day trip expenditure A$20,444,000,000 24%
Total domestic expenditure A$84,961,000,000
Source: www.tra.gov.au/tra/nvs/nvs_dec_2017.html
Taken together, the figures from DTS (2012), DGiT (2016), Fresh Info (2016) and NVS (2017) reinforce the
difficulty that exists around measuring the extent of domestic tourist trips.
The Australian figures provide some economic perspective to day trips, their influence being only around
one quarter of domestic tourism spending. The more economically significant activity is overnight visits.
For the purposes of this report, an estimate of 24 million has been used in estimations that require a
number of overnight domestic trips for March year 2016/17 (and also for 2016). This is an average of the
totals estimated by Colmar Brunton (upscaled to include business trips) and Fresh Info, used because,
even though the Fresh Info numbers are higher than estimated elsewhere, their process appears to be
statistically sound, there is a large margin of error around any estimate and generally averaging produces
reasonable estimates.
18One potential bias is that AA members may travel more than non-AA members, which is more likely to affect the
quantum of visits estimate rather than the regional distribution of visits.
22You can also read