The Natural Gas Gamble - A Risky Bet on America's Clean Energy Future
←
→
Page content transcription
If your browser does not render page correctly, please read the page content below

The Natural Gas
Gamble
A Risky Bet on America’s
Clean Energy Future

The Natural Gas
Gamble
A Risky Bet on America’s
Clean Energy Future

Jeff Deyette
Steven Clemmer
Rachel Cleetus
Sandra Sattler
Alison Bailie
Megan Rising

March 2015

©2015 Union of Concerned Scientists
     All rights reserved

     Jeff Deyette is a senior energy analyst and assistant director of
     energy research and analysis with the UCS Climate & Energy
     Program. He conducts analysis on the economic and
     environmental costs and benefits of renewable energy and energy
     efficiency policies.

     Steven Clemmer is the research director of the program. He
     directs the organization’s research on coal, natural gas, and
     nuclear power and on solutions to reduce carbon emissions and
     water use in the electricity sector.

     Rachel Cleetus is the lead economist and climate policy manager
     with the program. She works on global warming and clean energy
     policies and analyzes the costs of climate impacts.

     Alison Bailie is an energy modeler with the program.

     Sandra Sattler is an energy modeler with the program.

     Megan Rising is the energy campaign manager with the program.
     She specializes in mobilizing UCS supporters, activists, and
     experts in the work of the program.

     The Union of Concerned Scientists puts rigorous, independent
     science to work to solve our planet’s most pressing problems.
     Joining with citizens across the country, we combine technical
     analysis and effective advocacy to create innovative, practical
     solutions for a healthy, safe, and sustainable future.

     More information about UCS and the Climate and Energy
     Program is available on the UCS website: www.ucsusa.org.

     This report and an accompanying technical appendix are avail-
     able online (in PDF format) at www.ucsusa.org/nautralgasgamble.

     Designed by: Tyler Kemp-Benedict

     Cover photo: © iStockphoto/Ron Thomas
     Printed on recycled paper

ii     union of concerned scientists
[ contents ]

iv   Figures, Tables, and Boxes
vi   Acknowledgments

 1   Executive Summary

 5   Introduction

		 chapter 1
 9   Rewards and Risks of Natural Gas

		 chapter 2
19   Analysis Description and Methodology

		 chapter 3
22   Findings and Discussion

		 chapter 4
33   Working toward an Appropriate, Balanced Role for Natural Gas

		 chapter 5
35   Recommendations and Conclusions

39   References

                                                        The Natural Gas Gamble   iii
[ figures, tables, and boxes ]

                                     		Figures
                                      3   Figure ES-1. U.S. Electricity Generation, Business as Usual, and Carbon
                                          Standard plus Renewables and Efficiency Policies Scenarios
                                      4   Figure ES-2. Benefits and Costs of Policies That Limit Carbon Emissions,
                                          relative to Business as Usual Scenario
                                      6   Figure 1. U.S. Natural Gas Production by Source, 2000 to 2014
                                     10   Figure 2. Change in U.S. Electricity Generation Mix, 2007 to 2013
                                     13   Figure 3. Natural Gas Spot Prices, 2002 through 2014
                                     17   Figure 4. Illustration of Typical Steps of Unconventional Oil and Gas
                                          Development
                                     21   Figure 5. Comparison of Natural Gas Price Forecasts (Average Delivered Price
                                          to Power Sector)
                                     23   Figure 6. U.S. Electricity Generation, Business as Usual Scenario
                                     24   Figure 7. U.S. Power Plant CO2 Emissions
                                     25   Figure 8. U.S. Electricity Generation, Carbon Standard, and Carbon Standard
                                          plus Renewables and Efficiency Policies Scenarios
                                     26   Figure 9. Benefits and Costs of Policies That Limit Carbon Emissions, relative
                                          to Business as Usual Scenario
                                     27   Figure 10. U.S. Consumer Electricity Bills in Different Policy Scenarios
                                     28   Figure 11. U.S. Generation Mix Comparison in High and Low Natural Gas Price
                                          Sensitivities for the Business as Usual and Carbon Standard plus Renewables
                                          and Efficiency Policies Scenarios, 2040
                                     30   Figure 12. Deeper Carbon Reductions Are Needed to Meet U.S. Climate Goals

iv   union of concerned scientists
Tables
11   Table 1. Change in Natural Gas as a Percent of In-State Generation Mix 2007
     through 2013, Ranking of States
20   Table 2. Descriptions of Policy Scenarios
27   Table 3. Summary of Savings for the Carbon Standard plus Renewables and
     Efficiency Policies Scenario relative to the Business as Usual Scenario (in
     Billions 2013$)
29   Table 4. 2040 Electricity Bills (in Billions 2013$)
29   Table 5. Cumulative Carbon Emissions (in Million Metric Tons CO2,
     Cumulative 2010 to 2040)

		Boxes
31   What Do Our Results Mean for the EPA’s Clean Power Plan?

                                                               The Natural Gas Gamble   v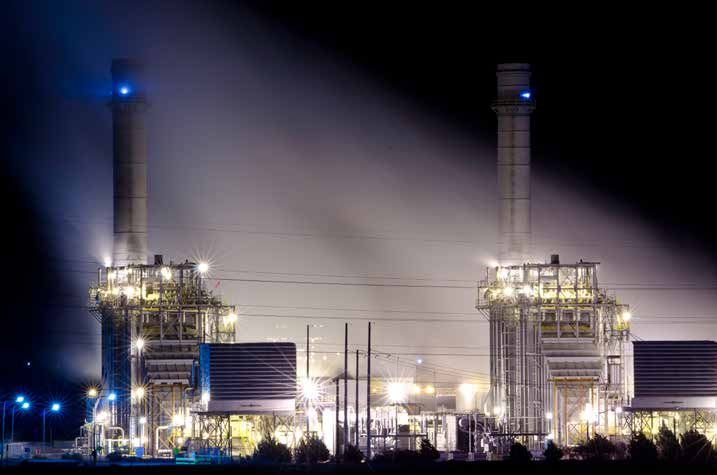
[ acknowledgments ]

                                     This report was made possible by generous support from Energy Foundation, The
                                     William and Flora Hewlett Foundation, Wallace Genetic Foundation, Inc., and UCS
                                     members.
                                          The authors would like to express our gratitude to our external reviewers for
                                     their thoughtful and rigorous reviews of the entire report: Mark Bolinger, Kristin
                                     Meek, Michael Obeiter, N. Jonathan Peress, and Starla Yeh.
                                          In addition to these external reviewers, the authors would like to thank the
                                     UCS staff members who made important contributions to this report, including
                                     Angela Anderson, Nancy Cole, Rob Cowin, Steve Frenkel, Mike Jacobs, Lisa
                                     Nurnberger, Seth Shulman, and Ashley Siefert. Former UCS staff members Seth
                                     Mullendore and Rachel Kriegsman also provided valuable research support for
                                     this report.
                                          We thank Leslie Brunetta for making the report more readable and Cynthia
                                     DeRocco for overseeing its production.
                                          The opinions expressed herein do not necessarily reflect those of the orga-
                                     nizations that funded the work or the individuals who reviewed it. The Union of
                                     Concerned Scientists bears sole responsibility for the report’s content.

vi   union of concerned scientists

[ executive summary ]

The U.S. electricity sector is in the midst of a major
change, as power producers shift away from coal to
natural gas as their primary fuel.
While this rapid shift is providing important near-term envi-
ronmental and economic benefits, strong evidence suggests
                                                                            Strong evidence suggests
that becoming too reliant on natural gas poses numerous com-                that becoming too reliant
plex risks, including persistent price volatility, climate-chang-
ing emissions from combustion and the leakage of methane,                   on natural gas poses
and water and air pollution from natural gas production. Our
analysis shows that a wholesale shift to natural gas makes
                                                                            numerous complex risks.
less economic sense than would prioritizing investments in
renewable energy and energy efficiency. A more diversified            meet our growing electricity needs merit further examination
energy mix will result in an affordable and climate-friendly          because they will have major consequences for our economy,
power sector. With sensible policies in place, natural gas could      health, and climate for decades to come.
play a useful—though more limited—role in a clean energy                   The Natural Gas Gamble examines the risks and near-
system, especially if it came to be seen not as a replacement         term rewards of the recently growing contribution of natural
for coal but rather as an enabler of grid flexibility in support of   gas combustion to electricity generation and explores the
renewable technologies.                                               costs and benefits of various possible energy pathways as
                                                                      the United States transitions to a low-carbon economy. We
                                                                      present the findings of an analysis of the national electric
A Historic Shift from Coal to Cleaner Forms                           sector which highlights how renewable energy and energy
of Electricity                                                        efficiency can reduce the risks of overreliance on natural
                                                                      gas, cut carbon emissions, and contribute to a diverse and
From 2007 to 2013, coal’s share of the U.S. electricity mix           well-balanced clean energy supply. This analysis also outlines
declined from about half to just 39 percent while natural             a more balanced role for natural gas in a carbon-constrained
gas generation’s share grew from 22 percent to 27 percent             power sector.
(EIA 2014). Higher coal prices, standards aimed at limiting
harmful pollution from coal-fired power plants, and sharp
declines in natural gas prices driven primarily by U.S. shale         Risks and Rewards of the Natural Gas Surge
gas production are leading utilities to choose natural gas over
coal for meeting electricity demand. The choices being made           The burning of natural gas instead of coal to generate elec-
in the power sector today to replace retiring coal power and          tricity offers important and immediate benefits, including

© Shutterstock/Zorandim                                                                                      The Natural Gas Gamble    1
reduced air and water pollutants emanating from power Investing in Renewable Energy and Energy
plants, fewer smokestack carbon emissions, less power plant Efficiency: A Better Path Forward
water use, greater flexibility of the power grid, and renewed
economic development in gas-rich regions of the country. Using the Energy Information Administration’s National
These advantages, along with the current economic favora- Energy Modeling System, we analyzed the effects of climate
bility of natural gas, have led some states to increase rapidly and clean energy policy scenarios on the electricity sector,
their dependence on natural gas. In just five years, Florida has consumers, the economy, and carbon emissions for the
increased the share of its electricity generated from natural period through 2040. We examined three main scenarios:
gas from 44 percent to 62 percent. Many other states, includ- the Business as Usual Scenario (the projected path of the U.S.
ing Virginia, Delaware, Ohio, and Pennsylvania, are following electricity sector without changes to current policies); the
a similar path. Carbon Standard Scenario, which places a declining limit on
However, these rewards must be carefully weighed carbon emissions from the U.S. electricity sector to achieve
against the risks associated with this rapid adoption of nat- at least a 45 percent reduction from 2005 levels by 2030
ural gas as the electricity sector’s new fuel of choice. Central and at least a 65 percent reduction by 2040; and the Carbon
among these risks is historical and continued natural gas Standard plus Renewables and Efficiency Policies Scenario,
price volatility. Despite the shale gas surge, upward pressure which includes similar emissions limits as the Carbon Stan-
on prices is likely to result from increases in demand for dard Scenario plus a suite of strengthened renewable energy
natural gas for electricity and other competing uses—includ- and energy efficiency policies. We also separately examined
ing home heating, industrial production, and transporta- the impact of different natural gas prices on the outcomes of
tion—uncertainties about supply, and potentially increased these scenarios.
exportation of U.S. natural gas. Such price volatility can harm
consumers and the economy. Our analysis reveals the following key findings:
Smokestack emissions from natural gas combustion are • A business-as-usual electricity future would put the United
significantly cleaner than from coal combustion; however, States on a pathway of greater natural gas use, rising
the extraction, distribution, and storage of natural gas result carbon emissions, and higher natural gas and electricity
in the leakage of methane, a powerful global warming gas prices (Figure ES-1). In a Business as Usual scenario:
34 times stronger than carbon dioxide at trapping heat over
– Total natural gas use is projected to increase by
a 100-year period. Methane leakage diminishes the climate
nearly 18 percent between 2013 and 2040, with the
advantages of natural gas over coal. Furthermore, increasing
power sector representing the largest share of this
our reliance on natural gas could delay the deployment of
increase at 49 percent.
much cleaner renewable energy, putting us at greater risk
of failing to meet the level of emissions needed to avoid the – Power sector natural gas prices are 2.3 times higher
worst consequences of climate change (Newell and Raimi in 2040 than in 2013, and average consumer natural
2014; Shearer et al. 2014; EMF 2013; Fleischman, Sattler, and gas prices nearly double.
Clemmer 2013). • By replacing gas- and coal-fired generation with renew-
Natural gas production, particularly hydraulic fracturing, ables and efficiency, the Carbon Standard plus Renew-
also presents serious risks to public health and the environ- ables and Efficiency Policies Scenario results in a total
ment. These risks include potential contamination of drink- electricity resource mix portfolio that is 14 percent less
ing water supplies by chemicals used in hydraulic fracturing sensitive to long-term fluctuations in fossil fuel prices.
and air pollution from natural gas operations (EPA 2012a;
• Implementing a carbon standard along with renewable
Haluszczak et al. 2012; EPA 2011; Rowan et al. 2011).
energy and energy efficiency policies results in long-
If natural gas use continues to grow, the industry will
term savings on consumer energy bills as it cuts carbon
need to invest in costly new infrastructure, including pipe-
emissions and raises carbon revenues. While investments
lines and processing and storage facilities. These investments
in renewables and efficiency result in net costs of
may lock us into a high-carbon future. And, as public pressure
$19 billion in 2020, consumers would see annual net
to address climate change grows, much of this costly infra-
savings add up to $40 billion by 2030, rising to $59 billion
structure will have to be abandoned, rendering it a “stranded
by 2040.
asset.” Given limited financial resources and growing climate
risks, investment in renewable energy infrastructure would • Increasing the share of renewable energy and energy
involve less risk to consumers and the economy as a whole. efficiency is an important way to hedge against economic
2 union of concerned scientistsFIGURE ES-1. U.S. Electricity Generation, Business as Usual, and Carbon Standard plus Renewables and Efficiency
Policies Scenarios
Business as Usual Carbon Standard plus
6,000 6,000
Renewables and
Efficiency Policies
5,000 5,000
Efficiency
Billion Kilowatt-hours
4,000 4,000 Non-hydro Renewables
Hydro
3,000 3,000
Other
2,000 2,000
Natural Gas
1,000 1,000 Nuclear
Coal
0 0
2010 2020 2030 2040 2020 2030 2040
In the Business as Usual Scenario, the United States burns more natural gas than currently, even though the contribution of non-hydro
renewables increases, to meet the projected growth in electricity demand. Although coal generation is projected to decline through 2016, due
primarily to low natural gas prices and retirement of some older plants, model projections show that it rebounds some in the later years of
the forecast in response to rising natural gas prices and growing electricity demand. The U.S. electricity generation mix would be cleaner and
more diverse if a carbon standard were combined with strong renewables and efficiency policies. In the Carbon Standard plus Renewables
and Efficiency Policies Scenario, the share of non-hydro renewables grows six-fold to 39 percent of total generation by 2040, energy efficiency
reduces electricity demand by 16 percent, and the share of natural gas generation remains mostly constant.
and climate risks in a future that includes uncertain An electricity sector that will burn increasing amounts of
natural gas prices. This strategy helps lower consumer natural gas, emit more and more carbon, and contribute to
electricity bills and carbon emissions under a range of higher natural gas and electricity prices is clearly unaccept-
possible future natural gas price scenarios. able. Our analysis shows that a combination of a carbon stan-
• Electricity bills in 2040 are lowest in the Carbon Stan- dard with complementary renewable energy and efficiency
dard plus Renewables and Efficiency Policies Scenario policies can cut power plant carbon emissions significantly
with baseline and high gas price forecasts. while reducing our long-term reliance on natural gas, lower-
ing costs, and providing important public health benefits.
• In 2020, the societal benefits of pursuing carbon emis-
sions reductions are 2.6 times greater than the consumer
compliance costs, or nearly $36 billion. By 2040, the
Working Toward an Appropriate, Balanced
compliance costs of the Carbon Standard plus Renew-
Role for Natural Gas
ables and Efficiency Policies Scenario are actually slightly
lower than business as usual, primarily because of lower Our analysis indicates there is a strong need for changes in
fuel expenses as we shift to more renewable energy and policy if we want to minimize the pitfalls of an overreliance
energy efficiency. As a result, the net societal benefits on natural gas. Investing more heavily in renewable energy
grow to nearly $170 billion in that year (Figure ES-2, p. 4). and energy efficiency can put us on a smarter, shorter, and
• Combining a carbon standard with renewable energy less risky pathway toward a more affordable, reliable, and
and energy efficiency policies can reduce power plant diversified electricity system that delivers not just near-term
carbon emissions 70 percent below 2005 levels by 2040. economic and environmental gains but also the long-term
As part of a global effort to help limit some of the worst goal of addressing climate change.
consequences of climate change, further reductions The Environmental Protection Agency’s Clean Power
in U.S. power sector carbon emissions will be needed Plan—a forthcoming federal standard designed to limit power
by midcentury. sector carbon emissions—provides a valuable near-term
The Natural Gas Gamble 3FIGURE ES-2. Benefits and Costs of Policies That Limit Carbon Emissions, relative to Business as Usual Scenario
180
160
140 64.4
120
100
49.5
Billion 2013$
80
60
103.8
28.5
40 SO2, NOx Reduction Benefits
64.0
22.9
20 Carbon Reduction Benefits
30.2
5.1
0 Compliance Costs
-0.7
-20 Costs Benefits Costs Benefits Costs Benefits
2020 2030 2040
Our modeled scenarios show that the benefits of transitioning to cleaner power clearly outweigh the costs. “Compliance costs” are the incre-
mental costs of deploying a cleaner generation mix in our Carbon Standard plus Renewables and Efficiency Policies Scenario relative to costs
included in our Business as Usual Scenario. “Benefits” are the monetized damages avoided by reducing emissions of carbon dioxide (CO2),
sulfur dioxide (SO2), and nitrogen oxides (NOx).
opportunity for utilities, regulators, and policy makers to transition away from coal to a cleaner, more modern, and
accelerate the transition to an electricity system powered efficient electric system.
primarily by renewable energy and energy efficiency (Cleetus The choice is clear. As the nation moves away from
et al. 2014a). States play a crucial role in ensuring the success coal, setting course toward a diverse supply of low-carbon
of the Clean Power Plan and should prioritize the use of power sources—made up primarily of renewable energy and
renewable energy and energy efficiency to meet as much of energy efficiency with a balanced role for natural gas—is far
their emissions reduction target as possible. preferable to a wholesale switch to natural gas. By making
Policy makers should adopt additional or strengthen smart energy choices today, we can transition to a more
existing policies to hasten the deployment of renewable consumer-friendly and diverse electricity system, achieve
energy and energy efficiency resources. Such policies should cost-effective CO2 emissions reductions, and face fewer risks
include renewable electricity standards, energy efficiency stemming from an overreliance on natural gas.
resource standards, carbon pricing programs, extended
tax incentives and other financial incentives for renewable
energy and energy efficiency, and deployment of combined
There is a strong need
heat and power systems. for changes in policy if
Strong state and federal laws and regulations are also
needed to limit methane emissions from natural gas oper- we want to minimize the
ations and to address the risks to public health and safety
resulting from hydraulic fracturing. We must also modernize
pitfalls of an overreliance
the U.S. electric grid and the rules that govern it as we on natural gas.
4 union of concerned scientists[ Introduction ]
The transition away from coal presents
an unprecedented opportunity to set a new
course for how we supply electricity in the
United States.
In August 2014, Alabama Power Company announced that it controls in order to address serious public health risks in
would convert three coal units at the Barry plant in Mobile addition to the cost of general refitting (Cleetus et al. 2012).
County to natural gas (Walsh 2014). That same month, Illi- Other market factors making coal less attractive include low
nois-based NRG Energy Inc. reported that its coal power natural gas prices, reduced growth in electricity demand, and
plant in Joliet would be converted to natural gas (Wernau the rapid growth of energy efficiency and renewable energy
2014). Similarly, in November 2013, the Tennessee Valley resources due to falling costs and successful policy measures
Authority (TVA)1 announced that it would retire two large, (Cleetus et al. 2012).
1960s-era generating units at its Paradise coal plant near This transition away from coal presents an unprece-
Drakesboro, Kentucky, replacing them with a $1 billion natu- dented opportunity to set a new course for how we supply
ral gas power facility at the same location (TVA 2013). electricity in the United States. All utility-scale energy
Recent announcements such as these reflect a pre- decisions entail major financial investments in long-lived
dominant trend in the energy choices electric utilities have infrastructure that are not easily modified. Furthermore,
been making lately—contributing to the biggest shift to have the electric power sector is the largest single contributor to
occurred in the U.S. power sector in the past half century. U.S. global warming pollution, and coal plants alone were
Our nation’s dependence on coal-fired power is decreasing as responsible for 78 percent of electric sector carbon dioxide
aging and polluting power plants struggle to remain compet- (CO2) emissions in 2013 (EIA 2014c). These facts mean that
itive. Coal accounted for about half of our nation’s electricity the choices we make today to retire coal power and build
supply in 2007 but provided just 39 percent of the nation’s infrastructure to meet our growing electricity needs will have
electricity by 2013 (EIA 2014a). Since 2009, utilities have major consequences—both risks and opportunities—for our
announced plans to close or convert to natural gas more than economy, health, and climate for many decades to come.
430 coal generators in 37 states—equal to about 20 percent, As indicated by the recent Alabama Power, NRG Energy,
or 70 gigawatts (GW), of total U.S. coal power capacity (Fleis- and TVA announcements, many power providers are
chman et al. 2013). choosing to invest in natural gas to replace coal-generated
A combination of market and policy factors is driving electricity. On the surface, switching from coal to natural gas
these changes. The cost of coal has risen in recent years (EIA may appear a sound decision. Natural gas prices have fallen
2014b), especially in comparison with the competition, and sharply in recent years, due largely to advances in hydraulic
many coal-fired generators have exceeded their intended fracturing (“fracking”) and horizontal drilling techniques that
design and economic lifespan. If older units are to remain have made more natural gas reserves accessible and driven
in service, owners will face the cost of upgrading pollution a more than six-fold increase in U.S. shale gas development
1 The TVA is a federally owned corporation that largely produces wholesale power. It provides electricity to approximately 9 million customers in several
southeastern states.
The Natural Gas Gamble 5FIGURE 1. U.S. Natural Gas Production by Source, 2000 to 2014
25
20 Shale Gas
Trillion Cubic Feet
15
Tight Gas
10
Lower 48 Onshore
5 Conventional
Lower 48 Offshore
Coalbed Methane
0
2000 2001 2002 2003 2004 2005 2006 2007 2008 2009 2010 2011 2012 2013 2014
Alaska
Recent advances in hydraulic fracturing and horizontal drilling techniques have spurred a rapid increase in the production of natural gas
from shale resources. Since 2007, shale gas production has increased more than six-fold and now accounts for 40 percent of total U.S. natural
gas production. The U.S. Energy Information Administration projects that the growth in shale gas production will continue through at least
2040 (EIA 2014c).
SOURCE: EIA 2014C.
since 2007 (Figure 1) (EIA 2014c). Compared with coal, natu- Instead of overrelying on natural gas to replace polluting
ral gas generation also offers other important and immediate coal and meet the growing demand for electricity, a better
benefits, including reduced harmful air and water pollution solution is to prioritize investments in renewable energy
from power plants, lowered smokestack carbon emissions, and energy efficiency. This report shows that, by avoiding an
less water use, greater flexibility of the power grid, and overreliance on natural gas and pursuing a diverse supply of
renewed economic development in gas-rich regions of the low- and zero-carbon sources (made up primarily of renew-
country. These advantages have led to a surge in natural gas able energy and energy efficiency), we can ensure a more con-
generation, resulting in a 23 percent increase in its share of sumer-friendly, resilient, and diversified electricity system,
the U.S. electricity mix from 2007 to 2013 (EIA 2014a). while also delivering cost-effective CO2 emissions reductions
Closer examination, however, reveals a number of serious and public health benefits.
and complex risks that call into question utility decisions Renewable energy resources, such as wind and solar
to become increasingly dependent on natural gas for power power, are already ramping up quickly across the country
generation. For example, even though supply has grown and demonstrating that they can deliver affordable, reliable,
markedly, natural gas prices continue to be volatile. Natural and low-carbon power. Advances in technology, decreases in
gas price spikes not only harm consumers and the economy, costs, and strong policy mechanisms are driving tremendous
but also can create perverse incentives for utilities to switch growth of these resources. Wind power capacity increased
back to using old and polluting coal plants. And although nat- by 75 percent while solar capacity increased by 473 percent
ural gas plants’ smokestack emissions are significantly cleaner from 2009 to 2013 (AWEA 2014; SEIA 2014). The national
than coal plants’, the extraction, distribution, and combustion average cost of wind power has dropped more than 60 per-
of natural gas result in the leakage of methane, a global warm- cent since 2009, making it competitive with new fossil fuel
ing gas that is 34 times stronger than CO2 at trapping heat and plants in many regions (Wiser and Bolinger 2014). Solar
presents serious environmental, public health, and climate photovoltaic system costs fell by about 40 percent from 2008
change challenges (Myhre et al. 2013). Continuing to increase to 2012 and by another 15 percent in 2013 (Kann et al. 2014;
the nation’s dependence on natural gas—as government Barbose et al. 2013).
forecasts project under current policy and market condi- Numerous studies have found that much higher levels
tions—exacerbates these risks while delaying the transition to of renewable energy can be reliably and affordably achieved
a diverse and truly low-carbon electric power system. with existing technologies and measures. Nationally, the
6 union of concerned scientistsshare of non-hydro renewable resources represented 6 per-
cent of the U.S. power supply in 2013, but these renewable
sources could contribute 30 percent of the total U.S. power
supply or more within the next two decades (UCS 2013b).
And by 2050, with strong investments and modest improve-
ments in existing technologies, renewable energy could
supply 80 percent of the U.S. power supply (NREL 2012).
The Environmental Protection Agency’s (EPA) Clean
Power Plan—a forthcoming federal standard required under
the Clean Air Act—provides a valuable near-term opportunity
for utilities, regulators, and policy makers to accelerate the
© DOE
transition to an electricity system powered primarily by
renewable energy and energy efficiency. The Clean Power Renewable energy resources are rapidly expanding across the country, demon-
strating that they can deliver clean, affordable, and reliable power. For example,
Plan, set to be finalized in the summer of 2015, aims to solar photovoltaic experienced a nearly 5-fold increase from 2009 to 2013 thanks
protect public health and slow the pace of climate change largely to advances in technology and declining costs.
by reducing carbon emissions from electricity generation. It
establishes emissions rate reduction targets for the power
sector state by state and would reduce national electric sector next few years. These options include increasing generation
CO2 emissions by an estimated 30 percent below 2005 levels from renewable energy, nuclear, and natural gas power plants
by 2030. To meet the targets, states must choose from among and investing in energy efficiency at fossil fuel plants and in
a variety of emissions-reducing options to implement over the buildings and industry.
© TVA Web Team/Creative Commons (Wikimedia)
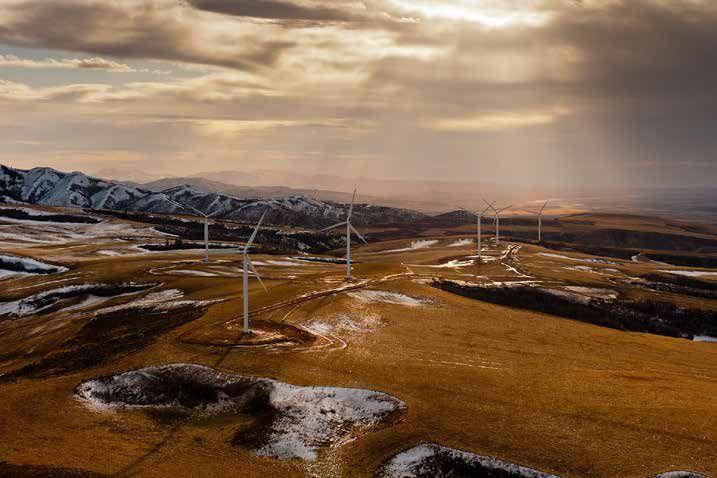
The Tennessee Valley Authority’s Paradise coal plant near Drakesboro, Kentucky is emblematic of the nation’s shift away from electricity generated by coal and toward
natural gas. Two large, 1960s-era generating units at the facility will be retired by 2017, and replaced with a $1 billion natural gas power facility at the same location.
The Natural Gas Gamble 7© DOE
Investing in wind power and other renewable energy technologies is a smart and cost-effective solution for cutting CO2 emissions and reducing the risks of an over
reliance on natural gas.
To fully capitalize on the promise of renewable energy impacts these technology mixes might have on consumers,
and minimize the risks associated with an overdependence the economy, and carbon emissions. The analysis reveals the
on natural gas, we must make smart energy decisions today. significant role renewable energy and energy efficiency can
This report explores the costs and benefits of various energy play in reducing the risks presented by an overreliance on
pathways in the transition to a low-carbon economy. We natural gas. Finally, we discuss what might be an appropriate
begin by examining the rewards and risks resulting from the role for natural gas in a carbon-constrained power sector.
dramatic expansion of production and use of natural gas in And we recommend policies at the state, regional, and federal
the United States. Next, we describe and then present the levels that can help accelerate the growth of renewable
results of a national electric-sector analysis that examines the energy and energy efficiency in the shift toward a diverse and
interplay between various energy technologies under several balanced electricity system that is reliable, affordable, and
climate and clean energy policy scenarios. We analyze the climate friendly.
Renewable energy resources are
demonstrating that they can deliver afford-
able, reliable, and low-carbon power.
8 union of concerned scientists[ chapter 1 ]
Rewards and Risks of Natural Gas
An increase in shale gas development, made possible by hori- also showed natural gas playing a more limited role, which
zontal drilling and improved hydraulic fracturing techniques, seemed plausible as domestic supply was constrained and
has cut domestic natural gas prices and led to a rapid shift wholesale natural gas prices were ranging from 3 to 4 times
from coal to natural gas electricity generation. However, the higher than historic trends.
potential rewards of this rush to natural gas must be carefully But soon thereafter, the energy landscape began to
weighed against its many risks. change dramatically. The use of hydraulic fracturing spread
rapidly, making vast shale gas reserves more easily and
economically accessible (EIA 2014d). The EPA also began
Near-Term Rewards of the Natural Gas Surge proposing and implementing tighter clean air, clean water,
and public health standards for the power sector, including
COAL DISPLACEMENT the long-awaited Mercury and Air Toxics Standard.
As a result, the generation fuel mix shifted away
Burning natural gas instead of coal results in a number of
from coal toward more natural gas and renewable energy.
immediate public health and environmental benefits. Natural
Nationally, coal generation declined from 48 percent of the
gas combustion releases much smaller amounts of soot- and
total U.S. electric power supply in 2007 to 39 percent in 2013
smog-forming pollutants, including nitrogen oxides (NOx),
sulfur dioxide (SO2), and fine particulates, which contribute
to asthma and a variety of other lung and heart conditions.
Also, unlike coal, natural-gas-fired electricity generation does
not emit appreciable levels of mercury, arsenic, and other
toxic substances that can cause adverse neurological effects in
children and other health problems (EPA 2012b; CATF 2010;
EPA 2010; Gentner and Bur 2010; NRC 2010a; Trasande,
© Shutterstock/Allen Furmanski
Landrigan, and Schechter 2005).
As recently as 2007, it looked as if the long-term future
of the U.S. electricity sector would continue to be coal dom-
inated. In that year, coal accounted for nearly half of total
U.S. electricity generation. Experts projected that the sector
would continue along the path of greater coal-fired genera-
tion for the next several decades, with 139 GW of new coal The transition toward greater use of natural gas for power generation has been
especially dramatic in Florida, among other states. Between 2007 and 2013
power capacity (the equivalent of about 230 new typical-size Florida’s dependence on electricity from natural gas increased from 44 percent
plants) to come online by 2030 (EIA 2007). These projections of the generation mix to 62 percent, largely displacing coal power.
The Natural Gas Gamble 9FIGURE 2. Change in U.S. Electricity Generation Mix, 2007 to 2013
2007 2013
Natural Gas Natural Gas
22% 27%
Nuclear
Nuclear 20%
19%
Coal
48%
Coal
39% Hydroelectric
Hydroelectric 7%
6%
Other Renewables Other Renewables
2% 3% 1% 6%
A combination of market and policy factors has contributed to a major shift in the makeup of the U.S. electricity generation mix from 2007
through 2013. As coal generation declined, it was replaced by generation from a combination of cleaner power sources—led by natural gas.
SOURCE: EIA 2014A.
(Figure 2). During the same period, the contribution of natu- 19 GW of mostly smaller, less-utilized coal generators were
ral gas increased from 22 percent to 27 percent—representing retired. These trends are expected to continue, as power plant
a 23 percent increase. In over 65 years of record keeping, coal owners have announced plans to retire an additional nearly
generation had never dropped below 40 percent of the U.S. 44 GW of coal capacity through 2025. In addition, a recent
power supply until 2012. analysis identified at least another 64 GW as economically
The transition toward greater use of natural gas from vulnerable (Fleischman et al. 2013).
2007 to 2013 was even more dramatic in a number of states A combination of market and policy factors points to
(Table 1). For example, natural gas generation in Georgia coal’s continued decline. The advanced age of many coal
more than tripled from 11 percent to 34 percent, largely by plants, higher coal prices, and the ongoing need to cut
displacing coal power. In Florida, the third largest electricity pollution from coal plants are strong factors. So are the
producer in the United States, dependence on electricity from falling prices of wind and solar power, which combined with
natural gas increased from 44 percent of the generation mix to supportive state and federal policies, have led to the doubling
62 percent. Even in heavily coal dependent states like Pennsyl- of non-hydro renewable energy sources from 2007 through
vania and Ohio, natural gas generation increased significantly 2013. The reduced growth in electricity demand—caused by
during this period. In 2013, a total of 16 states generated more state and federal energy efficiency policies as well as a slow
than 33 percent of their electricity from natural gas. economic recovery—is also a contributing factor. But perhaps
As coal power plants were either backed down or retired, the strongest factors currently in play are the comparatively
underused existing natural gas power plants largely replaced low price of natural gas, the better thermal efficiency and
their output. From 2008 to 2013, the capacity factor2 of the operating flexibility of natural gas power plants, and this
U.S. coal fleet decreased from 73 percent to 60 percent while fuel’s ability to allow generators to meet state and federal
the capacity factor of existing U.S. natural gas combined-cycle public health and climate regulations more easily.
power plants increased from 40 percent to 47 percent (EIA
2014e). In addition, some of the coal generation was displaced
ECONOMIC DEVELOPMENT
by generation from new power plants coming online. Between
2011 and 2013, 23 GW of natural gas, 21 GW of wind, and more While many U.S. industries suffered employment losses
than 9 GW of solar capacity were added while from 2007 to 2012, the oil and natural gas industry increased
2 The capacity factor measures how often and intensively a generator is run over time. It is calculated as the ratio of actual power output to potential output if the
generator had operated at full (100 percent) capacity over the same period.
10 union of concerned scientistsTABLE 1. Change in Natural Gas as a Percent of In-State Generation Mix 2007 through 2013, Ranking of States
Natural Gas as % of Natural Gas as % of
Generation Mix Generation Mix Change from 2007 to 2013,
State (2007) (2013) in Percentage Points
1 Delaware 22% 75% 53
2 Georgia 11% 34% 23
3 North Carolina 3% 22% 19
4 Florida 44% 62% 18
5 Mississippi 43% 60% 17
6 Virginia 14% 29% 15
7 Alabama 16% 31% 15
8 Connecticut 30% 44% 14
9 Pennsylvania 8% 22% 13
10 Ohio 3% 15% 13
11 New Jersey 30% 42% 12
12 Massachusetts 53% 63% 10
13 New York 31% 39% 8
14 Idaho 14% 22% 7
15 South Carolina 6% 13% 7
16 New Mexico 19% 25% 7
17 Minnesota 7% 13% 6
18 Tennessee 1% 6% 5
19 Indiana 3% 8% 5
20 Arkansas 15% 20% 5
The nationwide shift away from burning coal toward burning natural gas for electricity generation is more starkly reflected in a number of
states. Some states now use natural gas to generate nearly two-thirds or more of their electricity, making them highly reliant on this one fuel.
SOURCE: EIA 2015.
employment by more than 30 percent, adding over 120,000 and ammonia for fertilizer. The U.S. chemical industry has
new jobs. Texas had the largest gains in employment, adding invested an estimated $15 billion recently to increase ethylene
64,515 oil and gas jobs over this period, while employment production, including investment in a major expansion at
in the Pennsylvania oil and gas industry increased over a Dow Chemical facility in Texas (Bullis 2013; PWC 2013).
250 percent (BLS 2014a). As of 2012, the oil and gas industry Expanding low-cost ethylene production capacity can help
employed about six times more U.S. workers than the coal spur growth in other domestic manufacturing.
mining industry. Oil and gas wage gains have also outpaced
national averages over the last few years (BLS 2014b).
LOWER ELECTRICITY PRICES
As the U.S. economy recovers, low natural gas prices and
increased supplies are also contributing to a resurgence of As a result of the dramatic expansion of U.S. shale gas pro-
domestic manufacturing and chemical industries. Natural duction in recent years, natural gas has become a low-cost
gas can be used as a feedstock to make many types of prod- option for new power generation in many regional electricity
ucts, including ethylene for plastics, carpets, clothes, tires, markets. Gas prices began to fall in 2008 as drilling expanded
The Natural Gas Gamble 11© Duke Energy/Creative Commons (Flickr)
The recent surge in natural gas power generation, made possible by increased domestic supplies and low natural gas prices, offers important benefits compared with
coal, including reduced air and water pollution, lowered smokestack carbon emissions, and greater flexibility of the power grid. However, the rewards of this rush to
natural gas must be carefully weighed against its many risks.
in the eastern U.S. and demand tapered in response to a other renewable energy generators ramp up and then brought
global recession. Advances in U.S. shale gas production back on to help balance the grid as renewable generators
have led to projections that domestic natural gas prices will ramp down.
remain relatively low over the next few years (EIA 2014c).
Following declining gas prices, wholesale electricity prices
dropped more than 50 percent on average from 2008 to 2011
Risks from an Overreliance on Natural Gas
(Johnsson and Chediak 2012). And even accounting for
price increases starting in 2012 and recent price spikes ECONOMIC RISKS
related to extreme weather events, natural gas still remains
Price Volatility. The natural gas industry has a well-
cost-competitive in most power markets.
documented history of price volatility. Due to the nature
of its production, storage, and transmission; the fact that it
GRID RELIABILITY/FLEXIBILITY
supplies many end uses; and its susceptibility to extreme
Natural gas generators contribute to a more reliable elec- weather events, the price of natural gas fluctuates more than
tricity supply in several ways. They can provide continuous does the price of its competitors. For example, the natural
power or be ramped up and down quickly to meet ongoing gas market experienced a number of dramatic price swings
changes in demand. In fact, natural gas peaking power plants between 2003 and 2014 (Figure 3). In 2005, the spot market
have long been relatively inexpensive to build and used price spiked to nearly $14 per million British thermal units
when the grid experiences extremely high demand, such as (MMBtu) in response to hurricane activity in the Gulf of
during summer heat waves, thereby preventing blackouts. Mexico, where many gas wells are located. In contrast,
In addition, natural gas can assist the integration of more prices dipped to about $2 per MMBtu in 2012 in response to
renewable energy generation, thereby creating a more diverse decreased demand resulting from the economic recession and
and flexible electricity system (NREL 2012). Given the quick from a series of warm winters, which reduced competition
ramping ability of natural gas generators, the electricity between heating and electricity suppliers for limited natural
they produce can be taken off the grid as wind, solar, and gas pipeline resources.
12 union of concerned scientistsFIGURE 3. Natural Gas Spot Prices*, 2002 through 2014
14
12
10
8
$/MMBtu
6
4
2
0
2002 2004 2006 2008 2010 2012 2014
For more than a decade, U.S. natural gas prices have been subject to significant volatility, which can harm consumers and the economy.
*At the Henry Hub Terminal in Erath, Louisiana.
SOURCE: EIA 2014F.
In the past, price volatility has made some power Natural gas price volatility can have a negative effect on
producers cautious about relying too heavily on natural gas. the economy, consumers, and the environment. For example,
Yet most utilities have typically responded to periods of low elevated natural gas costs contribute to higher electricity
prices by investing in new natural gas power plants and using prices, especially in regions heavily reliant on natural gas.
existing ones more frequently. For example, nearly 187 GW In New England, a region that generates 46 percent of its
of natural gas capacity—more than 40 percent of the current electricity from natural gas, wholesale electricity prices are
U.S. fleet—was added between 2000 and 2003, when natural closely linked to the price of natural gas (ISO New England
gas prices were near historic lows (EIA 2013a). Since 2009, 2014). When natural gas prices spiked in January 2014,
when prices began to fall again, another 45 GW of natural wholesale electricity prices in the region also jumped to
gas capacity has come online, and an additional 48 GW of nearly $100 per megawatt-hour (MWh) (ISO New England
capacity is under construction or planned through 2020 2014). These costs are then passed on to consumers. NStar
(SNL 2015; EIA 2013a). This shift toward greater dependence and National Grid, the two largest electric utilities in Massa-
on natural gas for power during periods of low prices can chusetts, recently announced rate increases of 29 percent and
exacerbate the impact on consumers and the economy when 37 percent respectively, citing natural gas prices (Newsham
prices spike higher. 2014a; Newsham 2014b). Rate increases of this magnitude are
Although the recent increase in U.S. shale gas production particularly burdensome to families on fixed incomes, and the
has resulted in lower natural gas prices, it has not eliminated impact is even greater on families who heat their homes with
price volatility. For example, a cold wave that began in natural gas.
December 2013, caused by a southward shift in the North In addition, higher natural gas prices could lead elec-
Polar Vortex, resulted in record low temperatures that tricity generators to shift from gas back to coal, undermining
extended into March 2014. High natural gas demand—for efforts to reduce carbon emissions in the process. Evidence
electricity and heating purposes—combined with pipeline of this in the short run appeared in 2013, when higher gas
constraints and irregularities between the power and heating prices resulting from responses to several particularly severe
markets resulted in record-high delivered natural gas prices cold snaps led utilities in some regional markets to ramp
across much of the Northeast and parts of the Midwest. On down natural gas plants and ramp up coal plants. Fortunately,
January 7, 2014, average delivered natural gas prices spiked the rapid addition of wind and solar resources to the power
from $35 to $40 per MMBtu in the Northeast, 10 to 12 times system between 2008 and 2013 helped reduce the magnitude
higher than average prices for the prior several years (Rose of this 2013 coal rebound (EIA 2014a), clearly demonstrating
et al. 2014). both the benefits of a more diversified electricity mix and the
The Natural Gas Gamble 13potential of renewable energy to provide reliable and afford-
able power for millions of consumers. Nevertheless, this
Many experts believe that
event led some coal state officials and industry executives to low natural gas prices are
question recent decisions to retire rather than upgrade some
outdated coal power plants (Chediak and Weber 2014). not sustainable over the
Many experts believe that low natural gas prices are not
sustainable over the long term. For example, the U.S. Energy
long term.
Information Administration’s (EIA) Annual Energy Outlook
Typically, higher prices in overseas markets are due to supply
projects that spot prices will significantly increase from the
constraints, smaller coal reserves, or stricter environmental
recent low point of $2.75 per MMBtu in 2012 to $6.03 per
policies that favor the use of natural gas over the use of coal.
MMBtu in 2030 and $7.65 per MMBtu in 2040 (EIA 2014c).
Now, with the domestic hydraulic fracturing production
Factors that contribute to upward pressure on prices and the
boom, a much greater price difference exists between
risk of price volatility include uncertain available supply and
North America and other markets. In response, expansion
potentially increasing demand for natural gas from electric
of U.S. export capabilities—via liquefied natural gas (LNG)
utilities, other competing domestic users, and exporters.
terminals—is already well underway. As of October 2014, four
The use of natural gas for electric power is growing
LNG export terminals have been approved by federal author-
rapidly and currently accounts for 32 percent of total U.S.
ities and another 14 have been proposed (FERC 2014a; FERC
consumption of natural gas (EIA 2014c). Competing uses
2014b). Although it is unlikely that all these terminals will
are industrial applications (34 percent), heating for homes
be developed, the EIA projects that annual U.S. LNG exports
and commercial buildings (31 percent), and transportation
will increase from less than 0.01 trillion cubic feet (tcf ) today
(3 percent) (EIA 2014c). Changes in demand or the market
to 3.5 tcf in 2030—which is equal to 43 percent of the gas
structure for any of these uses can influence prices and
consumed by the electric power sector in 2013 (EIA 2014c).
the other uses’ access to supplies. Furthermore, regulators
A dramatic expansion of natural gas exports could
prioritize end uses like home heating over electric power
influence the price of natural gas and contribute to greater
generation during periods of supply constraints, which may
domestic price volatility. According to the EIA, increased
lead to greater price and reliability concerns as dependence
natural gas exports will lead to higher domestic natural gas
on natural gas increases in the power sector.
prices, despite more domestic production, and increased
Added to these demand pressures is the natural gas
pipeline imports from Canada (EIA 2012a). Modeled scenar-
industry’s growing desire to export U.S. product to parts of
ios in which natural gas exports increase to range from 2.2 tcf
the world where prices are higher (Colman 2013; EIA 2013b).
to 4.4 tcf annually project that average U.S. residential and
industrial consumer energy bills will rise by an additional
3 to 9 percent for natural gas and 1 to 3 percent for electricity
(EIA 2012a). There is still some debate about how much
impact increased exports would have on domestic natural gas
prices (NERA 2012), but it is clear they would be one more
force pushing gas prices upward.
Stranded Assets. Choices made today to invest in infra-
structure intended to lower costs and carbon emissions by
replacing coal with natural gas risk leading to the unintended
consequence of locking energy consumers into a high-carbon
future. If natural gas use continues to grow, greater invest-
© iStockphoto/pawel.gaul
ment in pipeline and processing and storage facilities will
be required. A recent report by the Interstate Natural Gas
Association of America finds that their most-likely growth
scenario would require 43 billion cubic feet a day (Bcfd) of
Natural gas price volatility can have a negative effect on consumers, especially incremental natural gas mainline capacity to be built from
in regions heavily reliant on natural gas. Higher natural gas costs can contribute 2014 to 2035 (ICF International 2014). The report also proj-
to increases in electricity prices of 30 percent or more, which is particularly bur-
densome to families on fixed incomes. The impact is even greater on families who
ects that investments in new natural gas infrastructure—
also heat their homes with natural gas. including pipelines, storage and processing facilities, and
14 union of concerned scientistsand other facilities will become “stranded assets” (IEA 2014;
McGlade and Ekins 2014; Carbon Tracker Initiative 2013).
In contrast, a recent Department of Energy (DOE) study
outlining a pathway to generating 80 percent of electricity
from renewable energy by 2050 (with 80 percent reductions
in carbon emissions) projected annual investments in new
transmission infrastructure, including interconnections for
all plants, ranging between $6.4 and $8.4 billion per year from
2011 through 2050 (NREL 2012). The more money is invested
in natural gas infrastructure, the harder it will become
for cleaner, renewable resources to eventually displace
natural gas.
Greater emphasis on infrastructure investments made
to support renewable energy would result in lower financial,
industry, and climate risks.
Socioeconomic Impacts. The boom in unconventional natu-
ral gas extraction has led to a rapid expansion of operations in
many rural, previously undeveloped, areas. While this devel-
opment can result in increased tax revenue for struggling
© Harry Harms/Creative Commons (Flickr)
communities and extra income for property leaseholders,
other nearby residents may suffer decreased property values
due to elevated levels of dust, noise, odor, light, and pollution
(Adgate, Goldstein, and McKenzie 2014). An increase in
heavy truck traffic puts community members at greater risk
from accidents and localized air pollution. The remarkable
growth in industrial activity and population in gas-rich
A recent report estimated that hundreds of billions of dollars in new infrastruc- areas has been linked to higher rates of crime and substance
ture investments—including pipelines—would be needed over the next two abuse—straining local public safety and health services—as
decades to continue the growth in natural gas for power and other end uses. Such
costly investments could become stranded assets, however, if sufficient political well as to steep inflation of housing rental prices, and dra-
pressure mounts to make significant reductions in carbon emissions. matic changes to a community’s character and landscape.
These negative factors have a greater impact among low- and
fixed-income members of a community (Adgate, Goldstein,
equipment leasing—needed through 2035 would average
and McKenzie 2014).
approximately $14 billion per year, totaling $313 billion
(in 2012 dollars). This infrastructure would serve multiple
CLIMATE RISKS
sectors that use natural gas, not just the electricity sector.
However, the study projects that about 75 percent of the Smokestack Emissions. As with any fossil fuel, burning
incremental growth in natural gas demand through 2035 will natural gas for electricity generation results in the release of
be for power generation (ICF International 2014). CO2 and thus contributes to global warming. It is true that
There are currently numerous proposals across the coun- replacing coal plants with natural gas plants will likely reduce
try to build new natural gas pipelines and storage facilities the amount of CO2 emitted for each MWh of U.S. electricity
(EIA 2012b), in part to help reduce price volatility. Pipelines generated. When combusted in an efficient, combined-cycle
typically have a physical useful life of 50 to 100 years and are power plant, natural gas emits approximately 800 pounds of
financed for as long as 40 years. CO2 per MWh—an amount some 50 to 60 percent less than
Investing in large amounts of infrastructure carries risk the amount emitted from a typical new coal plant (NETL
for the natural gas industry. As increasing public awareness 2010). However, a number of recent studies have come to the
of the dangers of climate change lead to increasing political conclusion that abundant natural gas will do little to reduce
pressure to cut carbon emissions, much of this costly infra- power sector heat trapping emissions (Newell and Raimi
structure may have to be abandoned long before it ends its 2014; Shearer et al. 2014; EMF 2013).
useful life. In the parlance of Wall Street, these pipelines
The Natural Gas Gamble 15One of the biggest reasons for this paradox is that production (Tollefson 2013; Cathles et al. 2012; Howarth et al.
increased reliance on natural gas will likely delay the deploy- 2012; Petron et al. 2012; Skone 2012; Weber and Clavin 2012).
ment of renewable energy, as has been shown in extensive Currently, the natural gas industry is the largest
modeling of future scenarios. As demand for electricity grows industrial source of methane emissions, and its emissions
and generating capacity is added to the system to meet it, are expected to increase as a result of the recent hydraulic
demand that could have been met by new renewable energy fracturing boom. According to the EPA, methane amounted
resources may instead be met by natural gas. As a result, to 9 percent of total U.S. global warming emissions in 2012,
total carbon emissions would fail to approach the level of which ranks it behind only CO2 (EPA 2014). However,
reductions needed to avoid the worst consequences of climate this is likely an underestimate. The EPA used an outdated
change. Under certain scenarios, power sector global warm- measurement of global warming potential for methane; a
ing emissions may actually increase (Fleischman, Sattler, and more accurate Intergovernmental Panel on Climate Change
Clemmer 2013). estimate pegs the impact of methane over 100 years at a
level 36 percent higher than the EPA estimate (IPCC 2014).
Fugitive Methane Emissions. Direct smokestack pollutants
Additionally, a 2014 study found that the EPA’s current figures
are not the only global warming emissions associated with
natural gas. The drilling and extraction of the fuel from wells,
as well as its processing, transmission, distribution, and
storage, also result in the leakage of methane—a primary com-
The natural gas industry
ponent of natural gas that is 34 times stronger than carbon is the largest industrial
dioxide at trapping heat over a 100-year period and 86 times
stronger over 20 years (Myhre et al. 2013). Although there is source of methane
still uncertainty about the precise quantity of these so-called
fugitive methane emissions, preliminary studies and field
emissions—a highly potent
measurements range from 1 to 9 percent of total natural gas global warming gas.
© Mscalora/Creative Commons (Wikimedia)
Like all fossil fuels, burning natural gas for electricity generation results in the release of CO2 and thus contributes to global warming.
16 union of concerned scientistsYou can also read