Medium- and Heavy-Duty Vehicle Electrification - An Assessment of Technology and Knowledge Gaps - Oak ...
←
→
Page content transcription
If your browser does not render page correctly, please read the page content below
ORNL/SPR-2020/7

Medium- and Heavy-Duty
Vehicle Electrification
An Assessment of Technology and
Knowledge Gaps
(December 2019)
ORNL/SPR-2020/7

       Medium- and Heavy-Duty Vehicle Electrification
    An Assessment of Technology and Knowledge Gaps

       Oak Ridge National Laboratory (ORNL) and National Renewable Energy Laboratory (NREL)

                                            December 2019

ORNL: David Smith, Ron Graves, Burak Ozpineci, P. T. Jones

NREL: Jason Lustbader, Ken Kelly, Kevin Walkowicz, Alicia Birky, Grant Payne, Cory Sigler, Jeff Mosbacher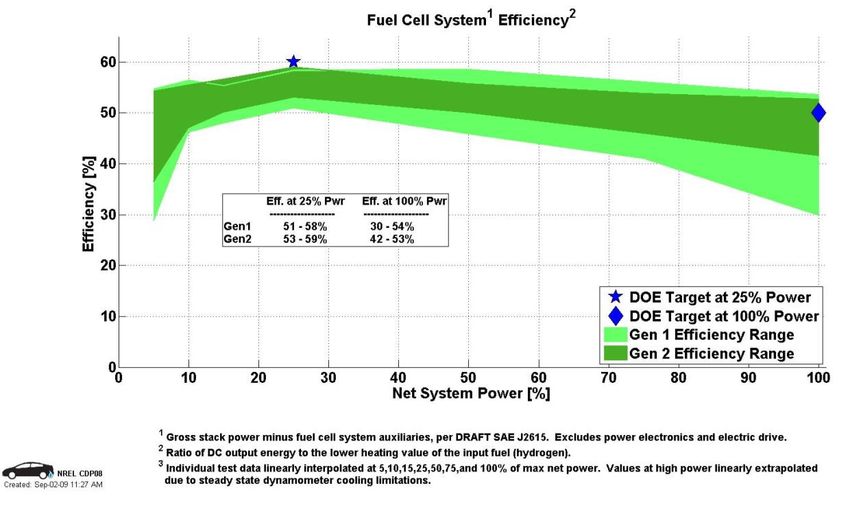
Contents
List of Figures ................................................................................................................................................. v
List of Tables ................................................................................................................................................ vii
Acknowledgments ........................................................................................................................................ ix
Acronyms ...................................................................................................................................................... xi
Executive Summary .................................................................................................................................... xiii
1      Introduction ........................................................................................................................................... 1
       1.1       Study Purpose.............................................................................................................................. 1
       1.2       Scope ........................................................................................................................................... 1
       1.3       Report Organization .................................................................................................................... 2
2      Industry Overview .................................................................................................................................. 2
       2.1       Medium and Heavy-Duty Vehicle Industry Characterization ...................................................... 2
       2.2       Growth of Electrification in the Medium and Heavy-Duty Vehicle Sector ................................. 4
       2.3       Summary of Available Electrified Commercial Vehicle Medium and Heavy-Duty
                 Vehicle Electrification Inventory ................................................................................................. 5
3      Medium- and Heavy-Duty Vehicle Hybrid and Electric Architectures .................................................10
       3.1       48 V Mild Hybrids ......................................................................................................................12
       3.2       High Voltage Full Hybrids, including Plug-In Hybrid Electric Vehicles.......................................13
       3.3       Fuel Cell Hybrids ........................................................................................................................15
       3.4       Battery-Only Electric..................................................................................................................16
       3.5       Distinguishing Aspects of Electrification of Commercial Medium- and Heavy-Duty
                 Vehicles vs. Electric Passenger Cars ..........................................................................................20
4      Important Factors in Design and Market Uptake of Electrified Commercial Vehicles ........................22
       4.1       Total Cost of Ownership ............................................................................................................22
                 4.1.1        Review of total cost of ownership analyses .................................................................23
                 4.1.2        Findings ........................................................................................................................24
       4.2       Duty Cycle Impact on Vehicle Design and Total Cost of Ownership .........................................28
5      Industry Perspectives on Technical Gaps and Barriers to Electrification ............................................34
       5.1       Gaps and Barriers Identified by Technology Users and Customers ..........................................35
       5.2       Gaps and Barriers Identified by Vehicle, Powertrain, and Component Manufacturers ...........36
6      Status of Components for Electrification .............................................................................................37

                                                                                iii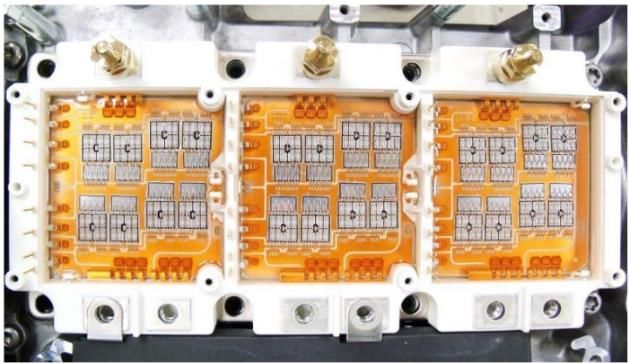
6.1       Introduction ...............................................................................................................................37
       6.2       Electric Drive Overview .............................................................................................................38
                 6.2.1       Major components .......................................................................................................39
                 6.2.2       State of the art for electric power components ..........................................................40
                 6.2.3       Technology gaps in power electronics devices ............................................................41
       6.3       Motors-Inverters .......................................................................................................................43
                 6.3.1       Motors ..........................................................................................................................44
                 6.3.2       Integrated traction drives and e-axles .........................................................................47
       6.4       Electrical Energy Storage ...........................................................................................................48
                 6.4.1       Current state of the art ................................................................................................49
                 6.4.2       Energy storage technology gaps ..................................................................................51
       6.5       Electrified Accessories ...............................................................................................................53
                 6.5.1       State of the art .............................................................................................................54
                 6.5.2       Electrified accessories technology gap ........................................................................55
       6.6       Chargers .....................................................................................................................................56
                 6.6.1       Current state of the art ................................................................................................56
                 6.6.2       Other charging systems ................................................................................................58
                 6.6.3       Charging technology gap ..............................................................................................58
       6.7       Summary of Electrification Component Technology, Knowledge Gaps, and R&D
                 Needs .........................................................................................................................................58
7      Conclusions ..........................................................................................................................................60
References ...................................................................................................................................................62
Appendix A ................................................................................................................................................. A-1

                                                                               iv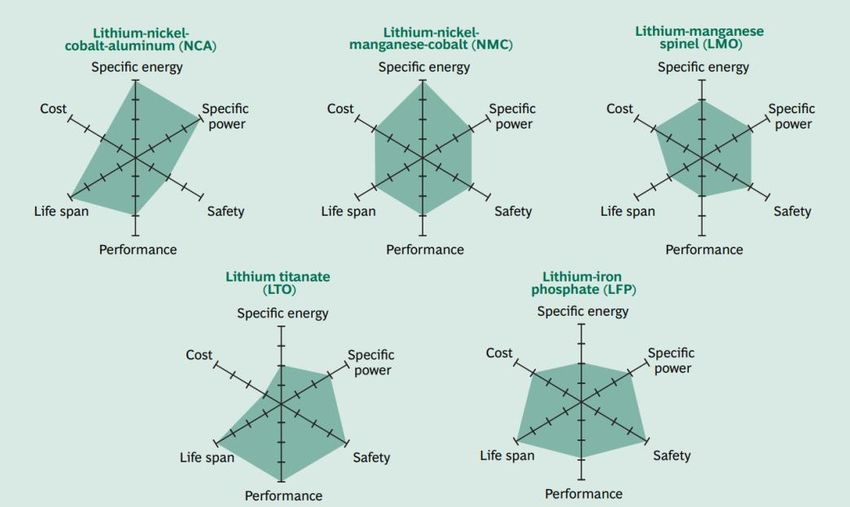
List of Figures
Figure ES1: Energy use by weight class for Class 3 through Class 8 battery electric vehicles..................... xv
Figure ES2: Medium- and heavy-duty vehicle battery capacity by weight class for Class 3 through
Class 8 battery electric vehicles. ..................................................................................................... xv
Figure 1: Commercial vehicle weight classes ................................................................................................ 3
Figure 2: Classifications used for commercial vehicles (medium- and heavy-duty vehicles). ...................... 3
Figure 3: Approximate new sales of commercial vehicles across the weight classes 2b–8. ......................... 4
Figure 4: Reduction in battery costs enhances opportunities for electrified medium- and heavy-
duty vehicles. .................................................................................................................................... 5
Figure 5: Medium- and heavy-duty vehicle electrification inventory. .......................................................... 7
Figure 6: Battery capacity vs. weight class for select medium- and heavy-duty vehicles............................. 7
Figure 7: Inventory of medium- and heavy-duty vehicle battery chemistries. ............................................. 8
Figure 8: Range vs. battery energy for various classes of electrified medium-and heavy-duty
vehicles. ............................................................................................................................................ 8
Figure 10: Peak electric motor power vs. fuel converter power for various electrification
architectures and internal combustion engines. .............................................................................. 9
Figure 11: Trade-offs between common lithium ion chemistries. .............................................................. 10
Figure 12: Schematic representation of the relative electric machine positioning (P i) for different
hybrid electric vehicle architectures. ............................................................................................. 11
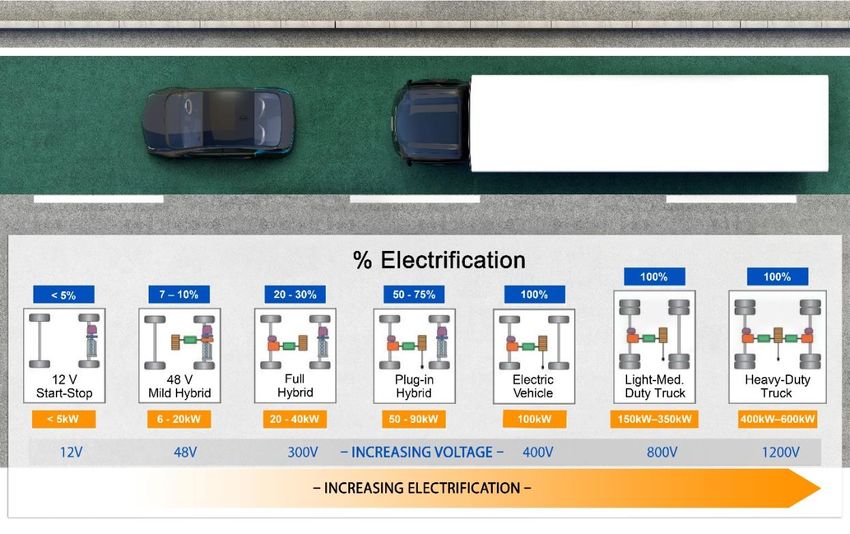
Figure 13: Various electric vehicle powertrain configurations with associated power levels and
voltage requirements. .................................................................................................................... 11
Figure 14: 48 V configuration for Daimler Supertruck 2. ............................................................................ 12
Figure 15: Hybrid electric-combustion powertrain requires deep integration and optimization of
numerous subsystems. ................................................................................................................... 14
Figure 16: Fuel cell efficiencies. ................................................................................................................... 16
Figure 17: Recent and projected electric medium- and heavy-duty vehicles as described by the
International Council on Clean Transportation. ............................................................................. 18
Figure 18: Illustration of trial, prototype, and production electric medium-and heavy-duty
vehicles. .......................................................................................................................................... 18
Figure 19: Energy use by weight class for Class 3 through Class 8 battery electric vehicles ...................... 21
Figure 20: Energy consumption for medium-duty plug-in vehicles compared to conventional
diesel. .............................................................................................................................................. 25
Figure 21: Energy audit of a battery electric delivery truck (34k lb) over a drive cycle derived
from actual vehicle use. .................................................................................................................. 26
Figure 22: Energy audit from simulation of a diesel-engine–powered delivery truck with same
overall configuration as in Figure 21. ............................................................................................. 26
Figure 23: Impact of key contributors to total cost of ownership for electric medium- and heavy-
duty vehicles (MHDVs) vs. diesel-powered MHDVs. ...................................................................... 27
Figure 24: The mass of the batteries for longer range decreases the available payload capacity,
thus increasing the load-specific fuel consumption. ...................................................................... 29
Figure 25: Interdependence of battery pack weight (pounds), range, and load-specific fuel
consumption (LSFC) of an all-electric Class 8 truck. ....................................................................... 29
Figure 26: A 15% improvement in truck efficiency increases range by a similar quantity yet
simultaneously yields a reduction in energy consumed per ton-mile. .......................................... 30
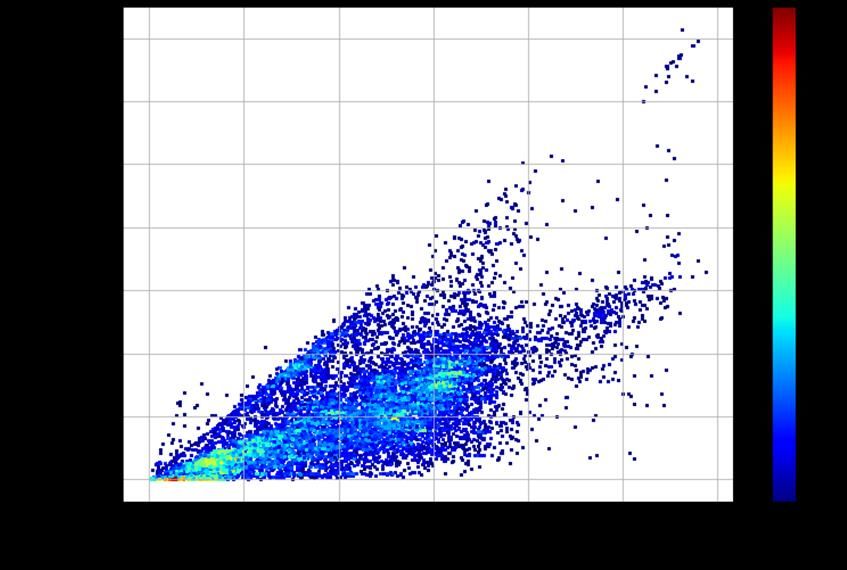
Figure 27: Example of average acceleration and number of stops by speed for tractor-trailer
vehicles. .......................................................................................................................................... 32
Figure 28: Average acceleration and driving speed by distance for tractor-trailer vehicles ...................... 33
v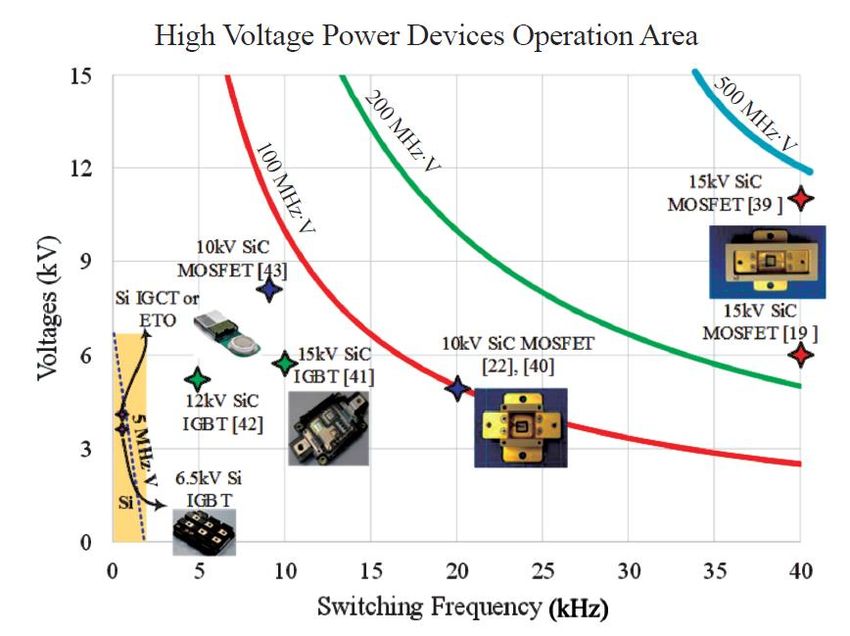
Figure 31: Electric drive system, with off-vehicle battery charger typical of medium- and heavy-
        duty vehicles ................................................................................................................................... 39
Figure 32: 2016 BMW i3 Infineon inverter power module. ........................................................................ 40
Figure 33: 2014 Accord motor-efficiency contour at 300 V inverter bus voltage. ...................................... 40
Figure 34: 2014 Accord motor-efficiency contour at 700 V inverter bus voltage. ...................................... 40
Figure 35: Toyota power control unit with silicon (a) and silicon carbide (b) devices. ............................... 41
Figure 36: The medium-voltage SiC metal-oxide semiconductor field-effect transistor’s
        (MOSFET’s) voltage-frequency capability compared with that of silicon high-power
        devices such as insulated-gate bipolar transistors (IGBTs), integrated-gate commutated
        thyristors IGCTs), and emitter turnoff thyristors (ETOs). ............................................................... 42
Figure 37: Inverter loss improvement with SiC device. ............................................................................... 43
Figure 38: Trade-offs between lithium-ion battery chemistries. ................................................................ 49
Figure 39: Projection of battery pack costs compiled by the International Council on Clean
        Transportation. ............................................................................................................................... 50
Figure 40: Auxiliary load wiring diagram for an electrified vehicle. ............................................................ 54

                                                                            vi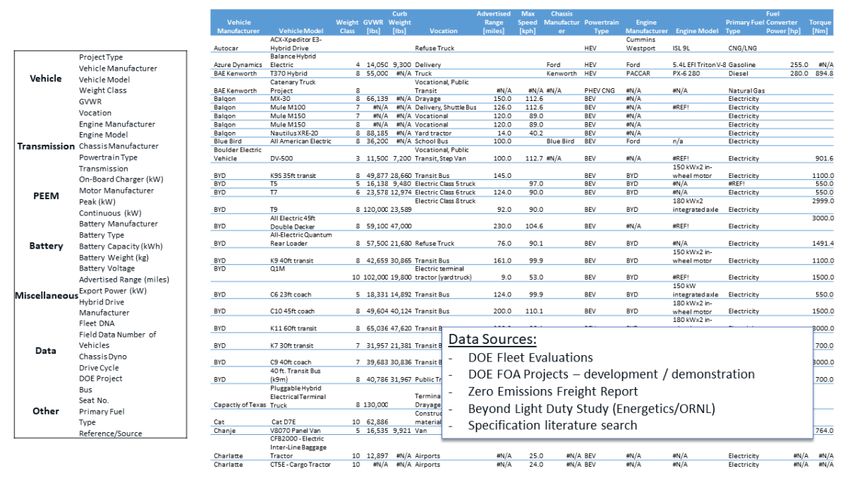
List of Tables
Table 1: Summary of Electrified Medium- and Heavy-Duty Vehicles Included in the Present Study
        Database ........................................................................................................................................... 6
Table 2: Examples of Current, Planned, and Recent Class 3–8 Electrified Commercial Vehicles,
        Including Hybrids and All Electric ................................................................................................... 19
Table 3: Fleet DNA Trip Distance Summary ................................................................................................. 31
Table 4: Technical Targets Set by USDRIVE for Passenger Vehicle Electrification ...................................... 38
Table 5: Inverters Manufactured by Independent Vendors ........................................................................ 44
Table 6: Characteristics of State-of-the-Art Electric Motors ....................................................................... 45
Table 7: Characteristics of Three State-of-the-Art Electric Motors ............................................................. 47
Table 8: Survey of Integrated Traction Drive and E-Axle Manufacturers ................................................... 48
Table 9: Characteristics of Common Chemistries Used in Traction Batteries ............................................. 49
Table 10: Market Assessment of Current Supercapacitors ......................................................................... 51
Table 11: 2017 USDRIVE Roadmap Electrochemical Energy Storage Goals ................................................ 51
Table 12: Characteristics of Commercially Available Auxiliary DC-DC Converters ...................................... 55
Table 13: Current Research in Electric Vehicle Off-Board Chargers ............................................................ 57
Table 14: Current Research in Electric Vehicle Wireless Chargers .............................................................. 57

                                                                             vii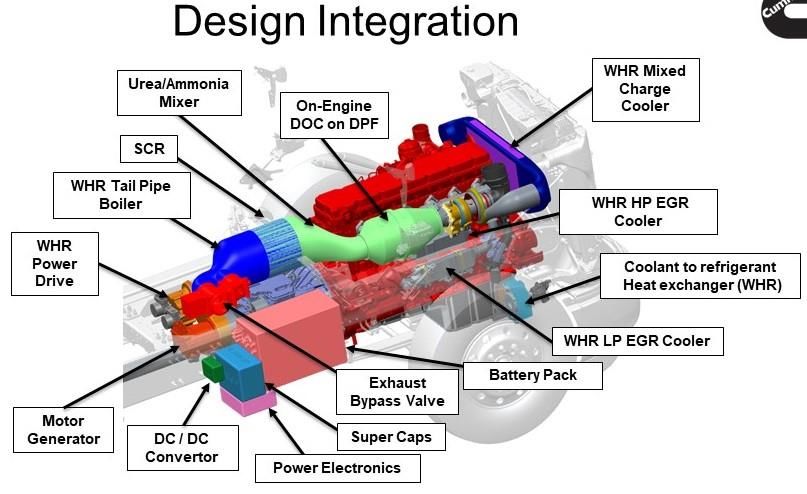
Acknowledgments
The authors gratefully acknowledge the contributions to the electric drive technology review by the
following ORNL student researchers in 2018.

    •   Shenli Zou, The University of Maryland
    •   Tong Wu, Andrew Foothe, Saeed Anwar, and Jared Baxter, The University of Tennessee
    •   Josiah Haruna, Tennessee Tech University
    •   Phani Marthi, Missouri University of Science and Technology
    •   Jingfan Sun, Georgia Institute of Technology

Members of DOE’s EERE team, including David Howell, Steven Boyd, Lee Slezak, Susan Rogers, Samm
Gillard, Jason Marcinkoski, and Michael Berube are gratefully acknowledged for creating this study and
providing review and feedback. Sincere thanks also to Deborah Stevens, VJ Ewing, Jim Kidder, and
Priscilla Henson of ORNL for citation research and editing.

                                                   ix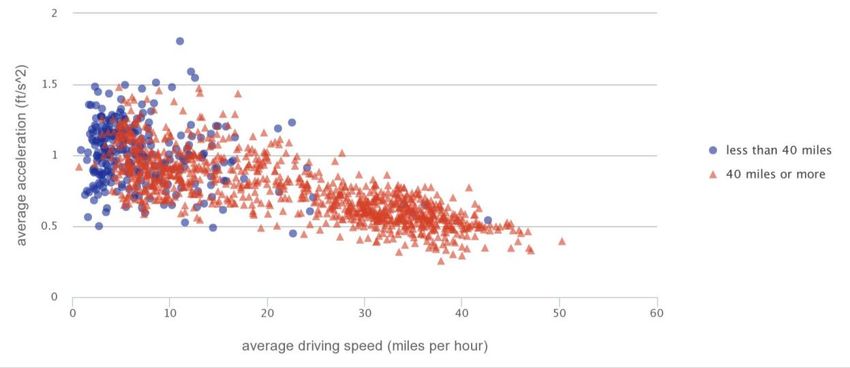
Acronyms

Acronym    Definition
BEV        battery electric vehicle
CAFE       Corporate Average Fuel Economy (regulations)
CNG        compressed natural gas
DC         direct current
DCFC       DC fast charger
DOE        US Department of Energy
EPA        US Environmental Protection Agency
EV         electric vehicle
FC         fast charger
FCEV       fuel cell electric vehicle
GHG        greenhouse gas
GPS        global positioning system
GVW        gross vehicle weight
GVWR       gross vehicle weight rating
HD         heavy duty
HEV        hybrid electric vehicle
HPC        high-performance computing
HRE        heavy rare earth
HV         high voltage
HVAC       heating, ventilating, and air-conditioning
ICCT       International Council on Clean Transportation
ICE        internal combustion engine
IEA        International Energy Agency
IGBT       insulated-gate bipolar transistor
LD         light duty
LDV        light-duty vehicle
LV         low voltage
MD         medium duty
MHDV       medium- and heavy-duty vehicle
MOSFET     metal-oxide semiconductor field-effect transistor
NACFE      North American Council on Freight Efficiency
NMC        lithium nickel manganese cobalt oxide (battery)
NREL       National Renewable Energy Laboratory
OEM        original equipment manufacturer
PEV        plug-in electric vehicle
PHEV       plug-in hybrid electric vehicle
PM         permanent magnet
R&D        research and development
SOC        state of charge

                                       xi
Acronym Definition
TCO total cost of ownership
VMT vehicle miles of travel
WBG wide bandgap
WPT wireless power transfer
XFC extreme fast charging
xiiExecutive Summary
The objective of this assessment was to leverage current medium- and heavy-duty vehicle (MHDV) data
and information to evaluate the state of commercial vehicle electrification technologies, including the
following.
1. Assessment and inventory of current MHDV electrification architectures
2. Identification and assessment of MHDV component technologies
3. Assessment of potential performance and cost drivers
4. Identification of R&D gaps where appropriate R&D and technology would accelerate commercial
vehicle electrification. These gaps include shortfalls in technology, gaps in data, and inadequate
knowledge and understanding.
To inform this study, the National Renewable Energy Laboratory–Oak Ridge National Laboratory team
examined the open literature; conducted workshops; assessed and analyzed data on more than
175 electrified MHDVs, including vehicle and powertrain specifications; and conducted one-on-one
meetings with industry representatives. This systems-level information was concatenated and parsed
with respect to key characteristics such as battery energy, power, and range compared across vehicle
classes. Operational data of many conventional vehicles were also examined to help determine the
requirements on electrified vehicle attributes such as range. Previous studies on the total cost of
ownership of electrified MHDVs were reviewed to determine where improvements in technologies
(efficiency, cost, maintenance) were needed to accelerate adoption. The team also assessed the state of
the art in electric drivetrains for component specifications and challenges for the commercial vehicle
sector, including electric machines, power electronics, and off-board high-power charging systems
(extreme fast charging and beyond). The goal of this analysis was to identify the barriers to widespread
adoption of commercial vehicle electrification technologies and prioritize the research and development
gaps that need to be overcome to accelerate significant market penetration of these technologies.
MHDVs, defined as Class 2b–8, are critical to the US economy. Trucking accounts for more than 67% of
freight movement by weight in the United States [1], with a revenue of $738.9B, 81.5% of the nation’s
total freight cost [2]. MHDVs are the second largest transportation energy-use sector, accounting for
22.7% of the total [3]. This is expected to grow to 24.7% of the total transportation energy consumption
by 2050 while light-duty (LD) vehicle energy use is expected to fall 29% to 41.3% of the total in the same
time frame. MHDVs represent about 4.6% of the total US vehicle fleet [4] and thus a large energy and
economic improvement opportunity per vehicle. Because of the economic importance of freight costs,
the growing energy use of MHDVs, and the large per vehicle opportunity, addressing MHDVs is
important to helping the United States attain energy independence and helping the economy.
Electrification is a promising technology pathway for MHDVs because it has the potential to provide
simultaneous gains in freight efficiency, emissions reductions, and performance improvements.
Additionally, it provides energy source diversification, allowing energy production methods to change
with technological and economic drivers. Hybrid electric vehicle (HEV) and plug-in electric vehicle (PEV)
xiiipassenger cars have started to have market success; however, commercial-grade MHDV technology will
require considerable R&D before broader market adoption can be achieved. Several demonstrations and
market deployments for commercial PEVs have occurred, with mostly small volumes. Many of the
vehicle technology providers have been small companies that have limited capability for providing
long-term customer support/maintenance and have not established stable powertrain designs or
consistent supply chains. Developers of many of the early electric vehicle powertrains have attempted
to integrate “off-the-shelf” or “best available” battery systems, motors, and power electronics as
opposed to purpose-built or optimized systems. Areas where MHDV electrification has made market
progress are specialized applications such as transit buses, where other factors such as emissions and
noise are also important and federal or state funding is available to incentivize zero-emissions
technology. While technology advancement in LD vehicles can often benefit the MHDV market, key
differences have resulted in R&D gaps that are limiting the electrification of commercial vehicles.
These key differences include the following.
The life expectancy of a heavy-duty (HD) vehicle can exceed 1 million miles, and the average age
of commercial trucks on the road is about 14 years. Often these miles are driven over more
demanding duty cycles as defined by the vehicle vocational requirements. Therefore, many
components and systems must be more durable than those intended for LD applications and the
15 years and 300, 000 miles in current industry LD targets.
The power and energy flows in MHDV powertrains far exceed those of their LD counterparts:
roughly twice the peak power, 4 times the peak torque, more than 5 times greater per-mile fuel
consumption, and gross vehicle weights up to 80,000 lb for on-road (and higher for off-road). As
shown in Figure ES1, PEV MHDV energy use ranges from 500 to 3,200 Wh/mile, while LD PEVs
typically use 250 to 400 Wh/mile.
The larger per-mile energy demands, along with daily driving distances, for MHDVs require
much larger batteries. Today’s MHDV PEV batteries have as much as 660 kWh, shown in
Figure ES2, while near future concepts may exceed 1,200 kWh (100 kWh currently is about the
largest battery pack found in LD vehicles). Fast charging these batteries will require substantially
more power (greater than a megawatt) compared to current extreme fast charging for LD
vehicles (350 kW).
The MHDV market comprises a vastly diverse set of vocational uses compared to the passenger
car market. MHDV purchases and market expansion will be driven largely by total cost of
ownership (TCO). These vehicles must address a broad range of duty cycles and use cases. This
often leads them to have highly customized options such as power takeoff, refrigeration,
job-site power needs, and hotel/idle loads , which limits standardization. This also leads to a
higher prioritization on reliability and lifetime cost than for LD vehicles.
With high annual vehicle miles traveled in the MHDV sector and high fuel consumption per mile,
fuel costs will typically exceed the purchase price of the vehicle in a few years. This places high
priority on the overall vehicle efficiency and the efficiency of electrical components, even with
electric vehicles, to accrue fuel savings that will pay back the very high cost of energy storage in
2–3 years.
xivMHDVs are often located at centralized depots where the combined charging of PEVs may cause
challenges with facility charging infrastructure and utility rate impacts such as demand charges.
The annual sales volume of MHDV trucks is about a twentieth that of cars, and they can be
purchased with options essentially specific to every vehicle. The resulting dilemma is that the
volumes are low and the applications can be very diverse, resulting in the problem of how to
cost effectively provide solutions across such diverse vocations, duty cycles, and missions.
Figure ES1: Energy use by weight class for Class 3 through Class 8 battery electric vehicles.
Figure ES2: Medium- and heavy-duty vehicle battery capacity by weight class for Class 3 through Class 8 battery electric
vehicles.
Based on these differences, this study found the following important MHDV technology and knowledge
gaps that need to be addressed.
Research is needed to better understand how to apply electrified vehicle attributes to the broad
range of on-road and off-road vehicle duty cycles and vocations. Larger and more
comprehensive high speed (1 Hz or faster) data are required to get complete understanding of
the diverse duty cycles and vocations in the MHDV sector and provide inputs to powertrain
development. Advanced data analytics methods are then needed to organize and extract critical
insights from these large data sets for design and operating algorithms.
Given a robust database of operational requirements, there is a need expressed by industry to
develop and apply simulation and optimization tools to enable development of electrified
xvvehicle drivetrains across multiple applications for scalability in an accelerated manner.
Increased fidelity at the system level is now possible in today’s high-performance computing
systems instead of only at the component level. Optimization tools can be developed and
augmented with hardware-in-the-loop data, validation, and codevelopment to provide a
system-level understanding.
Technology development targets specific to MHDV requirements are needed for MHDV systems
and components. An assessment of the vehicle, vocation, infrastructure, and market is needed
to understand R&D priorities for enabling MHDV electrification. New and expanded simulation
and TCO analysis of the performance and costs of electrified vehicles are needed to help set
targets for components.
Development of ruggedized, scalable electrified powertrain components that meet the broad
range of MHDV vocations, duty cycles, and missions is needed. Energy storage (battery)
shortcomings remain a considerable barrier to electrification, with needs in the following areas:
reducing costs, increasing energy density, improving performance at temperature extremes,
achieving battery lifetimes (cycles) commensurate with commercial vehicle TCO requirements,
and developing economical end-of-life solutions. Although additional data are needed, it is
expected that commercial vehicles will more deeply discharge the batteries, which tends to
shorten their life. The reasons for poor reliability seen in previous electric MHDV
demonstrations need to be determined and corrected. More-specific targets and requirements
for MHDV batteries are being assessed in ongoing TCO analyses.
Freight efficiency must be preserved to the extent possible for electrification to make economic
sense, so power and energy density of energy storage systems, motor efficiency, and power
converter performance must be maximized in the MHDV design space. These components must
meet performance and, in particular, durability criteria demanded by the commercial sector.
To enable further market penetration, solutions need to be developed that optimize the
powertrain system and controls for specific duty cycles that would benefit most from
electrification. Methods to improve powertrain flexibility to achieve high efficiency at a wide
range of operations are similarly needed. Defining new approaches to the missions that these
vehicles must deliver from an energy efficient operations perspective could further exploit the
electrification benefits and unlock systems-level efficiencies that might otherwise be lost due to
conventional approaches. In addition, automation and connectivity are key focuses that could
enable maximization of the benefits of electrification through optimized fleet control at the
transportation systems level.
Development of charging and infrastructure capable of providing fast charging for the larger
batteries of MHDVs is needed. For the MHDV segment, the power levels necessary to rapidly
recharge large capacity energy storage far exceed the current focus of LD extreme fast charging
levels. Because of this, the need for reliable off-board charging system components (thermal
considerations, very high bus voltages, etc.) is a critical gap to widespread adoption of
electrification across the MHDV space.
Impacts to the electric grid of even small increases in electrification of commercial fleets need to
be understood and research into possible solutions identified. Business models and technology
xvisolutions that avoid multipliers or surcharges on electricity price are needed (or else TCO will
favor combustion vehicles).
Especially for HEVs, tighter integration of electrified components with conventional MHDV
powertrain architectures is also needed. Novel approaches to optimizing integration of power
electronics and motors into existing MHDV powertrains will allow reduction of weight and losses
due to reduced cabling needs (especially important for the six- and nine-phase electric machines
prevalent in this space), additional functionality of electrified components (increased use for
auxiliary systems required across many vocations), and multiple uses for single-power converter
systems (combined inverter and charging operation). Innovative cofunction of electric and
combustion processes has intriguing potential.
Efficient electric accessories are needed to reduce their impact on vehicle energy consumption.
Data are needed to develop innovative technologies and strategies to reduce the impacts of
accessory loads, including HVAC; component thermal management; hoteling; and job-site
power.
Efficiency improvements are needed even for pure battery electric vehicles in that energy cost-
savings are the primary means to recoup the high cost of batteries for overall affordable TCO.
There are opportunities for efficiency gains within the electric drive system as well as at the
vehicle level where constraints of engine-based configurations do not exist.
xvii1 Introduction
1.1 Study Purpose
The objective of this assessment was to evaluate the status of commercial vehicle electrification
technologies and identify the gaps and barriers that inhibit further development and deployment. More
specifically, this report includes
1. Assessment of current medium- and heavy-duty vehicle (MHDV) electrification architectures
2. Identification and assessment of MHDV component technologies
3. Assessment of the potential performance and cost challenges that impact commercial
acceptance
4. Identification of appropriate R&D gaps that need to be resolved for commercial vehicle
electrification
The resources for this assessment of technology gaps and barriers to electrified commercial vehicles
included the following:
• The open literature.
• Knowledge within the US Department of Energy (DOE) laboratories from R&D conducted for
many years on components for electrified passenger vehicles.
• Extensive data collected from vehicles in fleet operation during various projects over the last
11 years.
• Input from industry in one-on-one visits to Cummins, Allison Transmission, Navistar, Eaton, and
others.
• Focused workshops with participation by broad stakeholder representation. Two workshops
were conducted during the Green Truck Summit meeting in March 2019.
• Industry and laboratory technical planning activities pertaining to the 21st Century Truck
Partnership. (web and in-person meetings.)
1.2 Scope
This report assesses the status of electrification in commercial vehicle markets, covering weight classes
2b through 8 as defined in Section 2.1. However, more emphasis has been placed on Class 3 and higher
weight classes in part due to data availability. Technologies within the report scope cover a broad
spectrum from mild hybridization to full battery electric and fuel cell vehicles. These electrification
architectures are described in Section 3.
11.3 Report Organization
This report is organized as follows. Section 2 provides an overview of the commercial vehicle industry
and includes an inventory of electrified vehicle models. Section 3 reviews electrified vehicle
architectures. Section 4 discusses the importance of total cost of ownership (TCO) and duty cycles in the
design and market uptake of electrified solutions for the MHDV market. Section 5 summarizes industry
perspectives on barriers to electrification. Section 6 provides a detailed discussion of the status of
electrification component technologies. Finally, Section 7 presents study findings and conclusions and
recommendations addressing the technology gaps.
2 Industry Overview
This section reviews the freight industry and its importance to the US economy, along with the various
truck classifications used by the industry and regulatory agencies. The emergence of electrified MHDVs
is covered, and an inventory of recent and current electrified vehicles is introduced.
2.1 Medium and Heavy-Duty Vehicle Industry Characterization
MHDVs, including trucks and buses, are the fastest growing fuel users and greenhouse gas (GHG)
producers in the United States and, as such, are an important factor in energy independence and
security. Affordable truck freight movement also is essential for the nation’s economy. Trucks carry
more than 70% of the nation’s freight on a tonnage basis and 73% of freight on a value basis [5].
Virtually all goods consumed in the United States are shipped by truck for at least part of their trip to the
consumer. There are more than 500,000 trucking companies in the United States with more than 13
million trucks on the road of which 2,900,000 are tractor trailers [6]. Of these trucking companies, 80%
are regarded as small businesses, with six or fewer trucks.1 While MHDVs account for 5% of the US
vehicle population, they consume disproportionately more fuel than light-duty vehicles (LDVs) and
account for more than 27% of on-road fuel use.
Separate regulations govern fuel consumption and emissions in MHDVs at both the vehicle and engine
levels. Whereas passenger vehicles and light-duty (LD) trucks have been subject to Corporate Average
Fuel Economy (CAFE) regulations for decades [7], MHDVs were not subject to fuel consumption and
GHG regulations until 2011 [8]. Regulations at the vehicle level for MHDVs express standards in terms of
fuel used or GHG produced per payload-distance (i.e. gallons per 1,000 ton-miles or grams CO2 per
ton-mile) in contrast to the simpler miles per gallon of the CAFE standards. In the context of fuel
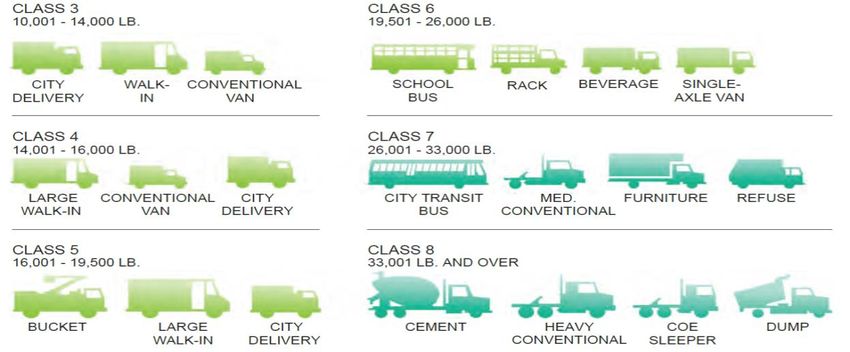
consumption and emissions, trucks are classified by gross vehicle weight rating (GVWR), shown in Figure
1. Figure 2 illustrates some typical vehicle types within each weight class. Further information that
distinguishes LDVs from MHDVs and US Environmental Protection Agency (EPA) emissions classifications
is available at the Alternative Fuels Data Center [9].
1Analysis of IHS 2013 vehicle registration data and Federal Motor Carrier Safety Administration 2019 carrier
registration data.
2Class 2b 3 4 5 6 7 8
GVWR (lb) 8,501– 10,001– 14,001– 16,001– 19,501– 26,001– >33,000
10,000 14,000 16,000 19,500 26,000 33,000
Figure 1: Commercial vehicle weight classes (GVWR = gross vehicle weight rating).
Class 2b, 8501–10,000 lb
Figure 2: Classifications used for commercial vehicles (medium- and heavy-duty vehicles). (MED = Medium; COE = Cab Over
Engine.) Source: National Academies of Sciences, Engineering, and Medicine. 2019. Reducing Fuel Consumption and
Greenhouse Gas Emissions of Medium- and Heavy-Duty Vehicles, Phase Two: Final Report. Washington, DC: The National
Academies Press; available at https://doi.org/10.17226/25542.
Class 2b is the part of Class 2 vehicles that are regulated as commercial vehicles, consisting of large
pickup trucks and vans that are primarily used in commerce and have a GVWR of 8,501–10,000 pounds.
Class 3–8 trucks make up less than 5% of the total number of US on-road vehicles but represent a
quarter of the annual vehicle fuel use. Commercial trucks in classes 3 through 8 used a total of about 45
billion gallons of fuel in 2016 [10]. Fuel consumption (meaning gallons per year) data specific to each
category from 2b to 8 have not been updated in many years and represent a gap in the understanding of
the sector. Fuel use data are aggregated for Class 3–6 and Class 7–8 [10]. MHDV total fuel consumption
is dominated by Class 8 tractor trailers, which have the most annual vehicle miles of travel (VMT). Class
8 tractor trailer fuel consumption is followed by Class 2b because of the high numbers of relatively small
Class 2b trucks and vans. Gasoline and diesel fuel account for well over 90% of MHDV fuel use. About
half of Class 2b new vehicles are gasoline; the other half are diesel [11]. Natural gas is also finding use in
Class 6–8 because, like electricity, it is cheaper on an energy basis than other fossil fuels.
3The US market for new Class 3–8 MHDVs is relatively small, with sales in 2017 of about 732,000
compared to 16.8 million LDVs. While Toyota sold 387,000 Camrys in that year, sales of Class 7 and 8
tractor trailers by all manufacturers totaled only about 170,000. Sales of “vocational” vehicles, spread
across all classes 3 through 8, all manufacturers, and the myriad of body styles illustrated in Figure 2,
totaled 294,000, with pickup trucks and vans making up the remainder. The approximate distribution of
newly purchased vehicles across weight classes is shown in Figure 3.
Figure 3: Approximate new sales of commercial vehicles across the weight classes 2b–8. Source: N. Lutsey, “Regulatory
considerations for advancing commercial pickup and van efficiency technology in the United States,” International Council on
Clean Transportation (ICCT), White Paper, April 2015.
Similarly to the United States, MHDVs contribute disproportionally to emissions globally. Moultak et al.
[12] summarized this perspective as follows:
“Freight trucks, which primarily operate on diesel (and sometimes gasoline or natural gas), account for a
large and growing share of local pollutant and greenhouse gas emissions. Despite representing merely 9%
of the global vehicle stock and 17% of the total vehicle miles driven, freight trucks accounted for
approximately 39% of the life-cycle road vehicle greenhouse gas emissions, with the share being even
higher for other pollutants….”
2.2 Growth of Electrification in the Medium and Heavy-Duty Vehicle Sector
Electrification of MHDV powertrains has long been recognized as a potential path to reduced fuel costs
and emissions for the nation’s freight movement, yet development of a sustainable market for
electrified commercial vehicles has lagged well behind LDVs. Electric delivery trucks were in use by the
United Parcel Service in the 1930s. Over the last 10 years, battery performance has improved and
battery costs have been reduced substantially, making electrification of MHDVs more attractive (Figure
4). Industry feedback has indicated that these low costs have not yet been realized in the MHDV sector
due to low volume purchases and customized pack specifications. Electrified commercial vehicles are
being reevaluated and are finding on-road applications in freight, package delivery, and buses. Heavy-
duty (HD) off-road applications such as cargo handling equipment at seaports are being developed and
demonstrated. Financial incentives such as the State of California’s Hybrid and Zero and Bus Voucher
Incentive Program are often available for vehicle conversions and purchases.
4Figure 4: Reduction in battery costs enhances opportunities for electrified medium- and heavy-duty vehicles. Source: David
Howell, “Electrochemical Energy Storage R&D Overview,” US Department of Energy (DOE) Vehicle Technologies Office,
Annual Merit Review, 2017; available at https://www.energy.gov/sites/prod/files/2017/06/f34/es000_howell_2017_o.pdf.
Globally, buses are the largest segment of electric commercial vehicles to date, with large numbers in
China and Europe. The American Public Transit Association reported that in 2017, US transit fleets
included 9,821 electrified buses of which 538 were battery electric vehicles (BEVs—i.e., battery only).
Various incentives and regulations have stimulated this market. In 2018, the National Academies
reviewed the status of battery electric buses in the United States, including a survey of 21 transit
agencies experienced with electric bus deployment. They found that half of the agencies had
implemented electric vehicles (EVs) due to board direction, environmental regulations, and
sustainability programs and that 39% purchased the buses through federal or state grant opportunities
such as the Federal Transit Administration Transit Investments for Greenhouse Gas and Energy
Reduction program. The agencies used a variety of charging strategies, including installation of both
depot and on-route charging infrastructures. While 33% of the agencies did not make any adjustments
to operations, 60% had to adjust schedules, 40% adjusted layover times to accommodate charging, 20%
used block scheduling, and 13% adjusted the number of buses serving a route. One agency reported
that, through the use of on-route charging, it was able to operate 24/7 without returning to the depot to
charge. However, the lack of depot charging infrastructure presents a significant risk in the event of
service interruption at one charging location [13]. A study of electrification of buses in New York City
found a notable monetary value from reducing health issues in the population among other advantages
over diesel-powered buses [14].
Surveys of the growth in electrified MHDVs have reported 18–20 MHDV models in the
commercialization process in 2018–2019, compared to 5–6 just 2 years ago [15, 16].
2.3 Summary of Available Electrified Commercial Vehicle
Medium and Heavy-Duty Vehicle Electrification Inventory
Except for transit buses, the market for electrified commercial vehicles is very small, but a variety of
electrified commercial vehicles that range from mild hybrid 48 V vehicles to Class 8 tractor trailer full
BEVs have been developed and demonstrated and have achieved limited commercial sales. A recent
5survey by Synthesis Partners on behalf of DOE found the following population of electrified vehicles on
the road in the United States [17].
• 11,909 Class 3–8 trucks
• 13,826 buses
• 3187 upfitted vehicles
To better understand the small but growing MHDV electrification market, vehicle designs, and vehicle
performance, an inventory of current and recent commercial EVs was created by NREL in this study.
There are currently 178 vehicle models in the inventory, with 161 Class 3 or above. A summary of the
Class 3–8a MHDVs found in this study through March 2019 is shown in Table 1 (for the entire inventory
of electrified MHDVs, see https://app.box.com/s/04h4jqs50w88f5ziwvmf4o2sxbxpzhzg).
Table 1: Summary of Electrified Medium- and Heavy-Duty Vehicles Included in
the Present Study Database
Total Battery Capacity Peak EM Power Fuel Converter
Number of
Weight Number of (kWh) (kW) Power [kW]
Technology Vehicle
Class Vehicle
Models
Models Low High Low High Low High
BEV 7 48.5 99.0 70.0 160.0
3 8
PHEV 1 14.0 14.0 92.0 92.0 138.0 138.0
BEV 10 61.0 136.0 20.0 188.0
HEV 3 1.8 60.0 44.0 100.0 156.6 190.2
4 15
FCEV 1 28.0 28.0 120.0 120.0 30.0 30.0
ICE 1 149.1 149.1
BEV 12 62.0 135.0 91.0 200.0
HEV 3 99.0 99.0 36.0 200.0 120.0 156.6
5 18
EREV 2 60.0 60.0 200.0 343.0 25.0 50.0
ICE 1 149.1 149.1
BEV 10 99.0 200.0 134.0 250.0
HEV 6 1.8 28.0 36.0 120.0 80.0 231.2
6 21 FCEV 2 28.4 28.4 200.0 200.0 30.0 30.0
PHEV 1 74.0 74.0 200.0 200.0 179.5 179.5
ICE 2 205.1 223.0
BEV 10 120.0 352.0 103.0 360.0
7 15 HEV 4 1.8 28.0 44.0 71.0 186.4 242.4
ICE 1 238.6 238.6
BEV 45 88.0 1000.0 103.0 770.0
HEV 8 1.8 28.0 44.0 265.0 149.1 227.4
8 68 FCEV 7 12.0 700.0 85.0 746.0 29.8 100.0
PHEV 5 80.0 175.0 168.0 300.0 29.8 238.6
ICE 3 208.8 452.9
Off-Road BEV 19 10.8 209.0 3.0 180.0
Utility 22 HEV 2 #N/A #N/A 171.0 198.0 167.8 201.3
Vehicles FCEV 1 22.0 22.0 240.0 240.0 30.0 30.0
6For each of these vehicles a wide range of metrics was collected when available. These included weight
class, GVWR, powertrain type, electric machine power, battery size, battery type, advertised range, and
others shown in Figure 5. Note that this inventory includes vehicles that were introduced and used in
commerce going back to about 2012, so some are no longer available.
Figure 5: Medium- and heavy-duty vehicle electrification inventory. Example characteristics and spreadsheet view.
To understand the trends in battery size, battery capacity was plotted by weight class (Figure 6). Note
that data from the literature (blue circles) and from DOE-funded fleet evaluations (orange squares) have
been included. This shows both the trend of increasing battery size with vehicle weight class and the
large scatter in battery capacity found in the heavier vehicles, particularly Class 8. This variation may be
due to range design decisions, duty cycle variations, and a distribution of vehicle efficiencies.
Figure 6: Battery capacity vs. weight class for select medium- and heavy-duty vehicles.
7For each electrified vehicle in the inventory, battery chemistry was determined when possible. Figure 7
shows a box plot of the battery size vs. chemistry. Note that the one data point for NMC is an estimated
battery size for the Tesla truck concept.
Figure 7: Inventory of medium- and heavy-duty vehicle battery chemistries. “Li-ion” includes batteries whose specific
chemistries were not available. Source: NREL.
To better understand the vehicle efficiencies, the vehicle range was plotted against the battery size
(Figure 8). The slope of this line is the energy use per mile for each weight class. For freight vehicles, the
preferred figure of merit or metric for efficiency is the freight efficiency expressed in energy
consumption per payload-mile. Fuel consumption standards for today’s freight vehicles are expressed in
gallons per 1,000 ton-miles, where the payload is the mass in tons. As electrified vehicles are further
studied and characterized, their payloads in mass or perhaps volume of freight carried will need to be
captured.
Figure 8: Range vs. battery energy for various classes of electrified medium-and heavy-duty vehicles.
8Another way to look at the data is to plot the energy use (in kilowatt-hours per mile) against the vehicle
weight class, as shown in Figure 9, which includes data from the literature and National Renewable
Energy Laboratory (NREL) fleet evaluations. Good agreement can be seen between the measurements
and inventory data, with measurements falling well within the inventory ranges.
Figure 9: Energy use vs. weight class for medium-and heavy-duty vehicles. Source: NREL.
Expanding beyond BEVs, it is informative to plot the peak electric motor power against the fuel
converter power for the full range of electrification architectures [BEVs, extended range electric
vehicles, plug-in hybrid electric vehicles (PHEVs), fuel-cell electric vehicles (FCEVs), HEVs] as shown in
Figure 10. This shows a spectrum of trade-offs in going from full electric to full conventional.
Figure 10: Peak electric motor power vs. fuel converter power for various electrification architectures and internal
combustion engines. (BEV = battery electric vehicle, EREV = extended range electric vehicle, PHEV = plug-in hybrid electric
vehicle, FCEV = fuel-cell electric vehicle, HEV = hybrid electric vehicle, and ICE = internal combustion engine.) Source: US
Department of Energy.
Additional plots and the full database [18] may be found at
https://app.box.com/s/04h4jqs50w88f5ziwvmf4o2sxbxpzhzg.
93 Medium- and Heavy-Duty Vehicle Hybrid and Electric Architectures
Given progress in reducing the cost of batteries for LDVs, along with market and regulatory drivers,
electrification of the MHDV sector provides an opportunity to increase economic competitiveness and
energy security while reducing environmental impact. However, the wide range of commercial vehicle
operating weights, vocations, and duty cycles suggests that there may be no single solution to MHDV
electrification. The following sections provide a summary of commercial vehicle electrified architectures:
micro- or mild-HEV, full HEV, PHEV, FCEV, and BEV.
The various architectures of electrified vehicles incorporate different battery chemistries depending on
trade-offs in duty cycle requirements, power density, energy density, safety, and cost. This variation can
be seen in Figure 7, and Figure 11 shows a high-level overview of some of these trade-offs between
lithium-ion chemistries.
(a) (b)
Figure 11: Trade-offs between common lithium ion chemistries. Image (a) shows Li-ion battery performance based on various
cathode materials; (b) shows performance based on lithium titanate (LTO) anode material. (LCO = lithium cobalt oxide,
NCA = lithium nickel cobalt aluminum oxide, NMC = lithium nickel manganese cobalt oxide, LMO = lithium manganese oxide,
and LFP = lithium iron phosphate.) Source: Ana-Irina Stan et al., “Lithium Ion Battery Chemistries from Renewable Energy
Storage to Automotive and Back-up Power Applications - An Overview,” IEEE Conference Paper, DOI:
10.1109/OPTIM.2014.6850936. Used with the gracious permission of IEEE.
Simplified diagrams of powertrain architectures have been described in many literature sources, with
examples shown in Figure 12 and Figure 13.
10Figure 12: Schematic representation of the relative electric machine positioning (Pi) for different hybrid electric vehicle
architectures. Source: S. Lee, J. Cherry, M. Safoutin, A. Neam, J. McDonald, and K. Newman, “Modeling and Controls
Development of 48 V Mild Hybrid Electric Vehicles,” presented at the WCX World Congress Experience, 2018, SAE Technical
Paper2018-01–0413; available at https://www.epa.gov/sites/production/files/2018-10/documents/sae-paper-2018-01-
0413.pdf.
Figure 13: Various electric vehicle powertrain configurations with associated power levels and voltage requirements.
113.1 48 V Mild Hybrids
The 48 V micro- or mild-hybrid systems are among the fastest growing technologies for improving fuel
efficiency in passenger vehicles, with limited applications in commercial vehicles. Mild-hybrid
powertrains include a small electric drive and energy storage combined with a transmission and internal
combustion engine (ICE). These systems are capable of limited low speed all electric operation,
temporary boost, limited accessory load during engine-off operations and limited brake regeneration.
This powertrain category also includes both micro-hybrids, which only provide stop-start functionality,
and electric power takeoff systems that electrify the power takeoff functionality of MHDVs.
Mild-hybrid technology can be applied to medium-duty (MD) and HD trucks and buses, Class 2b through
Class 8, but only a limited number of applications have been deployed in the US market.
The AVID 48 V mild-hybrid [19] is an example of a mild-hybrid delivery truck developed for the European
market. It has a motor-generator connected to the engine for regenerative braking and engine torque
augmentation.
The AVID system electrifies power steering, cooling fans, and the air compressor. For LDVs, 48 V systems
are reported as likely the most cost-effective path to increasing miles per gallon by about 15% to meet
fuel economy regulations. Further, 48 V is a low enough electrical potential to avoid the need for added
electrical safety measures, which add cost. The 48 V systems can also be used in augmenting turbo- or
supercharging boosting systems. The 48 V device usually replaces a conventional engine starter motor.
Ricardo recently performed demonstrations of 48 V systems up through HD tractor-trailer rigs [20]. The
Future Truck Committee of the American Trucking Associations’ Technology & Maintenance Council
released a study on 48 V systems for commercial vehicles in 2015 [21]. In vehicles equipped with engine
shutoff, the added power of 48 V systems provided a smoother and more rapid restart. All of the five
teams in DOE’s Supertruck II project are investigating 48 V mild-hybrid technologies. As an example, the
48V system being developed in the Daimler Supertruck 2 is illustrated in Figure 14.
Figure 14: 48 V configuration for Daimler Supertruck 2. Source: Courtesy of Daimler Trucks,
https://www.energy.gov/sites/prod/files/2019/06/f63/ace100_Rotz_2019_o_5.1_10.55am_jl.pdf.
12The 48V motor-generator configuration replaces the customary alternator and can pull power off the
engine in place of the alternator, or use battery power as an e-motor to assist powertrain and drive the
starter, and can enable energy recovery as a mild hybrid.
A potential benefit of MHDV 48 V mild-hybrid systems that needs further consideration and analysis is
augmented acceleration for traffic blending. Traffic congestion can be dominated by a small number of
MHDVs because they cannot match the acceleration of LDVs on the same roads. The ability to boost the
acceleration of MHDVs with mild-hybrid powertrains, even for short periods, conceptually may help
save energy and money by mitigating congestion for all vehicles sharing the road. Additionally, 48 V
systems may also improve vehicle gradeability.
3.2 High Voltage Full Hybrids, including Plug-In Hybrid Electric Vehicles
Full hybrid powertrains include an electric drive system capable of providing all or a substantial fraction
of traction power (at some operating conditions) along with the required energy storage, combined with
a transmission and ICE. These hybrid powertrains support multiple vehicle architectures (series, parallel,
or power split). For at least part of the vehicle acceleration-speed range, they can sustain all vehicle
traction needs on their own without any contribution from the ICE. A substantial portion of braking
energy can be recuperated in the energy storage system.
Examples of current state-of-the-art full hybrids include the following [18]:
Wrightspeed Fulcrum turbine generator (extended range series configuration)
Hino diesel-electric parallel hybrid for Class 5
Ford’s Qualified Vehicle Modifier program includes electric or hybrid vehicles such as by XL
Hybrids, Motiv Power Systems, and Lightning Hybrids (now LightningElectric)
The key subsystems in a full HEV powertrain are illustrated in Figure 15. The complexity of deeply
integrating the system for optimum performance over a diversity of duty cycles is self-evident, and the
need for more powerful, flexible computational tools for integration and shortening (lowering cost) of
the development cycle has been voiced by industry. The optimization may focus on fuel consumption,
emissions, or TCO depending on the operating requirements and regulations. The benefits of the
powertrain complexity are the increase in fuel efficiency and potential reduction in emissions without
the need to locate and plug in to an electricity infrastructure.
13You can also read