SEVERN TIDAL POWER Feasibility Study Conclusions and Summary Report
←
→
Page content transcription
If your browser does not render page correctly, please read the page content below

Department of Energy
 and Climate Change

                           SEVERN TIDAL POWER
                        Feasibility Study Conclusions and Summary Report

OCTOBER 2010
Severn Tidal Power Feasibility Study: Conclusions and Summary Report

Contents
Executive summary .................................................................................................... 4
  How to respond ....................................................................................................... 9

1. Background .......................................................................................................... 10
  The UK’s wave and tidal opportunity ..................................................................... 10
    Tidal Stream ...................................................................................................... 12
    Wave ................................................................................................................. 12
    Tidal range ......................................................................................................... 13
  The Severn ........................................................................................................... 14
  Schemes studied .................................................................................................. 16
  Progress since public consultation ........................................................................ 18

2. The scale of the challenge ................................................................................... 21
  2020 – Renewable Energy Strategy ..................................................................... 21
  2050 ...................................................................................................................... 23
  Is there a role for the Severn? ............................................................................... 24

3. Regional and environmental impacts ................................................................... 28
  Social and economic impacts................................................................................ 32
    Regional jobs and the economy......................................................................... 32
    Infrastructure and services................................................................................. 35
  Environmental impacts .......................................................................................... 37
    Carbon ............................................................................................................... 37
    Flood risk and land drainage.............................................................................. 37
    Migratory and estuarine fish............................................................................... 38
    Waterbirds ......................................................................................................... 39
    Habitat ............................................................................................................... 40
    Other biodiversity and geodiversity .................................................................... 41

4. Legislative framework ........................................................................................... 42
  Habitats and Birds Directive .................................................................................. 42
    Habitats Regulations Assessment ..................................................................... 42
    Compensatory measures ................................................................................... 43
  Water Framework Directive ................................................................................... 45
  European Eel Regulations .................................................................................... 46
  Consenting ............................................................................................................ 46

5. Construction and financing ................................................................................... 48
  Options Definition Report ...................................................................................... 48
  Accuracy of cost estimates ................................................................................... 49
  Supply chain ......................................................................................................... 51
    Materials ............................................................................................................ 51
    Turbines ............................................................................................................. 52
    Vessels .............................................................................................................. 52
    Skills .................................................................................................................. 52
    Conclusions ....................................................................................................... 52
                                                              Page 1 of 75
Grid study.............................................................................................................. 53
   Financing .............................................................................................................. 54
     Appetite for investment ...................................................................................... 54
     Commercial structure conclusions ..................................................................... 54
     Revenue support ............................................................................................... 56

6. Scheme assessment ............................................................................................ 58
  Shoots barrage ..................................................................................................... 61
  Cardiff-Weston barrage ......................................................................................... 61
  Bridgwater Bay lagoon .......................................................................................... 62
  Welsh Grounds lagoon.......................................................................................... 63
  Combinations ........................................................................................................ 63

7.Severn Embryonic Technologies Scheme ............................................................. 65
  Severn Tidal Fence ............................................................................................... 66
  Spectral Marine Energy Converter ........................................................................ 67
  Tidal Bar................................................................................................................ 68
  Next steps ............................................................................................................. 68

8. Next steps for Severn tidal power......................................................................... 70
  Review points ........................................................................................................ 71
  Links with wave and tidal policy ............................................................................ 72
  Further work .......................................................................................................... 72
    Environment results and Environmental Impact Assessment ............................ 72

                                                             Page 2 of 75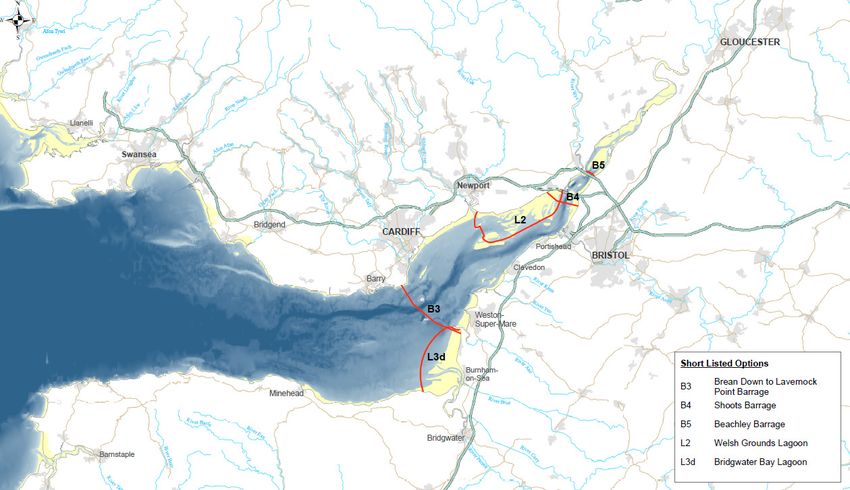
Page 3 of 75

Executive summary
The UK must reduce its carbon dioxide emissions from energy and at the same time enjoy a
secure and affordable supply of energy. We are legally committed to reducing our
greenhouse gas emissions by 80% by 2050 and to meeting 15% of our energy demands from
renewable sources by 2020.

Over the next decade, to achieve our renewable energy goals, the UK must increase the
amount of electricity generated from renewables almost 5-fold on 2009 levels. DECC’s
analysis shows that electricity will play a key role in helping to decarbonise our energy sectors
and that overall electricity demand will increase to 2050.

Following a positive recommendation from the Sustainable Development Commission, a 2-
year cross-Government feasibility study was launched to inform a decision whether or not to
promote a scheme to generate electricity from the tides of the Severn estuary.

The Severn’s enormous tidal range could provide up to 5% of our current electricity
generation from an indigenous renewable source, and bring new employment opportunity
both locally and nationally. But any scheme in the Severn estuary would need to be cost
effective compared to other low-carbon energy alternatives. Furthermore, the Severn and
some of its tributaries are designated as internationally important nature conservation sites.
The study has considered whether Government could support a tidal power project in the
Severn estuary and, if so, on what terms.

There are a number of potential Severn power schemes. 10 have been assessed by the
feasibility study following a Call for Proposals during 2008. Half of these were judged to be
unviable after public consultation in 2009 and were not included in the more detailed – but still
high level – consideration that followed. Over the last year the study has looked at the
remaining 5 potentially feasible scheme options in outline and assessed their costs, benefits
and risks.

The evidence base which is published with this report, the findings of the study, is extensive,
particularly the Strategic Environmental Assessment of Severn tidal power. DECC is grateful
to all those who have contributed to the development of the evidence base.

The key conclusions of the feasibility study are:

   •   a tidal power scheme in the Severn estuary could cost as much as £34billion, and is
       high cost and high risk in comparison to other ways of generating low-carbon
       electricity;

   •   a scheme is unlikely to attract the necessary private investment in current
       circumstances, and would require the public sector to own much of the cost and risk;

   •   over their 120 year lifetime, Severn tidal power schemes could in some circumstances
       play a cost-effective role in meeting our long term energy targets. But in most cases
       other renewables (e.g. wind) and nuclear power represent better value. Moreover as a

                                          Page 4 of 75
Severn scheme could not be constructed in time to contribute to the UK’s 2020
    renewable energy target, the case to build a scheme in the immediate term is weak;

•   the scale and impact of a scheme would be unprecedented in an environmentally
    designated area, and there is significant uncertainty on how the regulatory framework
    would apply to it. The study has considered ways in which to reduce impacts on the
    natural environment and also how to provide compensation for remaining impacts on
    designated features. It is clear that the compensation requirement would be very
    challenging, however defined, and require land change within the Severn estuary and
    probably outside it also;

•   a scheme would produce clearer, calmer waters but the extreme tidal nature of the
    Severn estuary would be fundamentally altered. This means that some habitats
    including saltmarsh and mudflat would be reduced in area, potentially reducing bird
    populations of up to 30 species;

•   fish are likely to be severely affected with local extinctions and population collapses
    predicted for designated fish, including Atlantic salmon and twaite shad. This could
    mean the loss of twaite shad as a breeding species in the UK as 3 of the 4 rivers where
    it breeds run out into the Severn estuary;

•   water levels would also be affected and in order to maintain current flood protection
    levels in the Severn estuary additional flood defences would be
    required; these costs are included in the cost estimates for each scheme. In turn, such
    defences would provide longer-lasting protection to the affected areas;

•   overall a scheme is likely to benefit the regional economy with net value added to the
    economy and jobs created. However these benefits would come at the expense of
    negative impacts on the current ports, fishing and aggregate extraction industries in the
    estuary;

•   the Cardiff-Weston barrage is the largest scheme considered by the study to be
    potentially feasible and has the lowest cost of energy of any of the schemes studied.
    As such it offers the best value for money, despite its high capital cost which the study
    estimated to be £34.3billion including correction for optimism bias. However this option
    would also have the greatest impact on habitats and bird populations and the estuary
    ports;

•   a lagoon across Bridgwater Bay (£17.7bn estimated capital cost) is also considered
    potentially feasible, as is the smaller Shoots barrage (£7bn). The Bridgwater Bay
    lagoon could produce a substantial energy yield and has lower environmental impacts
    than barrage options. It also offers the larger net gains in terms of employment;

•   the Beachley Barrage and Welsh Grounds Lagoon are no longer considered to be
    feasible. The estimated costs of these options have risen substantially on investigation
    over the course of the study;

•   combinations of smaller schemes do not offer cost or energy yield advantages over a
    single larger scheme between Cardiff and Weston. (See map of scheme options in

                                       Page 5 of 75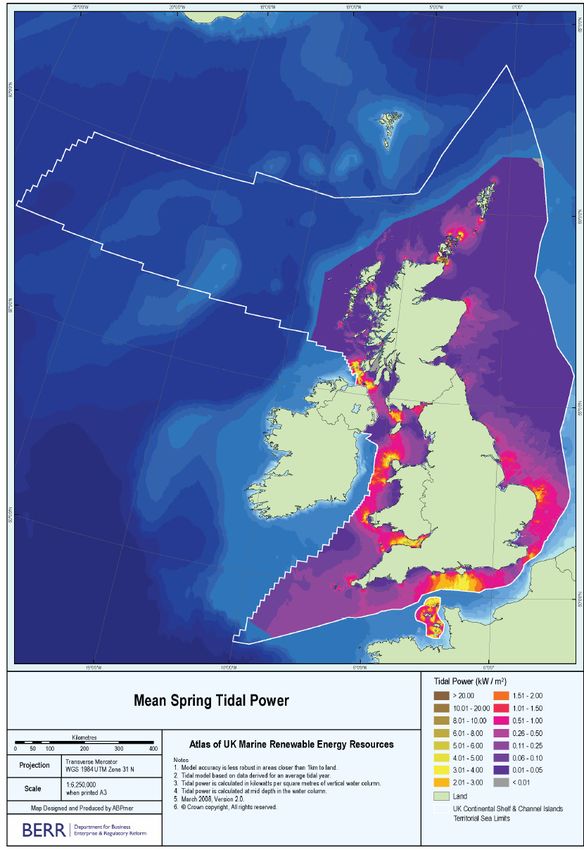
Figure 5      and an explanation of tidal range technology in Chapter 1);

•   in addition, the study funded further work on 3 proposals using innovative and
    immature technologies. Of these, a tidal bar and a spectral marine energy converter
    showed promise for future deployment within the Severn estuary - with potentially
    lower costs and environmental impacts than either lagoons or barrages. However
    these proposals are a long way from technical maturity and have much higher risks
    than the more conventional schemes the study has considered. Much more work
    would be required to develop them to the point where they could be properly assessed.
    Correspondingly, confidence levels on their yields, costs and impacts (including
    environmental impacts) are much lower at this point;

•   many years of further detailed work would be needed to plan, finance, and assess the
    impacts of such a large structure as a Severn power scheme before a case could be
    put forward for planning consent. Even over a period of 2 years this study has only
    been able to consider feasibility and impact at a strategic level. If consented, the
    construction times would be between 4 and 9 years depending on the scheme. In
    addition, any of the schemes would first require new habitats to be created, or species
    re-introduced, to replace those that would be displaced. These habitats and measures
    require time to be effective;

•   the key indicators of scheme options are shown in table 1.

                                      Page 6 of 75
Cardiff-Weston         Shoots            Beachley            Welsh          Bridgwater
                                                                                       Grounds              Bay
                       1
Capital Cost (£bn) (ob        23.2 (34.3)          4.7 (7.0)         3.5 (5.1)         6.8 (10.1)       12.0 (17.7)
inc)
Energy Generated                 15.6                 2.7               1.2                2.6               6.2
         2
(TWh/yr )
Levelised Costs –                 312                335                419               515               349
Investor (10%) -
        3
£/MWh optimism bias
included
Levelised Costs –                 108                121                151               169               126
Social (3.5%),
optimism bias included
           1
NPV (£bn) , optimism              -4.6               -1.7               -2.1              -4.5              -4.8
bias included
Carbon Pay Back (yrs)             2.6                 3.5               2.8                6.1               3.2
C02 Emissions                     73                  13                 7                 12                29
Displaced During
               4
Operation (MT )
               5
Regional GVA , £bn                2.4                 0.9               0.5                1.2               2.3
                              (-0.8 – 6.1)        (0.3 – 2.0)       (0.1 – 1.3)        (0.4 – 2.7)       (0.5 – 4.6)
Regional Net                     840               1,240                940              1,740             3,240
Construction               (-1,600 – 5,500)     (600 – 4,000)      (600 – 2,000)     (600 – 5,000)        (1,000 –
employment (central                                                                                        7,000)
estimate, possible
range in brackets)
Regional Net                     120                  80               -20                -40               290
Operation employment        (-2,000 – 800)       (-100 – 250)      (-150 – 150)       (-100 – 250)      (-250 – 700)
(central estimate,
range in brackets)
Intertidal- habitat Loss       118-163              27-37              21-30             61-82             16 26
      6
(km2 )
 % Intertidal Habitat           40-50%              8-12%              7-9%             19-26%             5-8%
lost
   7
Ha /TWh gen                      1,026               1,222             2,250             2,808               403
Fish                       Reduction in        Possible local     Possible local    Possible local     Reductions in
                           Wye and Usk for     extinction in      extinction in     extinction of      River Usk
                           sea and river       Wye and            Wye, Severn       Atlantic           and Wye sea
                           lampreys, and       Severn for         and Usk for       salmon and         and river
                           eel (also in        salmon, twaite     Atlantic          twaite shad,       lamprey, for
                           Severn).            shad, sea          salmon and        reductions in      eel (also in
                           Possible local      lamprey (Wye       twaite shad,      sea and river      Severn).
                           extinction of       only)              sea and river     lamprey in         Possible local
                           twaite shad and     Reductions for     lamprey (not      Severn, Wye        extinction
                           salmon in           eel in Wye and     Severn),          and Usk.           twaite shad
                           Severn, Wye         Severn, twaite     reductions in                        and Salmon
                           and Usk             shad in Usk        eels                                 in Wye, Usk
                                               and Twyi                                                and Severn
Birds Species-                    30                   17               15                 13                 9
Significant declines
   2
km land drainage                  372                 97                73                 47               243
effected

1
 Taken from Impact Assessment. NPV calculated against ‘technology mix’ counterfactual where Severn output replicated
by one-third coal with CCS, one-third nuclear and one-third offshore wind. Results include Optimism Bias.

                                                   Page 7 of 75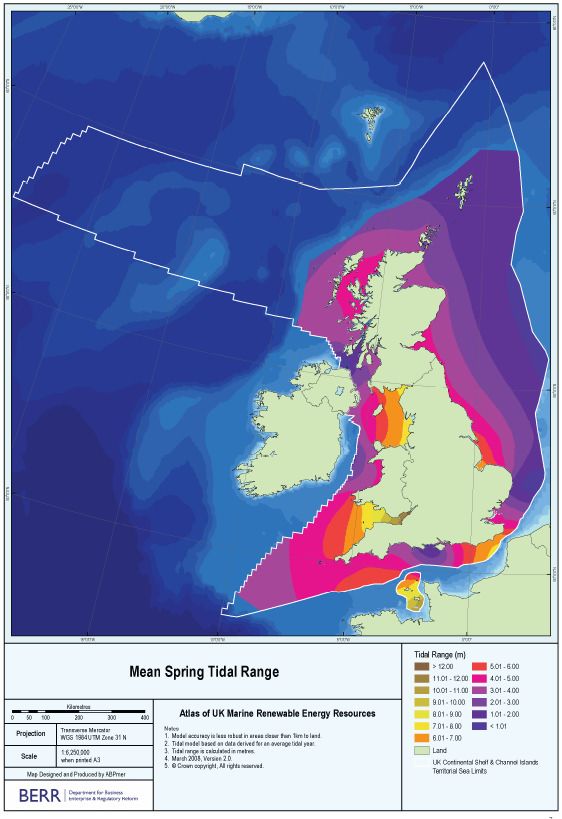
Key   Unit/Acronym        Description
1     Ob                  Optimism bias
2     TWh                 TerraWatt hours
3     MWh                 MegaWatt hours
4     MT                  Million tones
5     GVA                 Gross Value Added
6     Km2                 Square Kilometres
7     Ha                  Hectares

Table 1: The key indicators of scheme options

In the light of these findings the Government does not see a strategic case to bring forward a
Severn tidal power scheme in the immediate term. The costs and risks for the taxpayer and
energy consumer would be excessive compared to other low-carbon energy options.
Furthermore, regulatory barriers create uncertainties that would add to the cost and risk of
construction. The Government believes that other options, such as the expansion of wind
energy, carbon capture and storage and nuclear power without public subsidy, represent a
better deal for taxpayers and consumers at this time.

However, the Government recognises that factors which will determine the feasibility of
Severn tidal power could change over time. There are circumstances in which a future
Government may choose to review the case for Severn tidal power. A list of potential triggers
is set out in Chapter 9, so that it can be considered by the Committee on Climate Change in
the work they will be doing on the amount of renewable energy that is required to meet the
UK’s 2050 greenhouse gas reduction target. It is not expected that a review would take place
before 2015 at the earliest.

The huge scale of a Severn tidal power scheme is unique. The development of tidal range
options elsewhere in the UK is being considered separately by the private sector. While we
hope the study will be useful to other feasibility studies, it should be noted that its conclusions
do not bear on schemes outside the Severn estuary.

                                              Page 8 of 75
How to respond

Given the findings of the feasibility study we are not consulting on the study conclusions. We
will however accept any factual comment or evidence which could enhance the evidence
base.

If you would like to submit factual comments on the summary report and supporting
documents we would be pleased to receive them in the Severn tidal power mailbox
severntidalpower@decc.gsi.gov.uk by 17 January 2011.

Related documents can be found on the Severn tidal power website
www.decc.gov.uk/severntidalpower

These include the key documents listed below, some of which are in abridged form. If you
would like to receive a DVD of the full versions of the reports please email your request to
STPfulldocuments@pbworld.com with your full postal address (one copy per enquirer).

Key documents;

   •   Options Definition Report
   •   Impact Assessment
   •   Phase 2 Regional Economic Impacts Study
   •   Strategic Environmental Assessment (SEA) Environmental Report (including theme
       reports and topic papers)
   •   Report to Inform a Stage 1 (Screening) Habitats Regulations Assessment
   •   Report to Inform a Stage 2 (Appropriate Assessment) Habitat Regulations Assessment
   •   Severn Tidal Commercialisation Assessment
   •   Grid Study
   •   Supply Chain Study
   •   Severn Embryonic Technologies Scheme Reports

                                          Page 9 of 75
1. Background
• The UK has world class wave, tidal stream and tidal range resources.
• The 14 metre tidal range of the Severn estuary is amongst the largest in the
world.
• Following a positive recommendation from the Sustainable Development
Commission, a two-year cross-Government feasibility study was launched to
gather evidence to decide on whether or not to promote a tidal power
scheme in the Severn estuary. A scheme could generate 5% of current UK
electricity consumption.
• To decide whether there is a strategic need for a Severn scheme, its
potential role in reaching renewable energy and climate change targets, and
its cost effectiveness, have been studied.
• The Severn estuary is also an important nature conservation site and careful
consideration of the benefits, consequences, risks and costs is required in
reaching a decision on whether to take forward any development.
• Five schemes have been studied in outline following a public consultation in
early 2009. These include a barrage from near Cardiff to Weston-super-
Mare, two smaller barrages further upstream (Shoots and Beachley) and two
lagoons (Bridgwater Bay on the English shore and Welsh Grounds on the
Welsh shore). A map of schemes can be found at Figure 5 and an
explanation of tidal range technology in chapter 2.
• The study has considered the amount of energy that could be generated by
each of these schemes, their costs, and ways in which any negative impacts
on the environment or region could be reduced. It has looked at:
o how to build a Severn tidal power scheme;
o the commercial risks associated with building and operating a Severn
tidal power scheme;
o how the Severn estuary would change with a Severn tidal power
scheme, including what effect this would have on the people, wildlife
and economy of the surrounding areas (through a Strategic
Environmental Assessment (SEA)); and
o how negative impacts could be mitigated including through provision
of compensatory natural habitat.
• The study (through the Severn Embryonic Technology Scheme) has funded
the development of 3 immature technologies that may have the potential to
be less environmentally damaging.
The UK’s wave and tidal opportunity
The UK is a global leader in the development of both wave and tidal stream technologies and
has a uniquely rich wave and tidal resource. Work carried out by RenewableUK and the
Carbon Trust has suggested the wave and tidal stream resource could meet as much as 15-
20% of the UK’s current electricity demand once established. Estimates for total UK tidal
range potential are that it could meet 10-15% of the UK’s current electricity demand.
Page 10 of 75However, there are uncertainties about the wave and tidal resource not only due to the
immature and developing state of much of the industry where it is difficult to make resource
predictions far into the future with any accuracy but also the uncertainty in the methodologies
used in the resource assessment calculations.
Marine energy is split into three types: tidal stream, wave and tidal range and their resource is
mapped in Figures 1-3 below. Wave and tidal stream technologies (and those innovative tidal
range technologies included within the Severn Embryonic Technologies Scheme) are not yet
developed to a commercially viable scale. The challenge for emerging wave and tidal stream
technologies is to prove that they can generate electricity reliably and economically.
Figure 1: Mean Spring tidal range; Figure 2: Mean Spring tidal stream and Figure 3: Annual
mean significant wave13
Government is helping to meet that challenge and to introduce measures to encourage the
development of marine energy2. In discussions with the industry, the Government provided a
vision for the marine energy sector in the future, and set out the key steps both industry and
the Government will need to take to achieve mainstream deployment of wave and tidal stream
energy around the UK’s coasts by 2020/2030.3 The Government is committed to harnessing
the benefits which a successful marine renewable sector can bring to the UK and is currently
considering the specific measures by which we will achieve this.
The UK is at the forefront of the wave and tidal stream renewable energy industry through its
research and development programmes, test facilities and marine and offshore experience
gained from the oil and gas industries. The UK Government has provided funding for device
development and also shown its support for the industry through the UK’s dedicated test
facilities - the National Renewable Energy Centre (NaREC) and the European Marine Energy
2 The Coalition: our programme for Government, 2010
3 Department of Energy and Climate Change (2010) Marine Energy Action Plan
Page 11 of 75Centre (EMEC), in addition to WaveHub, a new demonstration facility in the South West that
will be commissioned during 2010.4
In recent years there has been significant progress in the marine industry with the testing of
full-scale prototype devices at sea and the installation of the first grid-connected deep water
wave energy device and tidal stream devices.5 A Strategic Environmental Assessment of
offshore energy is also currently underway, including wave and tidal technologies. This,
alongside complementary assessment for Scotland and Northern Ireland, should open up UK
waters for potential deployment of marine energy devices such as those recently licensed by
the Crown Estate.
In March 2010, The Crown Estate announced these first commercial leases of the seabed in
the Pentland Firth and Orkney Waters and anticipates the deployment of commercial wave
and tidal stream technologies to begin in the period up to 2015.
Tidal Stream
Tidal stream technologies harness the energy from the tides through the sheer velocity of the
currents turning the blades of an underwater turbine (the majority of turbine designs are not
dissimilar to a submerged wind turbine).
The tidal stream resource is largest off the north eastern coast of Scotland (the Pentland
Firth), Strangford Lough in Northern Ireland, The Skerries off the coast of Anglesey, Wales,
and the Channel Islands, where constrictions of tidal channels funnel water creating increases
in flow velocity.
The development of devices to capture the energy from tidal streams is still a very immature
industry and estimates of resource remain highly uncertain. It has been widely quoted that the
total UK tidal stream potential is of the order of 17TWh/year.6 This is derived from a method
that provides the most conservative estimate,7 however other methods of estimating the tidal
stream resource have resulted in higher technical potentials of up to 197TWh/year.8,9 There
are still uncertainties regarding these pieces of work but the potential resource they suggest is
sufficiently large to justify further research by Government.
Wave
Wave energy is created as winds pass over open bodies of water, transferring some of their
energy to form waves, which can then be captured by wave conversion technologies to
provide power either on the shoreline or in deeper waters offshore.
4 Carbon Trust(2009) Focus for Success
5 British Wind Energy Association, (2006) Path to Power
6 Sinclair Knight Merz (2008) Quantification of Constraints on the Growth of UK Renewable Generating Capacity
7 Blunden, L. S., Bahaj, A.S., (2006) Tidal energy resource assessment for tidal stream generators
8 Houlsby, G.T., Oldfield, M.L.G., Draper, S.,(2008) The Betz Limit and Tidal Turbines
9 David J.C. MacKay (2008) Sustainable Energy - Without the hot air
Page 12 of 75Geographically, the largest wave resource is located off the west coast of Scotland and south
west England/Wales, where the fetch (the distance travelled by waves without an obstruction)
is across the Atlantic.
Estimates indicate that the practical resource level for wave energy in UK waters is in the
order of 50 TWh/year, but estimates of the technical potential extend up to 157 TWh/year.10,11
However, this is dependent on the assumptions relating to the feasible length of a wave farm
and the extent to which devices can extract power from the on-coming waves. Those
assumptions are difficult to confirm when the technology capability is still developing.
Tidal range
Tidal range is the vertical difference between the high and low tide. Tidal range technologies
make use of this height difference to generate electricity by creating a differential in the water
levels either side of a structure and then passing this water through turbines. There are
currently two main commercially deployable tidal range designs – barrages and lagoons.
Barrages work by building a wall or ‘barrage’ across an estuary, creating a hydroelectric dam.
This is achieved by placing a number of large concrete caissons (blocks) across the estuary,
some of which would house conventional hydro-electric turbines and others sluice gates with
the rest of the structure being embankment.
Electricity is generated by allowing the incoming tide to pass through sluices in the barrage.
This body of water is then held as the tide ebbs. When the water level on the seaward side of
the barrage is low enough the water behind the barrage is released back to the seaward side
through the turbines generating electricity. Lagoons work on similar principles but impound
areas of water rather than forming a barrier across an estuary. An alternative mode of
operation is called two-way or ebb/flood generation.
Although the technology is available, there are only a small number of tidal range projects in
the world, all barrages. This is mostly due to the limited global tidal range resource and high
upfront costs. The largest projects are the La Rance 240MW tidal barrage in Northern France
which has been successfully operating since the 1960s and the 1984 18MW barrage in
Annapolis, Canada. In South Korea, a 254MW barrage is expected to be commissioned in
Sihwa later this year, and a 520MW barrage is planned for Garolim Bay. No tidal energy
lagoons have yet been built.
There are other technologies being investigated, though much less well developed and more
akin to early stage development of tidal stream and wave technologies than conventional tidal
range capture. Some of these are discussed in chapter 7.
The UK’s largest single tidal range resource is located in the Severn estuary. There are also
significant sources in other estuaries like the Solway, Mersey and smaller resources in the
Dee, Duddon, Wyre and Conwy estuaries in the West, and the Thames, Humber and Wash in
the East. Feasibility studies have recently been carried out for projects in the Solway Firth and
Duddon estuaries, and another is underway for the Mersey
10 Carbon Trust (2006) Future Marine Energy
11 LEK-Carbon Trust (2008) Low Carbon Technology Commercialisation Review
Page 13 of 75Figure 4: La Rance tidal power plant
Location Mean Tidal Range Estimated Maximum Predicted Annual Energy
(m) Installed Capacity (MW) Output (GWh)
Severn 14 13,500 19,700
Solway Firth 5.5 7,200 10,250
Morecambe Bay 6.3 3,000 4,630
Wash 4.45 2,400 3,750
Humber 4.1 1,080 1,650
Thames 4.2 1,120 1,370
Mersey 6.45 700 1,320
Dee 5.95 840 1,160
Table 2: UK Tidal range resource12
The Severn
The Severn estuary’s 14m (45 foot) tidal range represents a phenomenal source of
indigenous, predictable (though intermittent), low-carbon energy. In the 2006 Energy Review
12
Based on Binnie & Partners 1989 study,( ETSU 1989) and , Professor Burrows (University of Liverpool)
and Proudman Oceanographic Laboratory (POL) 2008 study on “Tapping the Tidal Power Potential of
the Eastern Irish Sea”
Page 14 of 75the Government asked the Sustainable Development Commission (SDC) to investigate tidal
power opportunities across the UK.
The SDC13 report published in October 2007 suggests that the majority of the UK’s practical
tidal range resource is in the Severn estuary, which could produce 5% of the UK’s electricity
needs. The SDC report concluded, with conditions, that there is a strong case for a
sustainable Severn barrage from Cardiff (Lavernock Point) to Weston-super-Mare (Brean
Down).
The SDC set a number of conditions on its support. These were that:
• a Severn barrage should be part of much wider action on climate change;
• a scheme must comply with environmental protection legislation and the provision of
compensatory habitat should be an integral part of any proposal. Early work on
scientific and legal feasibility of compliance and cost should be a priority;
• Government should be willing to own and lead a Severn energy scheme and consider
a range of innovative financing mechanisms; and
• a Cross-Government approach should be taken, with open and transparent
engagement with key stakeholders.
The report did not recommend tidal stream generation for the Severn estuary due to its early
stage of development and the greater potential elsewhere in the UK.
The SDC noted the other potential tidal range sites in the UK (such as the Mersey, Wyre and
Thames) but considered that these could go ahead with more limited Government
involvement than might be required in the Severn estuary due to their smaller size. This has
proved to be the case with several feasibility studies underway for other estuaries, funded by
a variety of organisations.
Given this positive recommendation by the SDC, the Government announced a feasibility
study on harnessing the renewable energy from the tidal range in the Severn estuary and
published its terms of reference in January 2008 (http://www.berr.gov.uk/files/file43810.pdf).
The aim of the feasibility study has been to:
• assess, in broad terms, the costs, benefits and impact of a project to generate power
from the tidal range of the Severn estuary, including environmental, social, regional,
economic, and energy market impacts;
• if applicable, identify a single preferred tidal range project (which may be a single
technology/location or a combination of these) from the number of options that have
been proposed;
• consider what measures the Government could put in place to bring forward a project
that fulfils regulatory requirements, and the steps that are necessary to achieve this;
and
• decide, in the context of the Government’s energy and climate change goals and the
alternative options for achieving these, whether the Government could support a tidal
power project in the Severn estuary and, if so, on what terms.
13
Sustainable Development Commission (Oct 07) “Turning the Tide, Tidal Power in the UK” http://www.sd-
commission.org.uk/publications.php?id=607
Page 15 of 75The Severn estuary and its tributary rivers the Wye and Usk are all designated as
internationally important nature conservation sites. They are designated for the species and
habitats that occur in them, including migratory fish and over-wintering birds. The estuary is
also designated for its estuarine habitats including mudflat and saltmarsh. These are
important ecosystems that form part of a network of European wildlife habitats called Natura
2000.
A tidal power scheme in the Severn estuary would also impact on local communities and
industries, as well as energy users and producers across the country.
A Severn tidal power project would bring benefits and costs and risks. An assessment of
these is set out in this summary report. Also published are the key supporting documents that
have been prepared for the study including those produced by external consultants. Whether
or not to go ahead with a Severn power generation scheme needs to be considered in the
context of the alternative means of meeting our energy and climate change goals.
Schemes studied
Ten proposals to generate electricity from the Severn estuary came forward from a public Call
for Proposals in May 2008 and a strategic review of existing options studied in the SDC’s and
previous reports. Proposals included barrages, land-connected and offshore lagoons, a tidal
fence and a tidal reef. The proposed schemes were in varying stages of development. Some
proposals were based on entirely embryonic technologies which have not been prototyped or
deployed. Locations varied too, with the largest scheme, the Outer Barrage, spanning the
estuary from Minehead to Aberthaw (15 miles) and the smallest lying upstream of the Severn
road crossings. Energy outputs also vary with the largest option (the Outer Barrage)
estimated to generate up to 7% of UK electricity and the smallest generating roughly the
same output as a large fossil fuel power plant.
A public consultation during January-April 2009 considered which of the proposals should be
studied further. The aim of scheme selection at this point was to identify scheme proposals
that were not feasible, and eliminate them from further investigation. Those short-listed were
considered to be potentially feasible, subject to further investigation.
Several factors were used to determine feasibility:
• technical risk;
• construction cost and the cost of energy produced;
• how this cost compared to other ways of meeting our energy and climate change
goals; and
• affordability – the burden on taxpayers and energy consumers and the role that
Government would have to play in delivering the project.
The following additional factors were used to judge whether more costly schemes presented
benefits that justified further study:
• environmental impact – a high-level view, through the undertaking of a Strategic
Environmental Assessment (SEA) on schemes’ environmental impact. Predicted
habitat loss was used as an indicator of the scale of impact and potential ‘benefits’
were taken as the scope for a reduced detrimental effect on the environment;
Page 16 of 75• regional impact – a high level view on anticipated impacts on ports, fishing and
employment.
The short-listing process did not attempt to establish whether the harm caused to the
environment or the regional economy was unacceptable, nor did it rule out schemes on these
two grounds. Greater detail on these impacts has been gathered over the later phase of the
study.
The schemes short-listed following the public consultation were:
• Cardiff-Weston barrage – spanning the Severn estuary from Brean Down to
Lavernock Point
• Shoots barrage – downstream of the second Severn road crossing
• Beachley barrage – slightly smaller and further upstream than the Shoots barrage,
and upstream of the Wye.
• Welsh Grounds lagoon – impoundment on the Welsh shore of the Estuary between
Newport and the Severn road crossings.
• Bridgwater Bay lagoon – impoundment on the English shore between Hinkley Point
and Weston-super-Mare.
Figure 5: Map of shortlisted schemes
The short-listed schemes use turbine technology that has been tried and tested in hydro-
electric dams across the world. There are no technology barriers to their immediate
Page 17 of 75deployment. However, the study also wanted to understand the proposals on the long-list
that were less well developed but which could possibly extract energy from the Severn with
less environmental impact. These options were not considered feasible because of their high
degree of technical risk; they are highly conceptual and need additional work to take them
forward. The Severn Embryonic Technologies Scheme (SETS) was established to develop
embryonic proposals further to help inform whether the benefits claimed for them could be
realised, and when. 3 proposals were funded under the scheme and are discussed in chapter
7.
Progress since public consultation
Since mid 2009, the feasibility study has completed a number of studies to consider what the
costs, impacts and risks of a Severn tidal power scheme would be. This includes a strategic
consideration of:
• how to build a Severn tidal power scheme;
• the commercial risks associated with building and operating a Severn tidal power
scheme;
• how a Severn tidal power scheme would change the estuary, and what effect this
would have on the people, economy and wildlife of the surrounding areas; and
• how negative impacts on the natural environment could be reduced or mitigated,
including provision of compensatory environmental measures.
A key part of the study process has been the definition of scheme options and consideration
of ways to improve the amount of energy generated, costs, and environmental and regional
impacts.
As more information on the environmental and social effects of the schemes came through
the SEA, measures to prevent or reduce adverse effects were also incorporated to provide
the scheme designs that are presented here. As a result the schemes and their costs have
evolved since public consultation last year. For example, the Bridgwater Bay lagoon proposal
now has a much larger energy yield (and construction cost) than before, although its footprint
within the estuary has stayed the same. Energy yield from the Cardiff-Weston barrage has
decreased as measures to reduce environmental impacts have been included. In addition,
the study moved from an assessment approach of ‘fair basis methodology’ (which used
common information that could be applied to all schemes), to one of scheme- specific
information (where available) to establish more accurate costs, designs and impacts for each
scheme. Energy yields and environmental impacts have been calculated using various
methodologies (including computer modelling) appropriate to this strategic level study.
Page 18 of 75Scheme Installed Annual Energy Levelised Energy Cost (£/MWh), Intertidal
Capacity Generated Optimism Bias included Habitat Loss
(MW) (TWh/yr) Investor Social (km2)
(10% discount (3.5%
rate) discount
1
rate )
Cardiff-Weston 8640 15.6 312 108 160
Barrage
Shoots 1050 2.7 335 121 33
Barrage
Beachley 625 1.2 419 151 27
Barrage
Welsh 1000 2.6 515 169 73
Grounds
Lagoon
Bridgwater 3600 6.2 349 126 25
Bay Lagoon
Table 3: scheme summaries
(1) The discount rate declines over time according to the profile set out in the Green Book.
The Treasury Green Book sets out the core principles and methodology on which all public
sector economic assessment of the social costs and benefits of all new policies, projects and
programmes is based. These have been used in the feasibility study – including in short-
listing options, valuing the costs and benefits, discounting (a technique used to compare costs
and benefits that occur in different time periods by using a discount rate to convert all costs
and benefits to ‘present values’, so that they can be compared) and adjusting for both risk and
optimism bias.
In order to compare Severn schemes and other low carbon options we have used:
• Net Present Values (NPV): NPV is the net of the Present Value of the benefits and
costs of a Severn scheme compared to those of alternative (‘counterfactual’)
generation technologies that might be built instead and which produce an identical
amount of electricity over the same time period. We have considered a range of
alternative technologies: nuclear; offshore wind; coal with carbon, capture and storage;
and a mix of these three technologies. Costs and benefits are discounted at Green
Book social time preference discount rates (see below).
• Levelised Energy Costs (LECs): LECs calculate the per unit electricity cost (typically
in £/MWh) of a generation technology. Levelised costs are calculated by dividing the
present value (PV) of project costs by the PV of the amount of energy the technology
generates, using an appropriate discount rate.
The study has used two main discount rates to calculate levelised costs:
Page 19 of 75• Social: Treasury Green Book Social Time Preference Rate (STPR), to assess the
attractiveness of different energy technologies from a societal perspective. Social Time
Preference is defined as the value society attaches to present, as opposed to future,
consumption
• Investor: 10%, to illustrate a private sector investor’s cost of capital (and Time
Preference Rate). This thereby reflects the attractiveness of a technology from the
point of view of a private sector investor. It should be noted that the 10% is a purely
illustrative cost of capital and not the result of any detailed analysis.
The cost and energy streams used to calculate costs for Severn schemes come from a
different source (Parsons Brinkerhoff) from those for other generation technologies, which are
based on assumptions developed by Mott-Macdonald14. To make comparisons between
Severn and other technologies valid the same drivers of costs are included in both estimates.
For example, all costs include adjustments for risk and optimism bias where applicable. The
costs for these other generation technologies are for Nth of a Kind (NOAK) plants rather than
first of a kind (FOAK) plants, i.e. deployment of the technologies has led to some cost
reductions due to learning effects. NOAK has been chosen to reflect that Severn schemes
could potentially begin generation between 2018 and 2021, meaning that costs for other
generation technologies will have fallen due to learning benefits from other, earlier projects.
The choice of NOAK costs also reflects the fact that generating capacity for these
technologies tends to be commissioned in fleets, rather than individual plant, meaning that
risks related to constructing and running the first plant are spread across the fleet as a whole.
To calculate the levelised costs below, we have assumed that generation of these
technologies would start in 2020.
Levelised Cost, £/ MWh Discount Rate
Counter-factual Social Social Investor (10%) Investor (10%)
technology (3.5%) (3.5%) (Optimism Bias (No Optimism
(Optimism (No included) Bias)
Bias Included) Optimism
Bias)
Coal with CCS 133 83 176 110
Nuclear 41 36 79 69
Offshore Wind 102 82 160 129
Table 4: Levelised costs £/MWh of counter-factual technologies, optimism bias included
14
Mott MacDonald, ‘Electricity Generation Costs Update’, June 2010.
Page 20 of 752. The scale of the challenge
• The UK must reduce its carbon dioxide emissions from energy and at the same time
have a secure and affordable supply of energy. We are legally committed to reducing
our greenhouse gas emissions by 80% by 2050 and to meeting 15% of UK energy
demand from renewable sources in 2020.
• To achieve these goals, the UK must increase the amount of electricity sourced from
renewables almost five-fold from current levels over the next 10 years and consider
decarbonising our electricity sector almost completely by 2030.
• DECC’s analysis shows that electricity will play a key role in helping to decarbonise UK
energy sectors so overall electricity demand will increase. This means an expansion of
many low carbon technologies particularly energy from nuclear, offshore wind and
carbon capture and storage. There are delivery risks for each of these technologies.
• Over their 120 year lifetime, some Severn tidal power schemes represent similar and in
some cases better value for society than equivalent investment in coal generation with
carbon capture and storage (CCS). As such Severn tidal power could in some
circumstances play a cost-effective role in meeting our long term energy targets.
Nuclear and offshore wind represent better value than Severn schemes, based on our
current estimates of future technology costs
• As it is unlikely that a Severn tidal power scheme could be generating by 2020 and
therefore contribute to the UK’s 2020 renewable energy target we do not see a case for
the Government to bring forward a scheme immediately
2020 – Renewable Energy Strategy
The UK has committed to sourcing 15% of its energy from renewables by 2020 – an increase
in the share of renewables by a factor of five (from 2009) in scarcely more than a decade.
This is part of EU-wide action to increase the use of renewable energy.
The precise breakdown of the 2020 renewable energy target between technologies will
depend on how investors respond to the incentives put in place. However, our modelling
suggests that renewables could provide more than 30% of our electricity (compared to around
6.7% today15). More than two-thirds of that 30% could come from onshore and offshore wind,
but there could also be important contributions from hydro, sustainable bioenergy, marine
sources and small-scale technologies. 12% of our heat could come from sustainable biomass,
biogas, solar and heat pumps, supplying the equivalent of 4 million households with their
current heating demands. Renewable sources could also provide up to 10% of our road and
rail transport energy.
15
Source: Digest of Energy Statistics (DUKES), 2009 renewables share of output
Page 21 of 75Figure 6: Illustrative mix of technologies in lead scenario for meeting
the UK’s share of the Renewable Energy Directive
The Renewable Energy Strategy included a Severn tidal power scheme as an option but
provided various scenarios in which the UK could meet our share of the European renewable
energy target without electricity from the Severn estuary.
The UK submitted in July 2010 a UK National Renewable Energy Action Plan 16 as defined in
Article 4 of the European Renewable Energy Directive (2009/28/EC). The Plan is based on a
template set by the European Commission, which asks for the trajectory and measures that
will enable the UK to reach its target for 15% of energy consumption in 2020 to be from
renewable sources.
The ‘lead scenario’ set out in the UK Plan demonstrates that it is possible to achieve the 15%
target and provides one view of the technology mix in 2020. However, this scenario does not
represent a target for any particular sector or technology and it should not be seen as an
upper limit to the UK’s ambition for renewables deployment.
The Government’s aims are to secure UK energy supplies through 2020 and beyond, to grow
the green economy and to cut harmful greenhouse gases. The Coalition: our programme for
government1 sets out a range of proposals to ensure the UK gains full benefit from our
renewable energy resources.
16
http://www.decc.gov.uk/en/content/cms/what_we_do/uk_supply/energy_mix/renewable/ored/uk_action_plan/uk_
action_plan.aspx
Page 22 of 75The UK Committee on Climate Change has been asked to review the level of ambition for
renewables that is required to meet the 2050 green house gas reduction target. The
Committee is expected to report next year. The Government has also committed to give an
Annual Energy Statement to Parliament to set strategic energy policy and guide investment in
all forms of energy including renewables. At the European level we are pushing for greater
leadership in tackling international climate change by supporting an increase in the European
Union emission reduction target to 30% by 2020 (from 1990 levels).
2050
The UK has a long-standing commitment to avoiding dangerous climate change and has a
legally binding target to cut greenhouse gas emissions by at least 80% by 2050. Carbon
budgets have been determined for the period to 2022 to prepare the way to meeting the 2050
target. The road from 2022 onwards is less clear. The shape of the trajectory, relative
contribution of different sectors, and the potential for imported credits are all uncertain. It is
however clear that that in the 2020s, 30s and 40s, we will have to step up the rate of
progress, reducing emissions by an average of 4% each year.
DECC’s assessment of how the UK can make the crucial long-term shift to a low carbon
economy is set out in the 2050 roadmap analysis published in July 201017. This considers a
range of plausible ways to reduce emissions and retain a secure and reliable energy system,
whilst maintaining a strong economy and protecting the most vulnerable. The analysis does
not attempt to provide answers but sets out some of the choices that we, as a country, will
need to make. It describes the key challenges, opportunities, trade-offs and uncertainties
faced, including how much can be achieved through energy efficiency and potential lifestyle
changes.
85% of current greenhouse gas emissions are produced by burning fossil fuels to produce
energy18. Therefore, reducing emissions means finding different, practical ways in which the
UK can power homes, businesses and transport using low carbon forms of energy. One of
these ways is to provide more energy from electricity which is generally accepted to be easier
to de-carbonise than other energy sources. Even with energy efficiency measures in place,
the UK will need to produce significantly more electricity than at present – the scenarios set
out in the 2050 pathways analysis show a 60 – 100% increase.
The key sources of low carbon electricity are nuclear, gas/coal generation with carbon capture
and storage (CCS) and renewables. This could mean deploying about 12,000 offshore-wind
turbines (5 MW each), 8,000 onshore wind turbines (2.5 MW each) and a quadrupling of
nuclear generating capacity quadrupling from today’s levels by 2050. In 2050, the UK may
need the equivalent of about 30 nuclear power stations (assuming capacity of 1.4 GW) and
30 combustion plants fitted with CCS (assuming a capacity of 1.5 GW each).
These supplies must also be secure. Reserves of domestic oil and gas are declining and
without action, the UK will become increasingly reliant on imports at a time when world
17
http://www.decc.gov.uk/en/content/cms/what_we_do/lc_uk/2050/2050.aspx
18
UK GHG Inventory (2007)
Page 23 of 75primary energy demand is set to increase by 17-30% by 203019. Increasing proportions of
imports leave us dependent on geopolitical events for our energy and vulnerable to rising
prices. Other countries – e.g. USA, China, South Korea are also investing heavily in
renewables and nuclear to keep their energy secure. The UK must continue to respond to
these global energy challenges.
In March 2010, in conjunction with the Treasury, DECC set out initial conclusions on the
capacity of the electricity market to deliver clean, secure and affordable supplies of electricity
in the long-term in an Energy Market Assessment20. The market is already delivering
investment in the new infrastructure necessary to decarbonise and ensure continued security
of supply to 2020. But the challenges of the decades ahead will be significant as the UK
seeks to move to a low carbon economy. All low carbon technologies require large upfront
capital investment. This investment will not be forthcoming unless we deal with major
constraints that go across all technologies:
- while the EU Emissions Trading System is delivering emissions reductions via its
effective cap across the UK and Europe, the carbon price it sets has not been sufficient
in giving stable, long-term signals to generators and has therefore not been
incentivising the required levels of new low carbon investment;
- the structure of the electricity market does not support the scale of new investment
required;
- it can be hard to tap into the financial markets to catalyse private sector investment.
Tackling these issues is central not only to our energy security, but to enabling UK businesses
to seize the economic opportunities of the move to a low carbon energy supply. First,
underpinning all low carbon generation technologies, we need a stronger carbon price signal.
The Chancellor set out in his Budget in June 2010, plans for public consultation in the Autumn
on reforming the climate change levy to provide more certainty and support to the carbon
price. Subject to that consultation, the Government will bring forward relevant legislation in
Finance Bill 2011.
The Government is also conducting a detailed appraisal of the way the electricity market
should be designed. The Electricity Market Reform project will assess the role that supporting
the carbon price, emissions performance standard, revised Renewables Obligation, Feed-in
Tariffs, capacity mechanisms and other interventions could play in delivering a system that
supports the delivery of a secure, low carbon, affordable electricity mix for the 2020’s and
beyond. It is vital that industry, Ofgem and others are fully involved in this process.
The Electricity Market Reform project will issue a consultation document in the Autumn and a
White Paper in Spring 2011.
Is there a role for the Severn?
The feasibility study has calculated the cost of the energy generated by each of the Severn
schemes and how they compare to the other measures necessary to meet our energy and
19
IEA (2009),World Energy Outlook, 2007-2030 growth rates, as set out in “450 Policy” and “Reference” scenarios.
20
http://www.hm-treasury.gov.uk/d/budget2010_energymarket.pdf
Page 24 of 75You can also read