Climate change resilience - a framework for decision making - Chevron
←
→
Page content transcription
If your browser does not render page correctly, please read the page content below

climate change
   resilience
a framework for decision making

table of contents

1    chairman’s letter                                                                          “We proactively consider climate
2    chevron at a glance                                                                         change risks and opportunities
3    executive summary                                                                              in our business decisions.
4 section 1: governance framework                                                               We have the experience, processes
7    section 2: risk management                                                                    and governance to manage
9 section 3: strategy                                                                             these risks and opportunities,
35 section 4: actions and investments                                                            and we are equipped to deliver
41 section 5: metrics                                                                                industry-leading results
44 section 6: about this report                                                                  and superior stockholder value
                                                                                                 in any business environment.”
                                                                                                                                 — Mike Wirth
                                                                                                                     Chairman of the Board and CEO

Released March 2018.

forward-looking statements warning

CAUTIONARY STATEMENT RELEVANT TO FORWARD-LOOKING INFORMATION                                    natural gas; the inability or failure of the company’s joint-venture partners to fund their
FOR THE PURPOSE OF “SAFE HARBOR” PROVISIONS OF THE PRIVATE SECURITIES                           share of operations and development activities; the potential failure to achieve expected
LITIGATION REFORM ACT OF 1995                                                                   net production from existing and future crude oil and natural gas development projects;
                                                                                                potential delays in the development, construction or start-up of planned projects; the
This report contains forward-looking statements relating to Chevron’s operations that           potential disruption or interruption of the company’s operations due to war, accidents,
are based on management’s current expectations, estimates and projections about the             political events, civil unrest, severe weather, cyber threats and terrorist acts, crude oil pro-
petroleum, chemicals and other energy related industries. Words or phrases such as              duction quotas or other actions that might be imposed by the Organization of Petroleum
“anticipates,” “expects,” “intends,” “plans,” “targets,” “forecasts,” “projects,” “believes,”   Exporting Countries, or other natural or human causes beyond its control; changing
“seeks,” “schedules,” “estimates,” “positions,” “pursues,” “may,” “could,” “should,”            economic, regulatory and political environments in the various countries in which the
“budgets,” “outlook,” “trends,” “guidance,” “focus,” “on schedule,” “on track,” “is slated,”    company operates; general domestic and international economic and political condi-
“goals,” “objectives,” “strategies,” “opportunities” and similar expressions are intended       tions; the potential liability for remedial actions or assessments under existing or future
to identify such forward-looking statements. These statements are not guarantees of             environmental regulations and litigation; significant operational, investment or product
future performance and are subject to certain risks, uncertainties and other factors,           changes required by existing or future environmental statutes and regulations, including
many of which are beyond the company’s control and are difficult to predict. Therefore,         international agreements and national or regional legislation and regulatory measures
actual outcomes and results may differ materially from what is expressed or forecasted          to limit or reduce greenhouse gas emissions; the potential liability resulting from other
in such forward-looking statements. The reader should not place undue reliance on               pending or future litigation; the company’s future acquisition or disposition of assets
these forward-looking statements, which speak only as of the date of this report. Unless        or shares or the delay or failure of such transactions to close based on required closing
legally required, Chevron undertakes no obligation to update publicly any forward-              conditions; the potential for gains and losses from asset dispositions or impairments;
looking statements, whether as a result of new information, future events or otherwise.         government-mandated sales, divestitures, recapitalizations, industry-specific taxes,
                                                                                                changes in fiscal terms or restrictions on scope of company operations; foreign currency
Among the important factors that could cause actual results to differ materially from           movements compared with the U.S. dollar; material reductions in corporate liquidity and
those in the forward-looking statements are: changing crude oil and natural gas prices;         access to debt markets; the impact of the 2017 U.S. tax legislation on the company's
changing refining, marketing and chemicals margins; the company’s ability to realize            future results; the effects of changed accounting rules under generally accepted account-
anticipated cost savings and expenditure reductions; actions of competitors or regula-          ing principles promulgated by rule-setting bodies; the company’s ability to identify and
tors; timing of exploration expenses; timing of crude oil liftings; the competitiveness of      mitigate the risks and hazards inherent in operating in the global energy industry; and the
alternate-energy sources or product substitutes; technological developments; the results        factors set forth under the heading “Risk Factors” on pages 19 through 22 of Chevron’s
of operations and financial condition of the company’s suppliers, vendors, partners and         2017 Annual Report on Form 10-K. Other unpredictable or unknown factors not discussed
equity affiliates, particularly during extended periods of low prices for crude oil and         in this report could also have material adverse effects on forward-looking statements.

                                                                Climate change resilience: a framework for decision making
chairman’s letter
                              for nearly 140 years, chevron has
                       provided affordable, reliable energy to improve
                             lives and power the world forward

                                                                              This report explains how Chevron assesses climate change
                                                                              risks in connection with other risks affecting our business.
                                                                              We outline our rigorous risk management processes and our
                                                                              governance framework, including how we use them to assess
                                                                              and manage potential risks with active Board of Directors
                                                                              and executive-level oversight.

                                                                              In response to feedback from our stockholders, this report
                                                                              explains our strategic decision-making approach as it relates to
                                                                              climate change–related risks and opportunities, including our
                                                                              ongoing evaluations of our portfolio and future investments.
                                                                              We also provide insight regarding our approach to supply,
                                                                              demand, commodity and carbon prices, and the factors that
                                                                              drive global economic change. We have tested the competitive-
                                                                              ness of our present assets under multiple scenarios, including
                                                                              some of the most aggressive greenhouse gas reduction scenarios,
In the decades ahead, the world will need all forms of energy                 such as the International Energy Agency’s (IEA) Sustainable
in order to maintain the benefits of modern life and help advance             Development Scenario, issued November 2017. As described in
people reaching for a better quality of life. We are committed                this report, the results of our scenario testing demonstrate that
to addressing the risks of climate change while delivering the                our portfolio, due to its maturity and its diversity across assets
energy that benefits societies and economies. Throughout our                  and geographies, is resilient in many scenarios, and our asset mix
long history, we have shown our resilience through our ability                enables us to be flexible in response to potential changes.
to adapt to changing conditions in the marketplace, and we will
continue to adjust our business as needed to effectively and                  We welcome feedback on this report and look forward to
proactively manage climate change risks.                                      continued engagement with our investors and stakeholders.
                                                                              This report demonstrates that we proactively consider climate
Chevron recognizes that climate change is a growing area of                   change risks and opportunities in our business decisions.
interest for our investors and stakeholders. We have listened to              We have the experience, processes and governance in place to
your concerns, and we are responding. In March 2017, we volun-                manage these risks and opportunities, and we are equipped
tarily published Managing Climate Change Risks: A Perspective                 to deliver industry-leading results and superior stockholder value
for Investors, in which we discussed our views on market                      in any business environment.
fundamentals, governance, risk management and strategy.

Continuing the conversation over the past year has helped us
better understand your interests and potential concerns related
to climate change. We heard that you want to know more about
the framework we use to think about climate change in relation                Michael K. Wirth
to our industry, and specifically in relation to our business.                Chairman of the Board and
Climate Change Resilience: A Framework for Decision Making                    Chief Executive Officer
represents the next step in our ongoing dialogue. We have                     March 2018
analyzed the recommendations issued by the Financial Stability
Board’s Task Force on Climate-Related Financial Disclosures
and have developed this report with the aim of aligning our
disclosures with the recommendations that we believe are
most useful to our stockholders.

                                              Climate change resilience: a framework for decision making

                                                                          1
chevron at a glance
          we take great pride in                                                                               total assets*
       enabling human progress by                                                               $253.8 billion
         developing the energy
         that improves lives and                                               sales and other operating revenues**
        powers the world forward                                                                $134.7 billion
Chevron is one of the world’s leading integrated energy                         net oil-equivalent daily production**
companies. Our success is driven by our people and
our collective commitment to delivering industry-leading
                                                                                       2.7 million barrels
results and superior stockholder value in any business
                                                                                 net oil-equivalent proved reserves*
environment. We do this by operating responsibly, applying
advanced technologies, capturing new high-return oppor-
tunities, and executing with excellence in a socially and
                                                                                       11.7 billion barrels
environmentally responsible manner. We explore for, produce                                     daily refining capacity*
                                                                                        1.7 million barrels
and transport crude oil and natural gas; refine, market and
distribute transportation fuels and lubricants; manufacture
and sell petrochemicals and additives; and develop and
deploy technologies that enhance business value in every                                 daily refined product sales**
aspect of the company’s operations.
                                                                                       2.7 million barrels
                                                                             * At December 31, 2017.
                                                                            ** Year ended December 31, 2017.

                             overview of upstream and downstream portfolios

    Upstream exploration area

    Upstream production

    Downstream manufacturing
    facilities (refineries, chemicals)

Locations are approximate.

                                            Climate change resilience: a framework for decision making

                                                                        2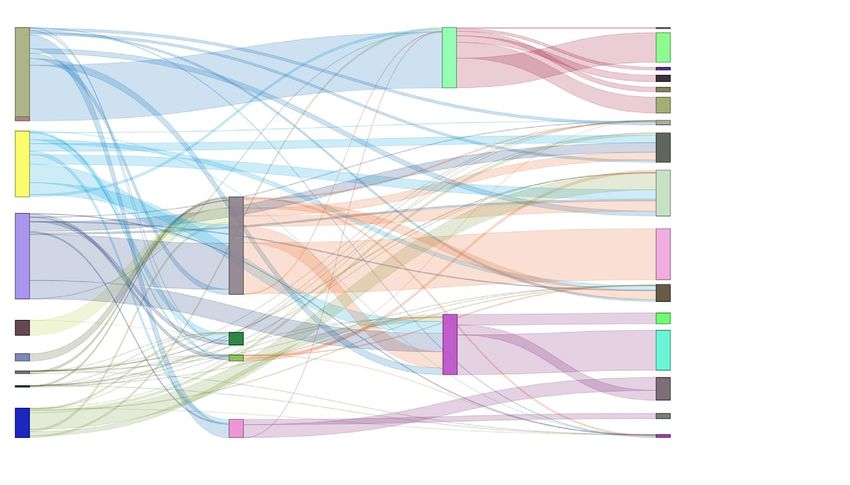
executive summary
                                     we believe that managing climate change risks
                                        is an important element of our strategic
                                     focus to return superior value to stockholders

providing strong governance                                                                             In 2016, approximately 50 percent of Chevron’s total Scope 1
                                                                                                        and Scope 2 1 equity greenhouse gas emissions were in regions
Chevron’s governance structure includes multiple avenues for                                            with existing or developing carbon pricing policies. We use
the Board of Directors and executive leadership to exercise                                             carbon prices in business planning, investment decisions,
their oversight responsibilities with respect to climate change                                         impairment reviews and reserves calculations.
risks, including through our Public Policy, Strategy and Planning,
and Global Issues committees, each of which meets regularly                                             Due to its diversity across assets and geographies, our portfolio
throughout the year. We periodically reassess our governance                                            is resilient, and our asset mix enables us to be flexible in response
structure to ensure that Chevron maintains a Board composition                                          to potential changes in supply and demand, including potential
and framework that is effective for managing the company’s                                              low-carbon scenarios like the IEA’s Sustainable Development
performance and risks to our business as we strive to deliver                                           Scenario. Our intent is to have strategies that drive our actions
value to our stockholders.                                                                              to enable human progress and deliver industry-leading results
                                                                                                        and superior stockholder value in any business environment.

assessing and managing risk
                                                                                                        taking actions and making investments
Chevron faces a broad array of risks, including market, operational,
                                                                                                        to mitigate emissions
strategic, legal, regulatory, political and financial risks. We under-
take an enterprisewide process to identify major risks to the                                           Chevron is a leader in improving how reliable and affordable
company and ensure that appropriate mitigation plans are in place.                                      energy is developed and delivered to meet global demand.
As part of this process, we conduct an annual risk review with                                          We are making our operations more energy efficient, reducing
executive leadership and the Board of Directors.                                                        flaring, managing methane emissions and investing in low-carbon
                                                                                                        technologies. In addition, we are investing in the innovations and
                                                                                                        innovators of tomorrow through our research and development
setting business strategy to deliver results                                                            and our investments in science-, technology-, engineering- and
in any business environment                                                                             math-focused education.

Our company’s foundation is built on our values, which guide our
actions to deliver results. We conduct our business in a socially
and environmentally responsible manner, respecting the law and
universal human rights, in order to benefit the communities where
we work. Chevron’s strategic and business planning processes
bring together the company’s views on energy market conditions
to guide decision making by executive leadership and facilitate
discussion with the Board of Directors.                                                                                              in summary
                                                                                                             Although we cannot forecast exactly what will happen in the
The energy demands of the world are greater today than at any
                                                                                                             future, we believe Chevron’s governance, risk management
other time in human history. Most published outlooks conclude that
                                                                                                             and strategy processes are sufficient to mitigate the risks and
fossil fuel demand will continue to grow over the coming decades.                                            capture opportunities associated with climate change. These
As part of our strategic planning process, we use our proprietary                                            processes are appropriate in order to enable the company to
models to forecast demand, energy mix, supply, commodity                                                     continue to monitor and adjust accordingly as climate policy
pricing and carbon prices—all of which include assumptions                                                   develops. In addition, as demonstrated by our actions, we believe
about future policy developments, such as those that may be                                                  that managing climate change risks is an important element of
                                                                                                             our strategic focus to return superior value to stockholders.
implemented in support of the Paris Agreement.

1	Scope 1 includes direct emissions from sources within a facility. Scope 2 includes indirect
   emissions from electricity and steam that Chevron imports.

                                                                        Climate change resilience: a framework for decision making

                                                                                                    3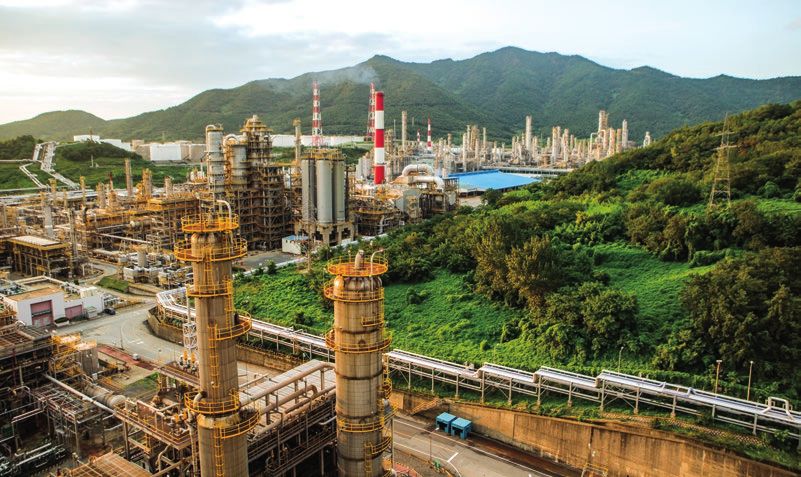
section 1

                           governance
                           framework
                                                                     1.1 climate governance that drives performance,
                                                                     manages risk and is responsive to stockholders
                                                                     Chevron’s Board of Directors oversees the company’s risk
                                                                     management policies and practices to ensure that we employ
                                                                     appropriate risk management systems. Chevron’s governance
                                                                     structure includes multiple avenues for the Board of Directors and
                                                                     executive leadership to exercise their oversight responsibilities
                                                                     with respect to risk, including those related to climate change.
                                                                     Management of climate change risks is fundamentally integrated
                                                                     into Chevron’s approach to risk management and governance.
                                                                     The full Board reviews long-term energy outlooks and leading
                                                                     indicators that could signify change on an annual basis. Climate
                                                                     change risks are regularly assessed by Board committees,
                                                                     such as the Public Policy Committee, and by executive-level
                                                                     committees, such as the Strategy and Planning and the Global
“Climate change is a growing area of interest                        Issues committees. In addition to providing oversight, the Board is
 for our investors and other stakeholders. We’re                     committed to fostering long-term and institutionwide relationships
                                                                     with stockholders and being responsive to their input. Chevron
 committed to addressing the risks of climate
                                                                     entrusts an executive-level committee with planning and executing
 change while delivering the energy that benefits
                                                                     the Annual Engagement Plan and Process to engage in dialogue
 societies and economies. Chevron’s management                       with a substantial portion of our investor base, including our 50
 integrates climate change considerations into                       largest stockholders and other stakeholders.
 its risk management, governance and business
 planning processes. The Board regularly assesses
 climate change risk and opportunities through-                      1.2 board and executive-level oversight
 out the year.
                                                                     The Board of Directors and each of the governing bodies
                                                                     that assists the Board in its oversight of climate change issues
“Climate change is also a frequent topic when                        meet several times per year. The governing bodies consist of
 management and members of the Board meet                            Board-level and executive-level committees.
 with stockholders. As a result of stockholder
 feedback, the Board recently endorsed this                          1.2.1 Board-level committees
 second, more detailed voluntary report on climate                   Chevron’s Board of Directors has four standing committees:
 change related to Chevron.”                                         Public Policy, Audit, Board Nominating and Governance,
                                                                     and Management Compensation. Each committee includes
             — Dr. Ronald Sugar                                      only independent Directors and is chaired by an independent
                                                                     Director who determines the frequency, length and agenda
                   Lead Director
                                                                     of the meetings and who has access to management, information
                                                                     and independent advisors, as needed.

                                                                     Public Policy Committee (PPC)
                                                                     The PPC assists the Board by periodically assessing and advising
                                                                     on risks that may arise in connection with social, political,
                                                                     environmental and public policy aspects of Chevron’s business.
                                                                     As part of this effort, the PPC considers important issues relating
                                                                     to climate change, such as policy trends and their potential
                                                                     implications. The PPC makes recommendations for anticipating

                                     Climate change resilience: a framework for decision making

                                                                 4
chevron’s governance structure
                                          relevant to climate change risk oversight

                                                                   stockholders

                                                               board of directors*

  board-level committees
  composed of non-employee directors

                                             board nominating and                   management
                        audit committee                                                                        public policy committee
                                             governance committee              compensation committee

  committees of executive officers
  operating under direction of the board                       executive committee**

                                                  strategy and                                                      engagement
  * Chaired by Chairman of the Board                                            global issues committee
                                              planning committee**                                               steering committee
 ** Chaired by Chief Executive Officer

and adjusting to these trends so that the company can achieve                  Strategy and Planning Committee
its business goals and constructively participate in the public                The S&PC is responsible for actively managing the composition,
policy dialogue. It also reviews and makes recommendations                     resource allocation and strategic direction of Chevron’s portfolio to
for Chevron’s strategies related to corporate responsibility and               achieve our long-term objectives. It is also the committee that
reputation management.                                                         most actively oversees and endorses enterprise risk management.

Other Board-level committees                                                   Global Issues Committee
In addition to the PPC, the Board has other committees within                  The GIC oversees the development of Chevron’s policies and
which climate change risks may be discussed. For example:                      positions related to global issues of significance and recommends
                                                                               appropriate actions to respond to these issues.
• The Audit Committee analyzes potential financial risk exposures
  as part of Chevron’s enterprise risk management program,
  including potential financial risks associated with climate change.          1.3 engagement steering committee
  These risks are discussed in the Risk Factors section of the
  company’s 2017 Annual Report on Form 10-K.                                   In an effort to continually improve our governance processes
                                                                               and communications, we developed, and we follow, the Annual
• The Board Nominating and Governance Committee identifies and                 Engagement Plan and Process. The ESC, which is composed of
  recommends prospective Directors with the goal of maintaining                senior executives, meets periodically to discuss engagement
  a Board composition appropriate to overseeing the wide-ranging               efforts, key issues and trends, and input from stockholders. An
  risks affecting Chevron. Among the skills and qualifications                 engagement team consisting of senior executives, subject matter
  desired in our Directors are experience in environmental affairs             experts and, when appropriate, our Lead Director conducts
  and extensive knowledge of governmental, regulatory, legal or                in-depth discussions with stockholders. We consistently aim
  public policy issues.                                                        to engage annually with our top 50 investors and other key
                                                                               stakeholders. Chevron gains valuable feedback during the
1.2.2 Executive-level committees                                               engagements, and this feedback is shared with the Board and
Under the direction of the Board, Chevron’s Executive                          relevant committees.
Committee is composed of executive officers of Chevron and
carries out Board policy in managing the business affairs of
the company. The Strategy and Planning Committee (S&PC)                        1.4 strong governance
and Global Issues Committee (GIC), described below, are
subcommittees of the Executive Committee. The Engagement                       We frequently reassess our governance structure to ensure that
Steering Committee (ESC) provides updates to the Board                         Chevron maintains an effective framework for managing the
Nominating and Governance Committee.                                           company’s performance and risks to our business. The skills,
                                                                               experience and expertise of our Board of Directors are shown in
                                                                               the chart on the following page.

                                               Climate change resilience: a framework for decision making

                                                                           5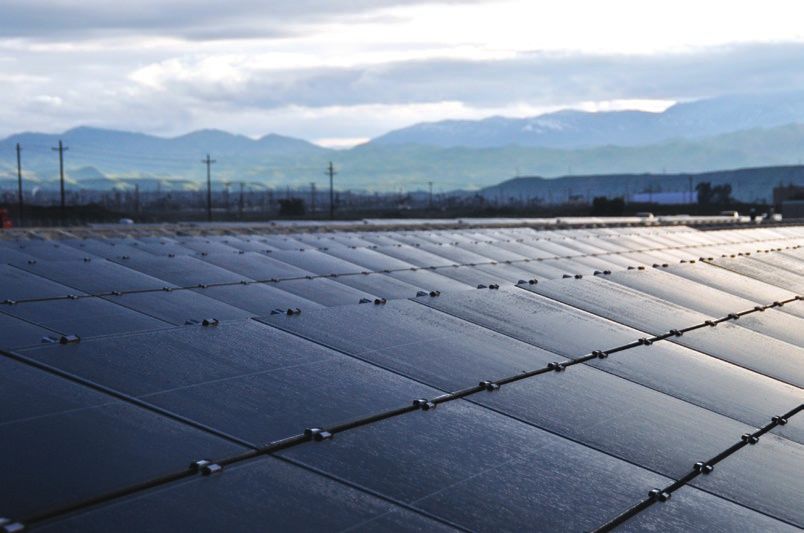
board of directors
                                                 highly engaged, diverse board
                                              with relevant skills and qualifications

           Michael K. Wirth                                        Ronald D. Sugar                                         Wanda Austin
  Chairman and Chief Executive Officer                              Lead Director                                        Retired President and
      Former Vice Chairman of the Board                         Retired Chairman and                                    Chief Executive Officer,
        and Executive Vice President of                        Chief Executive Officer,                            The Aerospace Corporation (2, 3)
     Midstream and Development, Chevron                 Northrop Grumman Corporation (3, 4)

                Linnet F. Deily                                   Robert E. Denham                                         John B. Frank
            Former Deputy U.S. Trade                                   Partner,                                            Vice Chairman,
      Representative and U.S. Ambassador                   Munger, Tolles & Olson LLP (1, 4)                        Oaktree Capital Group, LLC (1)
     to the World Trade Organization (2, 3)

                 Alice P. Gast                                 Enrique Hernandez, Jr.                                 Charles W. Moorman IV
                   President,                                  Chairman, Chief Executive                                Retired Chairman and
         Imperial College London (2, 3)                          Officer and President,                                Chief Executive Officer,
                                                         Inter-Con Security Systems, Inc. (2, 4)                   Norfolk Southern Corporation (1)

                Dambisa Moyo                                         Inge G. Thulin                                     D. James Umpleby III
            Chief Executive Officer,                            Chairman, President and                                Chief Executive Officer,
              Mildstorm LLC (1)                                 Chief Executive Officer,                                Caterpillar Inc. (3, 4)
                                                                  3M Company (3, 4)

Skills and qualifications:    Business Leadership/Operations         Environmental Affairs           Government/Regulatory/Public Policy          Finance

Committees of the Board: (1) Audit: Charles W. Moorman IV, Chair (2) Public Policy: Linnet F. Deily, Chair
(3) Board Nominating and Governance: Ronald D. Sugar, Chair (4) Management Compensation: Enrique Hernandez, Jr., Chair

                                                 Climate change resilience: a framework for decision making

                                                                             6
section 2

                    risk management
                     chevron employs long-standing risk management
                           processes in assessing the risks to its
                     business, including risks related to climate change

Chevron faces a broad array of risks relating to its business,                  2.1.1 Operational risk
including market, operational, strategic, legal, regulatory, political          Climate change presents different potential risks to different
and financial. Risks that could materially impact the company’s                 segments of our business. Our management of operational risk
operations and financial condition are discussed in the Risk Factors            is aided by several systems and processes across the enterprise.
section of the company’s Annual Report on Form 10-K.                            Through application of our risk management processes,
                                                                                Chevron approaches operational risks in a consistent manner.
Chevron’s Enterprise Risk Management (ERM) process provides
corporate oversight for identifying major risks to the company and
ensuring that appropriate mitigation plans are in place. The ERM
process includes an annual risk review with executive leadership                               operational excellence
and the Board of Directors. As part of this annual risk review, the                          management system (OEMS)
S&PC evaluates categories of risks to Chevron’s business and their                   Through application of the OEMS, Chevron assesses risks,
potential consequences, financial or otherwise, and identifies                       identifies safeguards and implements programs to ensure that
and assesses the effectiveness of safeguards and mitigations in                      those safeguards are effective. Chevron has put in place a
place to manage each risk category. When necessary, the S&PC                         number of enterprisewide processes and standards as well
develops and implements improvement actions to strengthen the                        as technical guidance to meet our goals and expectations for
company’s safeguards. Following endorsement by the S&PC, the                         operational excellence (OE). The OE Risk Management process
                                                                                     sets expectations for the assessment of risk across the OE
annual ERM assessment is reviewed by the Board of Directors.
                                                                                     focus areas of workforce safety and health, process safety,
                                                                                     reliability and integrity, the environment, efficiency, security,
                                                                                     and stakeholders and includes specific standards for

   2.1                                                                               performance of those assessments.

                                                                                                 learn more      chevron.com/oems

              integration
          of climate change                                                     Potential climate change risks are considered when conducting
                                                                                risk assessments at the business unit, operating company and
             into chevron                                                       enterprise levels. These risk assessments include structured

          risk management                                                       identification of potential risk scenarios, evaluation of the
                                                                                adequacy of safeguards to manage those scenarios and, as
                                                                                needed, identification of risk mitigations. For example, in areas
    Potential climate change risks are integrated into                          of water scarcity, we identified freshwater use as a risk for
    multiple ERM risk categories because a truly global                         some business units. As a result, we actively work to reduce our
    challenge like climate change requires a compre-                            freshwater use in areas of water scarcity. You can read more about
    hensive review strategy. The Board of Directors                             our water management activities in Section 4.6, Managing Water
    and executive leadership believe this integrated                            Resources, on Page 39.
    approach is appropriate because it enables climate
                                                                                Environmental management
    change risks to be examined in connection with
                                                                                We make continual improvements to our environmental perform-
    other broad-ranging risks affecting Chevron.
                                                                                ance by following our OEMS and Environmental Stewardship OE
                                                                                processes, which require our businesses to identify, assess and
                                                                                prioritize environmental risk and improvement opportunities.
                                                                                Our approach to environmental stewardship includes an environ-

                                                Climate change resilience: a framework for decision making

                                                                            7
mental, social and health impact assessment designed to identify               2.1.3 Geopolitical and legislative risk
and manage potentially significant project-related impacts and                 Chevron’s ERM process targets a broad range of geopolitical risks,
opportunities in a consistent manner.                                          including legislative, regulatory and legal risks, to ensure that
                                                                               they are appropriately assessed and reviewed. In the years ahead,
The Board of Directors, and the Public Policy Committee in                     companies in the energy industry, including Chevron, may face
particular, provide oversight and guidance on environmental                    an increase in international and domestic regulation of greenhouse
matters in connection with Chevron’s projects and operations                   gas (GHG) emissions. Such regulations could impose additional
and are regularly briefed by professionals whose focus is on                   costs on the oil and gas sector. To the extent the market allows
environmental protection and stewardship. Members of the                       for pass-through of any direct costs to consumers, the potential
Board regularly visit Chevron operations across the globe and                  impact of such regulations would be reduced.
discuss environmental matters specific and relevant to these
locations. Significant environmental and process safety issues                 Chevron’s S&PC and GIC receive regular updates on climate policy
are reviewed by the Board to ensure compliance with the                        trends, which may forecast increased or decreased stringency,
company’s rigorous processes.                                                  and their potential implications. Chevron engages in ongoing
                                                                               efforts to understand the potential impact of climate change
2.1.2 Physical risk                                                            policy on the different parts of our business—particularly supply,
For decades, Chevron has managed risks associated with the                     demand and pricing—and works with governments to ensure that
impact of ambient conditions on our operations. Long-standing                  they fully understand the perspectives of a major participant in the
practices developed to manage these impacts are being applied                  industry. These efforts help us better evaluate how GHG/climate
and extended to reflect possible effects of climate change and                 regulation may unfold in jurisdictions where we operate. Changes
to ensure the ongoing resilience of our infrastructure, both for               in anticipated demand, pricing, competitiveness and regulation
current operations and for those being developed and considered.               become apparent over time, and Chevron takes these factors
For example, to protect the facilities against possible storm                  into account in revising our capital allocation and redirecting our
surges, we spent $120 million on raising a dike at our Pascagoula,             portfolio as needed.
Mississippi, refinery and $16.2 million to construct a seawall
at our Port Arthur, Texas, lubricants plant. As another example,
the Chevron Engineering Standard for Metocean Design and
Operating Conditions was recently updated based on the assess-                                  climate change litigation
ment of future potential impacts to Chevron’s marine facilities,                    Chevron, along with many other companies in the oil and gas
such as potential changes in storm intensity, changes to sea level                  industry, is named in lawsuits brought by various cities and
and changing water currents.                                                        counties that seek to hold companies financially responsible
                                                                                    for changes in climate and the effects of those changes.
Business Continuity Plans                                                           The claims are factually and legally without merit. Chevron
With global operations subject to diverse microclimates and                         welcomes meaningful efforts to address the issue of climate
                                                                                    change, but litigation is not an appropriate or effective tool for
weather phenomena, Chevron stays prepared for the possibility
                                                                                    accomplishing that objective. As outlined in our Policy Principles
of natural disasters. Based on risk evaluations and business                        for Addressing Climate Change shown on Page 20, reducing
impact analyses, business units develop and implement a                             GHG emissions is a global issue that requires global engagement
Business Continuity Plan to ensure continuous availability—                         and careful consideration of broader policy, regulatory and
or prompt recovery—of critical business processes, resources                        economic priorities.
and facility operations.

Business units use their Business Continuity Plan to manage
                                                                               2.1.4 Strategic risk
operations with a reduced workforce, to direct employees to
                                                                               Chevron’s ERM process assists the Board of Directors and
alternate work locations—such as working from home or alter-
                                                                               executive leadership in overseeing risks related to key strategic
nate office locations—and to overcome localized IT outages.
                                                                               decisions for the company, including decisions related to
For example, personnel from our Supply and Trading group
                                                                               commodity price forecasts and capital project approvals.
in Houston identified business-critical employees to deploy
                                                                               The processes we use are discussed in detail in the Strategy
to alternative work locations in the event the Houston office is
                                                                               section of this report.
unavailable. The plan, process and alternative facilities are
regularly reviewed and tested to ensure business continuity.

                                               Climate change resilience: a framework for decision making

                                                                           8
section 3
strategy
we conduct our business in a socially and environmentally
responsible manner, respecting the law and universal
human rights to benefit the communities where we work
3.2 chevron’s strategic and business
planning processes
3.1
The risks and opportunities facing Chevron change over time.
We develop strategies to deliver results under a range of scenarios,
including those resulting from potential carbon-constrained
policies and scenarios, such as the one presented in the IEA’s
Sustainable Development Scenario (SDS), described in more detail
the chevron way in Section 3.4 on Page 30.
Chevron’s approach to running its business is rooted in We use the company’s strategic and business planning processes
The Chevron Way. At the heart of The Chevron Way is our described in the following pages, as well as the risk management
vision: to be the global energy company most admired for tools discussed in the previous section of this report, to integrate
its people, partnership and performance. Our company’s evolving trends, including those related to climate change, into our
foundation is built on our values, which guide our actions framework for decision making. Most outlooks we track conclude
to deliver consistent results. We conduct our business that oil and gas demand will continue to grow over the coming
in a socially and environmentally responsible manner, decades, but we also track and analyze leading indicators that
respecting the law and universal human rights to benefit might signal change, such as potential policy developments.
the communities where we work. Our strategies guide our
actions to deliver industry-leading results and superior Chevron’s strategic and business planning processes bring
stockholder value in any business environment. together the company’s views on energy market conditions to
guide our executive leadership’s decision making and to facilitate
learn more chevron.com/chevronway discussion with the Board of Directors. Included in our strategic
planning are:
• Energy demand and supply projections
• Energy mix projections
• Commodity price outlooks
• Leading indicators such as policy and technology changes
These projections and outlooks are incorporated into portfolio
management, business planning and investment decisions. These
processes indicate that oil and gas are forecasted to continue to
be competitive on price and with scale, reinforcing that Chevron’s
portfolio is robust under multiple scenarios.
Climate change resilience: a framework for decision making
93.2.1 How Chevron approaches future energy demand
primary energy demand
The world’s energy demands are greater today than at any
other time in human history, and they will continue to grow as
from select third-party sources
populations expand, the world’s industrial base grows and
technologies are invented that will need to be powered. 20
According to the IEA’s New Policies Scenario (NPS), energy
demand to 2040 is forecasted to add the demand equivalent
of another China plus India. 2 Energy is one of the fundamental
15
drivers of economic growth and human progress, enabling
access to light, heat, mobility, mechanized agriculture, modern
Thousand mtoe
health systems and technologies.
10
To understand future energy needs, we study different demand
drivers and develop a base case and alternative scenarios. We
routinely use external views to both inform and challenge our 5
internally derived scenarios. Chevron’s views on total primary
energy demand are generally aligned with prominent third-party
projections, such as the IEA’s NPS, IHS’s Rivalry case and Wood
0
Mackenzie’s reference case, as shown in the chart to the right.
2000 2010 2020 2030 2040
IHS Rivalry Scenario (IHS Markit Planning Case)
IEA New Policies Scenario
modeling future Wood Mackenzie Reference Case
demand for oil, gas and Sources, as modified by Chevron Corporation: IEA, World Energy Outlook 2017, iea.org/
weo2017/; IHS Markit, Global Energy Scenarios dataset—Energy Outlook to 2040;
refined products Wood Mackenzie, Energy Market Tool, accessed December 2017.
mtoe = million tonnes of oil-equivalent
Each year, Chevron develops a range of long-term demand
scenarios to inform our views on future oil, gas and refined The world’s energy demands
product prices, test our strategies, and assess business risks.
This process incorporates our proprietary views on the principal
are greater today than at any other
drivers of demand growth, including: time in human history, and they
• Economic indicators like gross domestic product (GDP) growth, will continue
History toIHS
grow asIEA
populations
Wood
income levels and industrial activity in key economies, and expand, the world’s industrial base
changes in global trade
• Capacities of electricity generation and refineries by feedstock grows and technologies are invented
• Use indicators, such as the global vehicle fleet, motor that will need to be powered.
vehicle sales (by type), vehicle miles traveled and airline
passenger miles
• Nonmarket influences on fuel prices, such as taxes
and subsidies
• Carbon prices and other policies and regulations, such as those
IEA scenarios
related to the Paris Agreement Current Policies Scenario (CPS): “an outlook on the basis of just
• Competition from potential substitute products those policies already in place.”
• Other trends that could affect energy consumption, such as
consumer preferences and urbanization New Policies Scenario (NPS): “derived from the policies already
in place and those officially announced.”
Given the complex set of variables and the uncertainties
Sustainable Development Scenario (SDS): “an integrated
associated with forecasting long-term demand, we analyze how
approach to achieving internationally agreed objectives on climate
various factors may combine to accelerate or decelerate trends
change, air quality and universal access to modern energy.”
and use scenarios to stress-test our reference case.
Source: IEA, World Energy Outlook 2017, iea.org/weo2017/.
2 IEA, World Energy Outlook 2017, iea.org/weo2017/.
Climate change resilience: a framework for decision making
103.2.2 How Chevron approaches energy mix projections
IEA 2016 world total primary
Driving economic growth and improved living standards in the
years ahead will require all forms of energy. We have a dedicated
energy mix vs.
team that forecasts the energy mix decades into the future. NPS and SDS in 2040
To generate this outlook, we track and forecast economic and
energy market trends and associated drivers of those trends,
including energy policies and relative energy prices. 2016 (13,760 mtoe)
Oil and gas may fall below today’s 27% 22% oil and
natural gas
share of the energy mix, but most make up
energy experts agree that oil and 54%
natural gas will account for about half 5% of total
primary
of global energy consumption for 10% 32% energy mix
at least the next two decades under 4%
almost any future market scenario—
even one in which policy increasingly
attempts to limit fossil fuel use 2040 NPS (17,584 mtoe)
and reduce GHG emissions.
22%
25% oil and
Chevron’s views on the future energy mix are generally aligned natural gas
make up
with prominent third-party projections like the IEA’s NPS, as
shown in the chart to the right. Similar to the IEA’s NPS, we incor-
6% 52%
of total
porate existing energy policies, as well as an assessment of the 10% primary
results likely to stem from the implementation of announced policy 27% energy mix
10%
intentions, such as those supporting the Paris Agreement.
Energy transitions can take decades,
as the amount of time required 2040 SDS (14,100 mtoe)
to turn over the current consuming
13%
capital stock and redirect investment 25% oil and
to meet global energy demand 10%
natural gas
make up
depends on the asset’s service life. 48%
11% of total
23% primary
For example, a car purchased today can be in service for 12 to 14
energy mix
years, a truck 10 to 30 years, an airplane 30 to 40 years, and a new 18%
building or piece of equipment more than 30 years. 3 In general,
assets are forecasted to be used for their service life, thus tending
to slow diffusion of new technologies and energy transitions. Natural gas
Crude oil and petroleum products
Other renewables
Bioenergy
Nuclear
Coal
Source: IEA, World Energy Outlook 2017, iea.org/weo2017/.
mtoe = million tons of oil-equivalent
3 IEA, Technology Penetration and Capital Stock Turnover, May 2007,
iea.org/publications/freepublications/publication/capital_stock.pdf.
Climate change resilience: a framework for decision making
11world energy flows
Oil and gas have a diverse set of end uses. In some uses, like
aviation, marine, freight and petrochemicals, there
are few, if any, cost-effective and scalable alternatives to oil.
rail
passenger
transport
transport – other
oil aviation
marine
freight
agri, forest, fish
industry use, other
gas
residential
electricity
coal power losses*
commercial
iron and steel
nuclear
combined heat and power
industry industry – other
geothermal heat
solar, wind
hydro chemical, petchem
biofuels, non-energy use – other
waste non-energy use* nonspecified use*
58% 42%
Transportation accounts for about The remaining 42 percent of global
6 Chevron Confidential – Restricted Access
58 percent of current global oil consumption is used
oil consumption. About 25 percent to fuel tractors, create fertilizers
of global oil consumption is and fuel industrial processes.
used in personal vehicles, 21 percent About 13 percent of global oil
in transporting goods or services, consumption is used as a feedstock
and 12 percent in airplanes. for the petrochemical sector.
*Power losses = Losses in gas distribution, electricity transmission and coal transport. Non-Energy Use = Those fuels that are used as raw materials in the different sectors and are not consumed as a fuel
or transformed into another fuel. Non-energy use is shown separately in final consumption under the heading non-energy use. Non-Specified = includes all fuel use not elsewhere specified as well as
consumption in the above-designated categories for which separate figures have not been provided. Military fuel use for all mobile and stationary consumption is included here (e.g., ships, aircraft, roads
and energy used in living quarters) regardless of whether the fuel delivered is for the military of that country or for the military of another country.
Based on data from: IEA, 2015 World Balance and Final Consumption dataset, iea.org/sankey/, modified by Chevron Corporation.
Climate change resilience: a framework for decision making
123.2.3 How Chevron approaches energy demand drivers
economic growth
We track and analyze demand drivers to understand which sources
of energy supply are likely to meet expected demand. We believe
and energy use per capita
choices will be primarily determined by the economics of each
energy supply source, which are influenced by the intersection of 300
policy, technology and consumer trends. Canada
U.S.
Population growth and increasing standards of living: There
is a positive correlation between population growth and energy
South Korea
Annual mmbtu per capita
demand. And as more people’s incomes increase and they 200 Russia
gain access to personal mobility, electricity and appliances,
energy demand increases. France
Germany
Japan
Over the next decade, nearly 100 Italy U.K.
China
40 percent of the world’s population
is expected to enter the critical
$3,000 to $10,000 per capita GDP India
threshold, where energy demand 0
accelerates (see chart at right). $0 $10,000 $20,000 $30,000 $40,000 $50,000
GDP per capita in real 2011 U.S. dollars using purchasing power parity
Policy: Policies, like those that support the Paris Agreement, can
Solid lines indicate historical trend for
change the amount of energy consumed, the growth rate of energy specified country starting in 1980
demand, the energy mix and the relative economics of one fuel Representative growth trend
versus another.
Growth of the middle class is accelerated by industrialization and urbanization.
Industrialization creates opportunities that draw people to cities for well-paying jobs,
• E
nergy efficiency improvements are expected to have the largest which then drive growth in energy demand.
moderating impact on energy demand growth. Improvements Sources, as modified by Chevron Corporation: Energy data based on IEA data from
Online Data Service, OECD/IEA 2016, iea.org/statistics, license: iea.org/t&c; GDP data
in energy intensity continue to accelerate due to targeted policy based on data from International Monetary Fund, World Economic Outlook Database,
October 2017.
initiatives, like vehicle efficiency standards and standards for
mmbtu = million British thermal units
power, the industrial sector and consumer products. These energy
intensity improvements are highest in emerging markets, in
which starting efficiency and urbanization levels are lowest. You
can read more about what Chevron does on energy efficiency
in Section 4.1, Energy Efficiency, on Page 35.
• Fuel mandates, like renewable portfolio standards, renewable
fuel standards and low-carbon-fuel standards, can change
the fuel mix by requiring certain types of energy sources. Fuel
mandates can be driven by concerns other than climate, such as
energy security and other environmental concerns like air quality.
• Cost effects like carbon pricing, renewable feed-in tariffs and
fuel taxes often increase the cost of using fossil fuels and
can affect the relative economics of the fuel mix. Particularly
for biofuels, economics may be affected by value from policy-
driven compliance credits. When economical, we pursue biofuels
opportunities, such as renewable diesel, which you can read
more about in Section 4.3, Renewable Energy, on Page 37.
Climate change resilience: a framework for decision making
13Technology: Improvements in technology can lead to cost Consumer behavior: Changes in consumer behavior can increase
reductions that can influence the forecasted energy mix. or moderate energy use. For example, vehicle choice and use
Reductions in the cost of energy attributable to technology patterns can affect demand for refined products. In large vehicle
advancements can increase demand for that energy type markets like the United States, the vehicle fleet turns over about
and improve relative competitiveness. every 12 to 14 years. If, however, consumers start to replace vehicles
more frequently or choose to purchase an electric vehicle (or to not
own a vehicle at all), growth in the demand for liquid transportation
fuels could change. Urban planning, car-sharing businesses and
the ongoing development of autonomous vehicles will influence
how consumers approach mobility in the future.
3.2.4 How Chevron approaches demand for specific resources
View on oil
In 2016, global liquid fuel demand was 97.5 million barrels per day
(mmbd), which included 78 mmbd of crude oil, 14 mmbd of natural
chevron and technology gas liquids, 3 mmbd of non-petroleum-based fuels like biofuels and
2.5 mmbd of refinery processing gains.4 Oil demand has grown at
Chevron is engaged in every step of the energy technology a rate of about 1 mmbd, or 1 percent per year, over the past 20 to
development chain, from early-stage research to industrial- 30 years, 5 but the IEA’s NPS shows oil demand growing at a more
scale applications.
modest pace in the future, due to slower economic growth, aging
Chevron Energy Technology Company (ETC) populations in traditional oil-consuming centers like Europe, Japan
and the United States, and policy-driven efforts to increase vehicle
Chevron was the first international oil company (IOC) with an
efficiency and alternative fuel penetration.
integrated technology company that develops and manages
technology across the business. ETC invests in fundamental
research and development in partnership with world-class
universities and laboratories. Our industry experts are working
in collaboration with academic experts globally.
chevron’s view of the peak
Chevron Technology Ventures (CTV)
Chevron was the first IOC with a venture capital arm. CTV scans The concept of “peak demand” has been gaining traction
the globe to identify promising startups that can help develop among some industry analysts, academics and industry critics.
emerging energy technologies we can test and transfer into Third-party projections for peak demand are often driven by
our company. We know that new ideas can come from anywhere, assumptions like the rapid adoption of electric vehicles (EVs),
from any industry, at any time, so we take an open-innovation accelerated growth in the use of new mobility models (e.g.,
approach to technology development and work in close ride sharing), policies that could favor EVs or renewables, higher
collaboration with our operations worldwide. oil and gas prices, and the dramatic reduction in the cost of
renewable power. These scenarios assume rapid technological
CTV screens several hundred opportunities and formally change in categories that ultimately only account for a portion
evaluates up to 200 of these opportunities per year. In doing of global oil consumption, such as light-duty vehicles.
so, we are positioning Chevron to compete profitably within
In order to force an oil peak demand in the next two decades, a
the future energy landscape as those technologies become
series of critical demand-reducing factors would need to occur
economical and competitive. As an example, in 2016, we invested
simultaneously, apply across the entire slate of oil products
in Novvi LLC to develop, market and distribute high-performance
and move at an unprecedented pace. Such a confluence of events
oils and lubricants from renewable sources.
in the next two decades would represent a historic and
unprecedented revolution.
Although current trends warrant consistent monitoring, they
also suggest that peak demand is unlikely in the near or
intermediate future.
4 IHS, Annual Long-Term Strategic Workbook, May 2017, copyright IHS 2018, used with permission.
5 IEA, World Energy Outlook 2017, iea.org/weo2017/.
Climate change resilience: a framework for decision making
14View on gas
world natural gas demand
In 2016, demand for natural gas was 3,635 billion cubic meters.6
by IEA scenario
Growth in natural gas demand 6
is driven by an abundant low-cost
resource, a desire among key energy 5
consumers to diversify fuel
4
sources and efforts in some juris-
Thousand bcm
dictions to reduce air pollution. 3
The IEA’s NPS forecasts gas demand to grow by 45 percent 2
between 2016 and 2040, as shown in the chart to the right, with Forecast 2017–2040
80 percent of the growth coming from developing countries such 1
as China, India and other countries in Asia.7 You can read more
about gas demand in the IEA’s SDS on Page 32.
0
2000 2010 2020 2030 2040
There are potential risks to the role of gas in the power sector,
including lower-cost coal and renewables penetration. Never-
IEA Current Policies Scenario
theless, we see sustained growth for gas in the industrial sector
IEA New Policies Scenario
because gas is better positioned to provide high-temperature heat
IEA Sustainable Development Scenario
when compared with renewables. Gas has the advantage over
Source: IEA, World Energy Outlook 2017, iea.org/weo2017/.
refined products on price and over coal on emissions.8
bcm = billion cubic meters
View on refined products
Transportation fuels and petrochemicals have accounted for nearly change in global oil demand
95 percent of the growth in global oil demand since 2000 and by sector in the IEA’s NPS
are expected to underpin sustained growth in demand over the
next two decades. 6
Demand for high-value petro-
4
chemicals, used to produce plastics,
resins and fibers (among other
products), is projected to rise by
mmbd
2
60 percent between 2016
and 2040 under the IEA’s NPS.9
0
According to the IEA, “[t]he increase could be greater still if, for
example, innovation in chemical products triggers further substitu-
tion away from other materials (metals, wood) or if a much higher –2
number of EVs are sold (electric vehicles tend to require more plastic 2010–15 2015–20 2020–25 2025–30 2030–35 2035–40
than conventional cars).” 10 As shown in the chart to the right, oil use
for aviation, shipping and road freight is expected to grow in the Other Road freight
decades ahead, even with continued improvements in efficiency. Power generation Passenger vehicles*
Buildings Industry
Petrochemicals Total
6 IEA, World Energy Outlook 2017, iea.org/weo2017/. Aviation, shipping
7 Ibid.
8 According to the IEA, World Energy Outlook 2017, iea.org/weo2017/, “The combustion of natural *Passenger vehicles include passenger cars, two- and three-wheelers, and buses.
gas results in emissions saving of some 40 percent relative to coal for each unit of energy output.”
9 IEA, World Energy Outlook 2017, iea.org/weo2017/. Source: IEA, World Energy Outlook 2017, iea.org/weo2017/.
10 Ibid. mmbd = million barrels per day
Climate change resilience: a framework for decision making
15global liquids long-term supply curve and average
point forward breakeven prices in 2026
Canada
(oil sands)
Deepwater
OPEC
$120 GTL
CTL
Shallow water Frontier
OPEC
Deepwater
Point forward breakeven price range, $ per bbl Brent
$100 non-OPEC
Other U.S.
(lower 48)
$80
Shallow
water
non-OPEC U.S.
$60 (lower 48)
Onshore OPEC Onshore tight oil
non-OPEC
$40 Iran Russia
Saudi Arabia Iraq
$20
$0
0 10 20 30 40 50 60 70 80 90 100
Cumulative liquids capacity 2026 (mmbd)
Average point forward breakeven price
Liquids supply shown above includes crude oil, natural gas liquids (NGLs), coal-to-liquids (CTLs) and gas-to-liquids (GTLs).
Point forward breakeven is the amount of capital needed to produce the resource from today forward. This differs from full-cycle breakeven, which “includes all costs for developing a new field.”
For a further discussion of breakeven calculations, see Energy Economics, Tight oil market dynamics: Benchmarks, breakeven points, and inelasticities, 2017.
Sources, as modified by Chevron Corporation: IEA, World Energy Outlook 2017, iea.org/weo2017/; Wood Mackenzie, Oil Supply Tool, February 2017.
mmbd = million barrels per day
bbl = barrel
3.2.5 How Chevron approaches future energy supply Oil
A common way to represent oil and gas supply is a supply curve by In 2016, total global liquid fuel demand was 97.5 mmbd, of which
resource type, in which the width of the bar represents the amount 78 mmbd was crude oil.11
of total production for a given year and the height of the bar
indicates the price range over which that resource is economical Although the disruptive potential of demand-side technologies
to produce. Similar types of resources, or resources from certain often gets the headlines, the effect of supply-side technologies—
regions, are grouped together and thus show a range of prices more specifically, the unconventional-oil and -gas revolution in the
instead of a single price. In a more detailed and expanded version, United States—has been more impactful. According to the IEA, the
every field is its own bar on the supply stack. Assets can move increase in tight oil production and its forecasted continued growth
relative to one another up and down the supply stack when their “would be about as fast as the rise in output from Saudi Arabia
breakeven values change due to technology, geopolitical and between 1966 and 1981.” 12 Less than a decade ago, the oil and gas
policy changes, fiscal terms, or other reasons. industry was operating in a paradigm of scarcity. Experts were
focused on peak oil supply, and the business was largely focused
on finding frontier resources and increasing production. Today,
the industry is in a time of relative abundance, and asset classes
like tight oil have moved down and to the left, or to the lower-
cost portion, on the supply curve. Fiscal terms and geopolitical
conditions can have an outsized impact on the cost of supply and
are another way in which individual assets can move left or right on
the supply curve relative to other assets.
11 IHS, Annual Long-Term Strategic Workbook, May 2017, copyright IHS 2018, used with permission.
12 IEA, World Energy Outlook 2017, iea.org/weo2017/.
Climate change resilience: a framework for decision making
16You can also read