STATE OF THE CLIMATE IN 2019 - THE TROPICS H. J. Diamond and C. J. Schreck, Eds - American Meteorological Society
←
→
Page content transcription
If your browser does not render page correctly, please read the page content below
STATE OF THE CLIMATE IN 2019
             THE TROPICS
             H. J. Diamond and C. J. Schreck, Eds.

                                                                                                                                               Downloaded from http://journals.ametsoc.org/bams/article-pdf/101/8/S185/4991599/bamsd200077.pdf by guest on 09 November 2020

Special Online Supplement to the Bulletin of the American Meteorological Society, Vol.101, No. 8, August, 2020

https://doi.org/10.1175/BAMS-D-20-0077.1
Corresponding author: Howard J. Diamond / howard.diamond@noaa.gov
©2020 American Meteorological Society
For information regarding reuse of this content and general copyright information, consult the AMS Copyright Policy.

                AU G U S T 2 0 2 0 | S t a t e o f t h e C l i m a t e i n 2 0 1 9                                     4. THE TROPICS   S185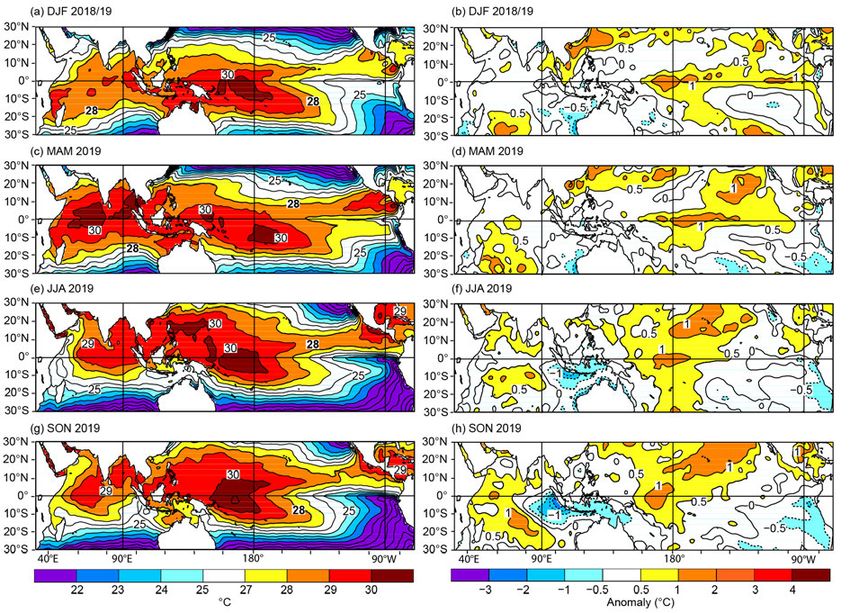
STATE OF THE CLIMATE IN 2019
                             The Tropics

                                                                         Editors

                                                                     Jessica Blunden
                                                                      Derek S. Arndt

                                                                                                                Downloaded from http://journals.ametsoc.org/bams/article-pdf/101/8/S185/4991599/bamsd200077.pdf by guest on 09 November 2020
                                                                     Chapter Editors

                                                                 Peter Bissolli
                                                             Howard J. Diamond
                                                          Matthew L. Druckenmiller
                                                              Robert J. H. Dunn
                                                              Catherine Ganter
                                                               Nadine Gobron
                                                                 Rick Lumpkin
                                                         Jacqueline A. Richter-Menge
                                                                     Tim Li
                                                              Ademe Mekonnen
                                                             Ahira Sánchez-Lugo
                                                               Ted A. Scambos
                                                               Carl J. Schreck III
                                                            Sharon Stammerjohn
                                                              Diane M. Stanitski
                                                                Kate M. Willett

                                                                     Technical Editor

                                                                     Andrea Andersen

                                                   BAMS Special Editor for Climate

                                                                      Richard Rosen

                                                 American Meteorological Society

AU G U S T 2 0 2 0 | S t a t e o f t h e C l i m a t e i n 2 0 1 9                      4. THE TROPICS   S186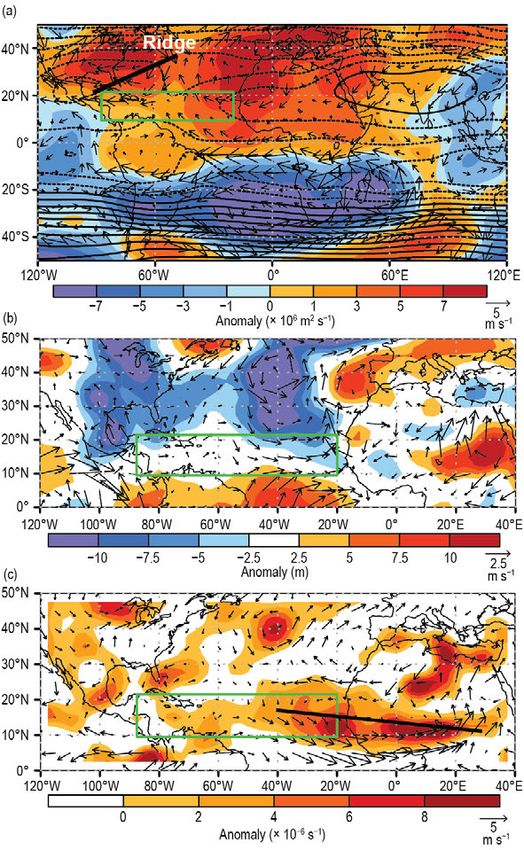
Cover credit:
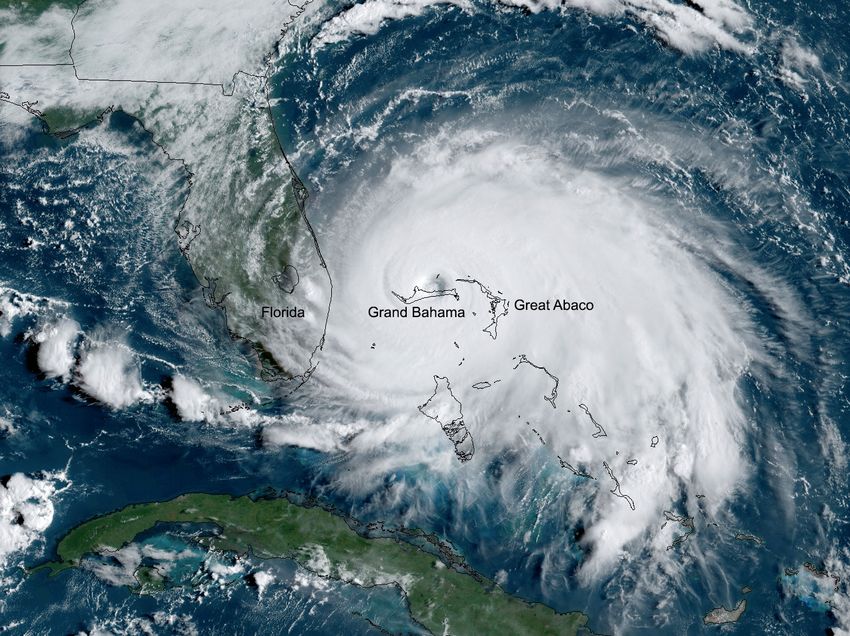
Catastrophic Hurricane Dorian slowed to a crawl over Grand Bahama Island overnight and into Labor Day. On
Monday, September 2, 2019, GOES East captured a view of the Category 5 storm over Grand Bahama.
This GeoColor-enhanced imagery was created by NOAA's partners at the Cooperative Institute for Research in the
Atmosphere. The GOES East geostationary satellite, also known as GOES-16, provides coverage of the Western
Hemisphere, including the United States, the Atlantic Ocean and the eastern Pacific. The satellite's high-resolution
imagery provides optimal viewing of severe weather events, including thunderstorms, tropical storms, and hurricanes.
© NOAA
Downloaded from http://journals.ametsoc.org/bams/article-pdf/101/8/S185/4991599/bamsd200077.pdf by guest on 09 November 2020
The Tropics is one chapter from the State of the Climate in 2019 annual report and is available
from https://doi.org/10.1175/BAMS-D-20-0077.1. Compiled by NOAA’s National Centers for
Environmental Information, State of the Climate in 2019 is based on contributions from
scientists from around the world. It provides a detailed update on global climate indicators,
notable weather events, and other data collected by environmental monitoring stations and
instruments located on land, water, ice, and in space. The full report is available from
https://doi.org/10.1175/2020BAMSStateoftheClimate.1.
How to cite this document:
Citing the complete report:
Blunden, J. and D. S. Arndt, Eds., 2020: State of the Climate in 2019. Bull. Amer. Meteor. Soc.,
101 (8), Si–S429, https://doi.org/10.1175/2020BAMSStateoftheClimate.1.
Citing this chapter:
Diamond, H.J. and C. J. Schreck, Eds., 2020: The Tropics [in “State of the Climate in 2019”].
Bull. Amer. Meteor. Soc., 101 (8), S185–S238, https://doi.org/10.1175/BAMS-D-20-0077.1.
Citing a section (example):
Chen, L., J. -J Luo, and A. D. Magee, 2020: Indian Ocean dipole [in “State of the Climate in
2019"]. Bull. Amer. Meteor. Soc., 101 (8), S229–S232, https://doi.org/10.1175/BAMS-D-20-0077.1.
AU G U S T 2 0 2 0 | S t a t e o f t h e C l i m a t e i n 2 0 1 9 4. THE TROPICS S187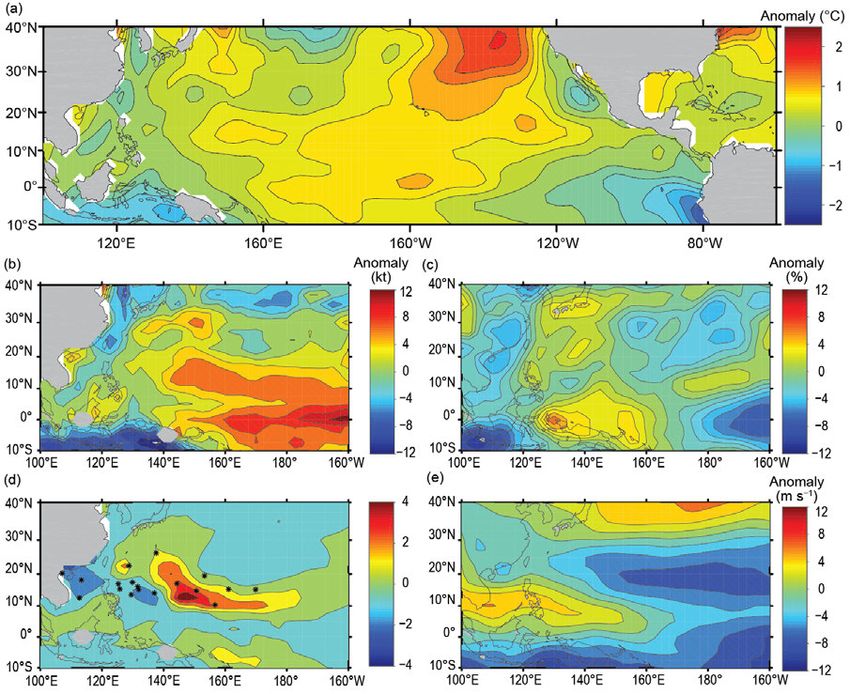
Editor and Author Affiliations (alphabetical by name)

Baxter, Stephen, NOAA/NWS Climate Prediction Center, College Park,                   Landsea, Chris W., NOAA/NWS National Hurricane Center, Miami, Florida
    Maryland                                                                         Lin, I.-I., National Taiwan University, Taipei, Taiwan
Bell, Gerald D., NOAA/NWS Climate Prediction Center, College Park, Maryland          Lorrey, Andrew M., National Institute of Water and Atmospheric Research,
Blake, Eric S., NOAA/NWS National Hurricane Center, Miami, Florida                        Ltd., Auckland, New Zealand
Bringas, Francis G., NOAA/OAR Atlantic Oceanographic and Meteorological              Luo, Jing-Jia, Institute for Climate and Application Research (ICAR)/KLME/
    Laboratory, Miami, Florida                                                            ILCEC/CIC-FEMD, Nanjing University of Information Science and Technology,
Camargo, Suzana J., Lamont-Doherty Earth Observatory, Columbia University,                Nanjing, China
    Palisades, New York                                                              Magee, Andrew D., Centre for Water, Climate and Land, School of
Chen, Lin, Institute for Climate and Application Research (ICAR)/KLME/ILCEC/              Environmental and Life Sciences, University of Newcastle, Callaghan, NSW,
    CIC-FEMD, Nanjing University of Information Science and Technology,                   Austrailia
    Nanjing, China                                                                   Pasch, Richard J., NOAA/NWS National Hurricane Center, Miami, Florida
Coelho, Caio A. S., CPTEC/INPE Center for Weather Forecasts and Climate              Pearce, Petra R., National Institute of Water and Atmospheric Research, Ltd.,
    Studies, Cachoeira Paulista, Brazil                                                   Auckland, New Zealand
Diamond, Howard J., NOAA/OAR Air Resources Laboratory, College Park,                 Pezza, Alexandre B., Greater Wellington Regional Council, Wellington, New

                                                                                                                                                                         Downloaded from http://journals.ametsoc.org/bams/article-pdf/101/8/S185/4991599/bamsd200077.pdf by guest on 09 November 2020
    Maryland                                                                              Zealand
Domingues, Ricardo, Cooperative Institute for Marine and Atmospheric                 Rosencrans, Matthew, NOAA/NWS Climate Prediction Center, College Park,
    Studies, University of Miami, Miami, Florida                                          Maryland
Goldenberg, Stanley B., NOAA/OAR/AOML Hurricane Research Division,                   Schreck III, Carl J., North Carolina State University, Cooperative Institute for
    Miami, Florida                                                                        Climate and Satellites – North Carolina (CICS-NC), Asheville, North Carolina
Goni, Gustavo, NOAA/OAR/AOML Hurricane Research Division, Miami, Florida             Trewin, Blair C., Australian Bureau of Meteorology, Melbourne, Victoria,
Fauchereau, Nicolas, National Institute of Water and Atmospheric Research,                Australia
    Ltd., Auckland, New Zealand                                                      Truchelut, Ryan E., “WeatherTiger,” Tallahassee, Florida
Halpert, Michael S., NOAA/NWS Climate Prediction Center, College Park,               Wang, Bin, Department of Atmospheric Science and IPRC, University of Hawaii,
    Maryland                                                                              Honolulu, Hawaii
He, Qiong, Earth System Modeling Center, Nanjing University of Information           Wang, H., NOAA/NWS Climate Prediction Center, College Park, Maryland
    Science and Technology, Nanjing, China                                           Wood, Kimberly M., Department of Geosciences, Mississippi State University,
Klotzbach, Philip J., Department of Atmospheric Science, Colorado State                   Starkville, Mississippi
    University, Fort Collins, Colorado                                               Woolley, John-Mark, National Institute of Water and Atmospheric Research,
Knaff, John A., NOAA/NESDIS Center for Satellite Applications and Research,               Ltd., Auckland, New Zealand
    Fort Collins, Colorado
L'Heureux, Michelle, NOAA/NWS Climate Prediction Center, College Park,
    Maryland

  Editoral and Production Team

Andersen, Andrea, Technical Editor, Innovative Consulting and Management             Misch, Deborah J., Graphics Support, Innovative Consulting and Management
    Services, LLC, NOAA/NESDIS National Centers for Environmental                        Services, LLC, NOAA/NESDIS National Centers for Environmental
    Information, Asheville, North Carolina                                               Information, Asheville, North Carolina
Griffin, Jessicca, Graphics Support, Cooperative Institute for Satellite Earth       Riddle, Deborah B., Graphics Support, NOAA/NESDIS National Centers for
    System Studies, North Carolina State University, Asheville, North Carolina           Environmental Information, Asheville, North Carolina
Hammer, Gregory, Content Team Lead, Communications and Outreach, NOAA/               Veasey, Sara W., Visual Communications Team Lead, Communications and
    NESDIS National Centers for Environmental Information, Asheville, North              Outreach, NOAA/NESDIS National Centers for Environmental Information,
    Carolina                                                                             Asheville, North Carolina
Love-Brotak, S. Elizabeth, Lead Graphics Production, NOAA/NESDIS National
    Centers for Environmental Information, Asheville,
    North Carolina

                AU G U S T 2 0 2 0 | S t a t e o f t h e C l i m a t e i n 2 0 1 9                                                        4. THE TROPICS         S188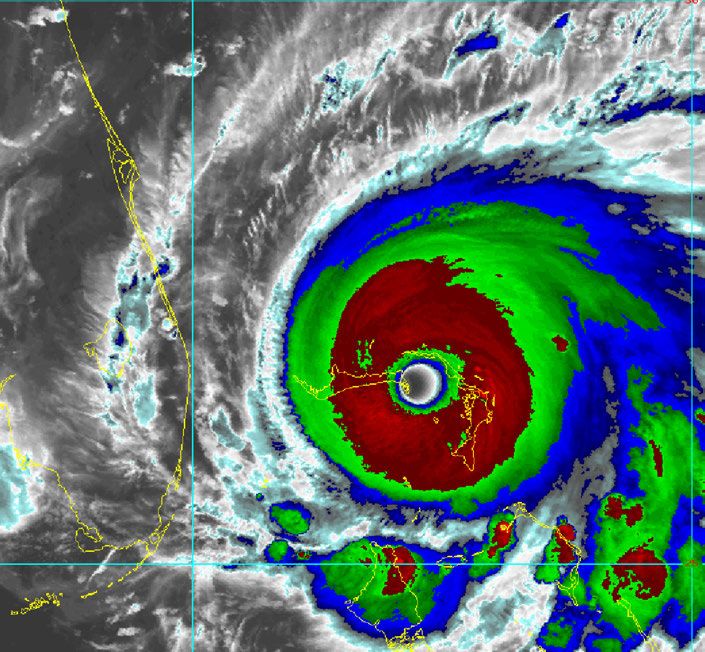
4. Table of Contents

List of authors and affiliations...................................................................................................S188
a. Overview .................................................................................................................................S190
b. ENSO and the tropical Pacific................................................................................................. S191
		 1. Oceanic conditions...................................................................................................... S192
		 2. Atmospheric circulation, temperature, and precipitation
			 anomalies during December–February 2018/19........................................................ S193
		 3. Atmospheric circulation, temperature, and precipitation anomalies during
			 March–May through September–November 2019...................................................S194
c. Tropical intraseasonal activity................................................................................................ S195

                                                                                                                                                             Downloaded from http://journals.ametsoc.org/bams/article-pdf/101/8/S185/4991599/bamsd200077.pdf by guest on 09 November 2020
d. Intertropical convergence zones............................................................................................S198
		 1. Pacific...........................................................................................................................S198
		 2. Atlantic........................................................................................................................ S199
e. Global monsoon summary......................................................................................................S200
f. Tropical cyclones.......................................................................................................................S203
		 1. Overview.....................................................................................................................S203
		 2. Atlantic basin..............................................................................................................S204
     Sidebar 4.1: Hurricane Dorian: A devastating hurricane
		 for the northwest Bahamas............................................................................................S210
		 3. Eastern North Pacific and Central North Pacific basins............................................ S212
		 4. Western North Pacific basin.......................................................................................S214
		 5. North Indian Ocean basin..........................................................................................S219
		 6. South Indian Ocean basin..........................................................................................S221
		 7. Australian basin...........................................................................................................S223
		 8. Southwest Pacific basin..............................................................................................S225
g. Tropical cyclone heat potential..............................................................................................S227
h. Indian Ocean dipole................................................................................................................S229
Appendix: Acronym List..............................................................................................................S233
References....................................................................................................................................S235

*Please refer to Chapter 8 (Relevant datasets and sources) for a list of all climate variables and
datasets used in this chapter for analyses, along with their websites for more information and
access to the data.

  AU G U S T 2 0 2 0 | S t a t e o f t h e C l i m a t e i n 2 0 1 9                                                                 4. THE TROPICS   S189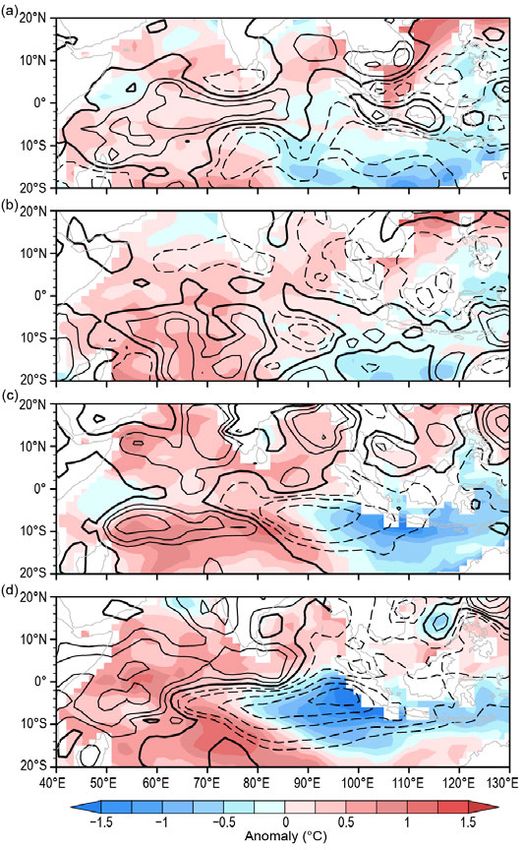
4. THE TROPICS
H. J. Diamond and C. J. Schreck, Eds.

a. Overview— H. J. Diamond and C. J. Schreck
   The tropics in 2019 featured a weak El Niño event that began in January and ended in July.
Neutral ENSO conditions prevailed for the remainder of the year, although sea surface tempera-
tures (SSTs) remained above normal in the central Pacific. The Oceanic Niño Index (ONI) met the
+0.5°C threshold for El Niño during September–December 2018 and November–December 2019.
However, the ocean–atmosphere coupling, normally an intrinsic aspect of El Niño, was missing
during both periods.

                                                                                                                Downloaded from http://journals.ametsoc.org/bams/article-pdf/101/8/S185/4991599/bamsd200077.pdf by guest on 09 November 2020
   For the global tropics, combined land and ocean surface temperatures (measured 20°N–20°S)
registered +0.47°C above the 1981–2010 average. This makes 2019 the third-warmest year for the
tropics since records began in 1880, and the warmest since 2016. Data from the Global Precipita-
tion Climatology Project indicate a mean annual total precipitation value of 1317 mm across the
20°N–20°S latitude band over land. This is 11 mm above the 1981–2010 average and ranks in the
middle tercile of the 1979–2019 period of record.
   Globally, 96 named tropical cyclones (TCs; ≥34 kt; or 17 m s−1) were observed during the 2019
Northern Hemisphere (NH) season (January–December 2019) and the 2018/19 Southern Hemi-
sphere (SH) season (July–June 2018/19; Table 4.2), as documented in IBTrACSv4 (Knapp et al.
2010). Overall, this number was well above the 1981–2010 global average of 82 TCs and similar to
the 95 TCs reported during 2018 (Diamond and Schreck 2019).
   In terms of Accumulated Cyclone Energy (ACE; Bell et al. 2000), each NH basin was above its
1981–2010 average. The North and South Indian Ocean basins were in the top 10% of ACE recorded
for those basins at 85 × 104 kt2 and 154 × 104 kt2, respectively; and in fact, the ACE value in the
North Indian Ocean was the highest on record. In the western North Pacific, seven storms (six of
Category 5 intensity) out of a total of 28 accounted for 71% of the above-average seasonal ACE of
341 × 104 kt2. The North Atlantic basin had an ACE of nearly 145% of its 1981–2010 median value
but was well below the 241% of median recorded in 2017 (Bell et al. 2018). Category 5 Hurricanes
Dorian and Lorenzo alone accounted for >60% of the 2019 total. The Australian and southwest
Pacific basins were fairly quiet; each had an ACE that was below normal but still within the
middle tercile. The global total was near normal for 1981–2010 with 795 × 104 kt2. Five TCs across
the globe reached Saffir–Simpson Hurricane Wind Scale (SSHWS) Category 5 intensity level—two
in the North Atlantic and three in the western North Pacific.
   From a socio-economic standpoint, the five Category 5 storms were significant in their effects.
Hurricane Dorian caused unprecedented and tremendous devastation, with over 70 fatalities and
damages totaling $3.4 billion (U.S. dollars). Hurricane Lorenzo as a post-tropical/extratropical
cyclone was the second-deadliest storm of the 2019 North Atlantic season, causing 19 deaths.
However, major impacts are not relegated to Category 5 storms, and Super Typhoon Faxai dem-
onstrated that with total damages estimated at $9.3 billion (U.S. dollars). Faxai was one of the
strongest typhoons on record to affect Tokyo, Japan, killing three people and injuring 147, causing
extensive blackouts, and damaging more than 40 000 homes
   The Indian Ocean dipole (IOD), an inherent air–sea coupling mode in the tropical Indian
Ocean, exhibited its greatest magnitude recorded since 1997, which was under extremely strong
El Niño conditions. The unique feature of the 2019 IOD event was that it occurred during neutral
ENSO conditions.

 AU G U S T 2 0 2 0 | S t a t e o f t h e C l i m a t e i n 2 0 1 9                     4. THE TROPICS   S190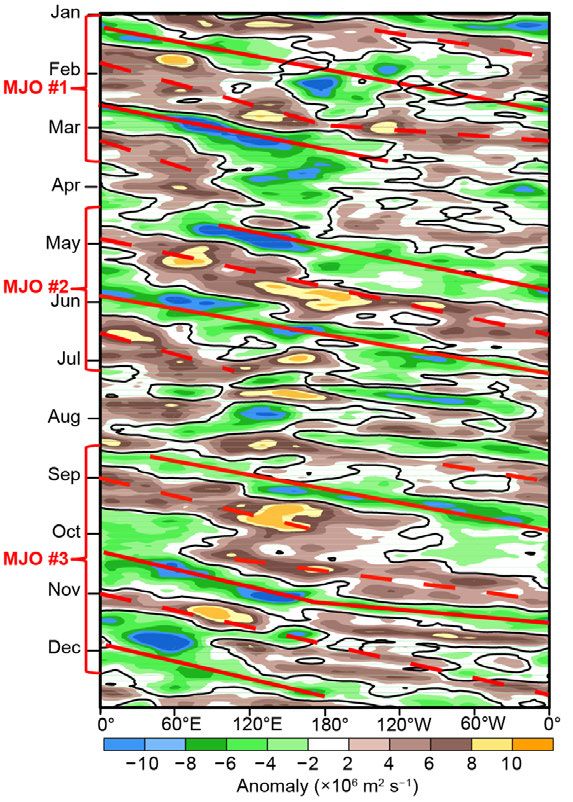
In addition, tropical intraseasonal variability was especially prominent, with three distinct pe-
riods of Madden-Julian Oscillation (MJO) activity spanning a total of approximately eight months.
   The editors of this chapter would like to insert a personal note recognizing the passing of a
past author of the Tropics Chapter. Our colleague and good friend A. Brett Mullan died of cancer
on 22 April 2020. Brett was a mainstay of this chapter having stewarded the section on the Pacific
Intertropical Convergence Zone from 2006 to 2018. Brett worked for New Zealand’s National Insti-
tute of Water and Atmosphere and made significant contributions and authored seminal papers
in meteorology. These included the analysis of SH climate and circulation variability over inter-
annual (El Niño–Southern Oscillation [ENSO]) to interdecadal (interdecadal Pacific Oscillation)
timescales. His work in documenting the relationships of climate variability to long-term global
teleconnections has been a basis for seasonal climate prediction for New Zealand commencing in
the 1990s. He carried out research into climate change and modeling, with particular emphasis
on SH and New Zealand regional effects (Southern Oscillation, greenhouse warming, ocean–at-
mosphere coupled models and decadal variability, and integrated climate impact models). Over

                                                                                                                  Downloaded from http://journals.ametsoc.org/bams/article-pdf/101/8/S185/4991599/bamsd200077.pdf by guest on 09 November 2020
his 40-year career, Brett’s contributions to meteorology and climate science and beyond were
tremendous. His outstanding work and significant scientific contributions will be his legacy,
and he will be greatly missed.

b. ENSO and the tropical Pacific— M. L’Heureux, G. D. Bell, and M. S. Halpert
   The El Niño–Southern Oscillation (ENSO) is a coupled ocean–atmosphere climate phenomenon
over the tropical Pacific Ocean, with opposite phases called El Niño and La Niña. For historical
purposes, NOAA’s Climate Prediction Center (CPC) classifies and assesses the strength and dura-
tion of El Niño and La Niña using the Oceanic Niño Index (ONI; shown for mid-2018 through 2019
in Fig. 4.1). The ONI is the 3-month (seasonal) running average of sea surface temperature (SST)
anomalies in the Niño-3.4 region (5°N–5°S, 170°–120°W), currently calculated as the departure
from the 1986–2015 base period mean. El Niño is classified when the ONI ≥ +0.5°C for at least five
consecutive, overlapping seasons. La Niña is similarly defined but for ONI ≤ −0.5°C.
   Using the ONI, the minimum threshold for El Niño was reached in September–November (SON)
2018, but the CPC did not declare the onset of El Niño until ocean–atmosphere coupling became
evident in January 2019 (Bell et al. 2019). ONI
values peaked and remained near +0.8°C for
five overlapping seasons (October–Decem-
ber [OND] until March–May [MAM]), then
decreased before El Niño ended in May–July
(MJJ) 2019. This episode was categorized as
weak because the ONI remained between
+0.5°C and +0.9ºC.
   The ONI remained positive throughout
2019, and the central Pacific remained
warmer than usual. However, the remainder
of the year was classified as ENSO-neutral
as ONI values decreased to a minimum of
+0.1°C during July–September (JAS) and
August–October (ASO). During the autumn
and early winter, the ONI increased to +0.5°C Fig. 4.1. Time series of the ONI (ºC) from mid-2018 through 2019.
                                                 Overlapping 3-month seasons are labeled on the x-axis, with
in OND and +0.6°C in November–January initials indicating the first letter of each month in the season. Red
(NDJ), but the ocean–atmosphere coupling, bars indicate positive values in excess of +0.5ºC. ONI values are
which is normally an intrinsic aspect of El derived from the ERSST-v5 dataset (Huang et al. 2017) and are
Niño, was not present during this season.        based on departures from the 1986–2015 period monthly means.

  AU G U S T 2 0 2 0 | S t a t e o f t h e C l i m a t e i n 2 0 1 9                      4. THE TROPICS   S191
1) Oceanic conditions
   Seasonal sea surface temperatures (SSTs) and anomalies during December–February (DJF)
2018/19 through SON 2019 are shown in Fig. 4.2. The El Niño during DJF and MAM is indicated
by positive SST anomalies across the central and eastern equatorial Pacific Ocean (Figs. 4.2a–d).
Throughout the event, anomalies exceeding +1.0°C were seen in the central and east-central
equatorial Pacific. These conditions reflected a weaker-than-average equatorial cold tongue in
the eastern Pacific and an eastward expansion of the western Pacific warm pool (approximated
by SSTs above 29°C) to well east of the date line (near 160°W; Fig. 4.2d).
   Following the demise of El Niño, equatorial SST anomalies in the central Pacific Ocean re-
mained quite high (near or above +1.0°C) throughout the year, while the anomalies decreased
in the eastern equatorial Pacific, returning to near zero during June–August (JJA) and SON 2019
(Figs. 4.2f,h). A sizable region of 30°C temperatures covered the western equatorial Pacific Ocean,
extending to the date line (Figs. 4.2e,g). Correspondingly, SST anomalies increased to +1.5°C in
the western equatorial Pacific (~170°E) during SON (Fig. 4.2h).

                                                                                                                    Downloaded from http://journals.ametsoc.org/bams/article-pdf/101/8/S185/4991599/bamsd200077.pdf by guest on 09 November 2020
   Consistent with the SST evolution, subsurface temperatures during DJF 2018/19 and MAM 2019
were above average across most of the equatorial Pacific (Figs. 4.3a,b). This warming reflected
deepening of the oceanic thermocline and reduced upwelling that accompanies El Niño. Although
ENSO-neutral conditions returned by summer, temperature anomalies near the date line remained
greater than +1.0°C between the surface and 150-m depth (Figs. 4.3c,d).
   In contrast, in the far eastern equatorial Pacific, the thermocline was shallower than average,
consistent with the below-average temperatures in this region during JJA (Fig. 4.3c). By SON,
the thermocline and subsurface temperatures were near average across most of the equatorial
Pacific Ocean.

Fig. 4.2. Seasonal SST (left) and anomaly (right) for (a),(b) DJF 2018/19, (c),(d) MAM 2019, (e),(f) JJA
2019, and (g),(h) SON 2019. Contour interval for SST is 1°C. For SST anomaly, contour interval is 0.5°C
for anomalies between ±1ºC, and 1ºC for anomalies > 1ºC and < −1ºC. Anomalies are departures from
the 1981–2010 seasonal adjusted OI climatology (Reynolds et al. 2002).

 AU G U S T 2 0 2 0 | S t a t e o f t h e C l i m a t e i n 2 0 1 9                         4. THE TROPICS   S192
Downloaded from http://journals.ametsoc.org/bams/article-pdf/101/8/S185/4991599/bamsd200077.pdf by guest on 09 November 2020
Fig. 4.3. Equatorial depth–longitude section of Pacific Ocean temperature anomalies (°C) from the
1981–2010 mean averaged between 5°N and 5°S during (a) DJF 2018/19, (b) MAM 2019, (c) JJA 2019,
and (d) SON 2019. The 20°C isotherm (thick solid line) approximates the center of the thermocline.
The data are derived from an analysis system that assimilates oceanic observations into an oceanic
general circulation model (Behringer et al. 1998).

2) Atmospheric circulation, temperature, and
   precipitation anomalies during December–
   February 2018/19
   The patterns of tropical convection and
winds during DJF 2018/19 generally reflected
El Niño (Figs. 4.4a, 4.5a). In particular, tropical
convection (measured by Outgoing Longwave
Radiation [OLR]) was enhanced near the date
line (green shading) and suppressed over In-
donesia (brown shading). Low-level (850 hPa)
tropical wind anomalies were westerly over the
western Pacific Ocean during DJF (Fig. 4.4a),
reflecting a weakening of the trade winds, an
indicator of a weaker Pacific Walker circulation
(Bjerknes 1969).
   In the upper atmosphere (200 hPa), tropical
wind anomalies were mostly cross-equatorial
during DJF 2018/19, with flow from the Northern
Hemisphere (NH) subtropics to the Southern
Hemisphere (SH) over the eastern Pacific (Fig.
4.5a). Upper-level wind anomalies reflected
anomalous divergence in association with the
enhanced convection near the date line. Adja-
cent to this region, two anomalous upper-level
anticyclones flanked the equator, consistent
with El Niño.                                                          Fig. 4.4. Anomalous 850-hPa wind vectors and speed
                                                                       (contour interval is 2 m s −1) and anomalous OLR (shaded,
   Over the Pacific–North American region,
                                                                       W m −2) during (a) DJF 2018/19, (b) MAM 2019, (c) JJA 2019,
anomalies of 500-hPa heights and upper-level                           and (d) SON 2019. Reference wind vector is below right of
winds during DJF 2018/19 generally did not                             color bar. Anomalies are departures from the 1981–2010
match those conventionally associated with El                          period monthly means. (Source: NCEP–NCAR reanalysis
Niño. The strengthened and southern-shifted                            [Kalnay et al. 1996].)

  AU G U S T 2 0 2 0 | S t a t e o f t h e C l i m a t e i n 2 0 1 9                                        4. THE TROPICS   S193
jet stream was only evident over the far east-
ern North Pacific Ocean instead of across the
central North Pacific Ocean as expected with
El Niño (Fig. 4.5a). Despite the lack of a clear
El Niño footprint, the anomalous circulation
was linked to increased precipitation over
California, the southeastern United States,
and Florida. However, enhanced precipitation
was also widespread over the entire contigu-
ous United States, with the exception of the
Pacific Northwest and most of Texas, where
near- to slightly-below-average precipitation
occurred. As with the 500-hPa height anoma-
lies, the temperature anomalies over North

                                                                                                                Downloaded from http://journals.ametsoc.org/bams/article-pdf/101/8/S185/4991599/bamsd200077.pdf by guest on 09 November 2020
America were also not consistent with El Niño
with below-average temperatures over western
Canada and the north-central United States,
and above-average temperatures over the
southern tier of the United States (see sections
7b1 and 7b2).
   In other parts of the world, El Niño during
DJF is historically associated with positive
temperature anomalies over the northern half
of South America, Australia, Indonesia, south-
east Asia, and southern Africa (Halpert and
Ropelewski 1992). All of these were apparent
during DJF 2018/19 (see relevant temperature Fig. 4.5. Anomalous 200-hPa wind vectors and speed
sections in Chapter 7 for details), though un- (contour    interval is 4 m s −1), and anomalous OLR (shaded,
                                                       −2
doubtedly with a partial contribution from the W m ), during (a) DJF 2018/19, (b) MAM 2019, (c) JJA 2019,
                                                  and (d) SON 2019. Reference wind vector is below right of
long-term climate change warming signal as color bar. Anomalies are departures from the 1981–2010
well (see section 2b1). El Niño was also likely period monthly means. (Source: NCEP–NCAR reanalysis
associated with above-average precipitation [Kalnay et al. 1996].)
across most of the southern tier of the United
States, Uruguay, and southeastern China during DJF 2018/19 (see relevant precipitation sec-
tions in Chapter 7 for details; Ropelewski and Halpert 1989). Likewise, El Niño likely played
some role in below-average precipitation over parts of southern Chile, northern South America,
South Africa, Indonesia, and Australia.

3) Atmospheric circulation, temperature, and precipitation anomalies during March–May
   through September–November 2019
   The pattern of wind anomalies over the equatorial Pacific Ocean changed from DJF to MAM
2019, with mostly near-average low-level winds (Fig. 4.4b) and anomalous upper-level easterlies
over the western Pacific Ocean during MAM (Fig. 4.5b). By this season, the El Niño was weak-
ening from its boreal winter maximum. However, the East Asia–North Pacific jet stream was
stronger than average across most of the extratropical oceans (Fig. 4.5b), which is typical of El
Niño. Likewise, enhanced precipitation continued over California and much of the contiguous
United States (see section 7b2). Temperatures over the United States, however, were largely a
continuation of the DJF anomalies and not consistent with El Niño. Later in the year, the lower-
level and upper-level winds were mostly near average over the equatorial Pacific (Figs. 4.4c,d
and 4.5c,d). During SON, convection was suppressed over the Maritime Continent, mostly in

 AU G U S T 2 0 2 0 | S t a t e o f t h e C l i m a t e i n 2 0 1 9                     4. THE TROPICS   S194
association with the strengthening of the Indian Ocean dipole (IOD; section 4h). While SST
anomalies were positive over the western and central equatorial Pacific Ocean, there was no
corresponding increase in convection. In fact, OLR was weakly suppressed near the date line
(Figs. 4.4d, 4.5d).
c. Tropical intraseasonal activity—S. Baxter, C. Schreck, and G. D. Bell
Tropical intraseasonal variability was especially prominent during 2019. Two leading aspects
of this variability were the Madden-Julian Oscillation (MJO; Madden and Julian 1971, 1972, 1994;
Zhang 2005) and convectively coupled equatorial waves (Wheeler and Kiladis 1999; Kiladis et
al. 2009), which include equatorial Rossby waves and atmospheric Kelvin waves. There were
three distinct periods of MJO activity in 2019 spanning a total of approximately eight months
(Fig. 4.6), which were interspersed with the convectively coupled waves (Fig. 4.7). Between the
MJO periods, the tropical convective anomalies were dominated by lower frequency variability
and convectively coupled waves.
Downloaded from http://journals.ametsoc.org/bams/article-pdf/101/8/S185/4991599/bamsd200077.pdf by guest on 09 November 2020
Fig. 4.7. Time–longitude section for 2019 of anomalous OLR
Fig. 4.6. Time–longitude section for 2019 of 5-day running (W m−2) averaged between 10°N–10°S. Negative anomalies
anomalous 200-hPa velocity potential (× 10 6 m2 s−1) averaged indicate enhanced convection, positive anomalies indicate
between 5°N–5°S. For each day, the period mean is removed suppressed convection. Contours identify anomalies filtered
prior to plotting. Green (brown) shading highlights likely for the MJO (black) and atmospheric Kelvin waves (red),
areas of anomalous divergence and rising motion (conver- and equatorial Rossby waves (blue). Red labels highlight
gence and sinking motion). Red lines and labels highlight the main MJO episodes. Contours are drawn at ±10 W m−2,
the main MJO episodes. Anomalies are departures from the with the enhanced (suppressed) convective phase of these
1981–2010 base period daily means. (Source: NCEP–NCAR phenomena indicated by solid (dashed) contours. Anomalies
reanalysis [Kalnay et al. 1996].) are departures from the 1981–2010 base period daily means.
AU G U S T 2 0 2 0 | S t a t e o f t h e C l i m a t e i n 2 0 1 9 4. THE TROPICS S195The MJO is a leading intraseasonal climate mode of tropical convective variability. Its convective
anomalies often have a similar spatial scale to El Niño–Southern Oscillation (ENSO) but differ in
that they exhibit a distinct eastward propagation and generally traverse the globe in 30–60 days.
The MJO affects weather patterns around the globe (Zhang 2013), including monsoons (Krish-
namurti and Subrahmanyam 1982; Lau and Waliser 2012), tropical cyclones (TCs; Mo 2000; Frank
and Roundy 2006; Camargo et al. 2007; Schreck et al. 2012; Diamond and Renwick 2015), and
extratropical circulations (Knutson and Weickmann 1987; Kiladis and Weickmann 1992; Mo and
Kousky 1993; Kousky and Kayano 1994; Kayano and Kousky 1999; Cassou 2008; Lin et al. 2009;
Riddle et al. 2012; Schreck et al. 2013; Baxter et al. 2014). The MJO is often episodic, with periods
of moderate-to-strong activity followed by little or no activity. The MJO tends to be most active
during ENSO-neutral and weak ENSO periods and is often absent during strong El Niño events
(Hendon et al. 1999; Zhang and Gottschalck 2002; Zhang 2005). Common metrics for identifying
the MJO include time–longitude plots of anomalous 200-hPa velocity potential (Fig. 4.6) and
Outgoing Longwave Radiation (OLR; Fig. 4.7), as well as the Wheeler–Hendon (2004) Real-time
Downloaded from http://journals.ametsoc.org/bams/article-pdf/101/8/S185/4991599/bamsd200077.pdf by guest on 09 November 2020
Multivariate MJO (RMM) index (Fig. 4.8). In the time–longitude plots, the MJO exhibits eastward
propagation from upper-left to lower-right. In the RMM, the MJO propagation and intensity are
seen as large, counter-clockwise circles around the origin. When considered together, these diag-
nostics point to three prolonged MJO episodes during 2019. MJO #1 was a strong and long-lasting
episode that continued from late
2018 (Baxter et al. 2019) through
mid-March 2019. MJO #2 began
in mid-April and persisted into
early July, while MJO #3 began in
mid-August and lasted through
late December. All three MJO pe-
riods were associated with either
westerly wind bursts (WWBs) or
trade wind surges (TWS) over the
central Pacific (Fig. 4.9a).
MJO #1 featured a zonal wave-
1 pattern of strong convective
anomalies. Its periodicity was
approximately 30 days during
January, slowing to about 45 days
during February and March (Figs.
4.6, 4.8a). The plot of anomalous
velocity potential (Fig. 4.6) shows
that MJO #1 circumnavigated the
globe nearly two times during
January–March. The RMM index
indicates the event was strongest
in late February and early March
(Fig. 4.8a). During late March,
coherent eastward propagation Fig. 4.8. Wheeler–Hendon (2004) Real-time Multivariate MJO (RMM) index
gave way to a more stationary for (a) Jan–Mar, (b) Apr–Jun, (c) Jul–Sep, and (d) Oct–Dec 2019. Each point
represents the MJO amplitude and location on a given day, and the con-
convective pattern with upper-
necting lines illustrate its propagation. Amplitude is indicated by distance
level divergence (convergence) from the origin, with points inside the circle representing weak or no
centered over the west-central MJO. The eight phases around the origin identify the region experiencing
Pacific Ocean (eastern Indian enhanced convection, and counter-clockwise movement is consistent with
Ocean). eastward propagation.
AU G U S T 2 0 2 0 | S t a t e o f t h e C l i m a t e i n 2 0 1 9 4. THE TROPICS S196Impacts from MJO #1 included notable WWB activity over the equatorial Pacific during January
and February (Fig. 4.9a). These WWBs initiated and reinforced the strongest downwelling oce-
anic Kelvin wave observed in 2019 (dashed line, Fig. 4.9b), which resulted in positive heat content
anomalies exceeding 2°C in early March. This downwelling wave reached the west coast of South
America during April. Prominent TWS were notably absent during early 2019.
MJO #2 occurred from mid-April to early July. Its periodicity was about 45 days, with nearly
canonical eastward propagation throughout its duration. The RMM index showed peak amplitude
during mid- to late May (Fig. 4.8b). Eastward propagation broke down during July, giving way to
less coherent convective anomalies punctuated by westward-moving equatorial Rossby waves.
MJO #2 resulted in alternating low-level zonal wind anomalies over the western and central
Pacific (Fig. 4.9a) that gave rise to both upwelling and downwelling oceanic Kelvin waves. TWS
events in April and June, respectively, resulted in upwelling oceanic Kelvin waves seen as local
minima in heat content anomalies (dotted lines, Fig. 4.9b). A WWB in May resulted in a down-
welling oceanic Kelvin wave observed between the aforementioned upwelling periods.
Downloaded from http://journals.ametsoc.org/bams/article-pdf/101/8/S185/4991599/bamsd200077.pdf by guest on 09 November 2020
The third and final MJO period of 2019 was associated with the emergence of a wave-1 convec-
tive pattern in late August. Both the RMM index and velocity potential anomalies reveal rela-
tively slow propagation during mid-September through mid-October, when a westward-moving
equatorial Rossby wave (Figs. 4.7, 4.9a) interfered with the overall MJO signal. This interference
is seen as a distinct split in the MJO-suppressed phase during late September and early October
(Fig. 4.6). A similar split is visible but less prominent in the enhanced MJO phase at the same time.
Eastward propagation with a periodicity of nearly 40 days resumed in mid- to late October. MJO
#3 reached peak amplitude
in November (Fig. 4.8) as a
very strong suppressed phase
propagated across the Indian
Ocean (Fig. 4.7). Canonical
eastward propagation gave
way to a fast-moving atmo-
spheric Kelvin wave in late
December.
MJO #3 resulted in t wo
prominent WWB events and
associated downwelling oce-
anic Kelvin waves in Septem-
ber and November, respective-
ly. The first downwelling wave
reached the South American
coast in early December. A
modest TWS in late October Fig. 4.9. (a) Time–longitude section for 2019 of anomalous 850-hPa zonal
wind (m s −1) averaged between 10°N–10°S. Contours identify anomalies
and the resulting upwelling
filtered for the MJO (black), atmospheric Kelvin waves (red), and equato-
separated t he t wo dow n- rial Rossby waves (blue). Significant WWB and TWS over the equatorial
welling waves. MJO #3 also Pacific that resulted in notable downwelling and upwelling oceanic Kelvin
appears to have played a role waves are labeled. (b) Time–longitude section for 2019 of the anomalous
in modulating Atlantic hurri- equatorial Pacific Ocean heat content, calculated as the mean temperature
cane activity. During 4–14 Sep- anomaly between 0–300 m depth. Yellow/red (blue) shading indicates above-
(below-) average heat content. Relative warming (dashed lines) and cooling
tember, no new named storm
(dotted lines) due to downwelling and upwelling equatorial oceanic Kelvin
formations occurred when the waves are indicated. Anomalies are departures from the 1981–2010 base
MJO was producing enhanced period pentad means. Data in (b) are derived from an analysis system that
upper-level divergence over assimilates oceanic observations into an oceanic general circulation model
the central and eastern Pacific (Behringer et al. 1998).
AU G U S T 2 0 2 0 | S t a t e o f t h e C l i m a t e i n 2 0 1 9 4. THE TROPICS S197(Fig. 4.6), a pattern known to increase vertical wind shear over the tropical Atlantic and be un-
favorable for tropical cyclogenesis (Klotzbach 2010). In contrast, the MJO likely contributed to
enhanced Atlantic TC activity during 14 September–2 October (five Atlantic named storms) and
18–30 October (four Atlantic named storms). In both periods, the suppressed phase of the MJO
produced anomalous upper-level convergence
over the central equatorial Pacific, a pattern
that acts to decrease the vertical wind shear
and increase activity over the tropical Atlantic.
d. Intertropical convergence zones
1) Pacific— N. Fauchereau
Tropical Pacific rainfall patterns are domi-
nated by two convergence zones, the Inter-
tropical Convergence Zone (ITCZ; Schneider
Downloaded from http://journals.ametsoc.org/bams/article-pdf/101/8/S185/4991599/bamsd200077.pdf by guest on 09 November 2020
et al. 2014) north of the equator and the South
Pacific Convergence Zone (SPCZ; Vincent
1994). Figure 4.10 summarizes their combined
behavior during 2019 using rainfall estimated
from satellite microwave and infrared data in a
Fig. 4.10. Rainfall rate (mm day−1) from CMORPH analysis
product known as CMORPH (Joyce et al. 2004).
for the cross-section between 20°N and 30°S, for (a)
Rainfall transects over 20°N–30°S are pre-
Jan–Mar, (b) Apr–Jun, (c) Jul–Sep, and (d) Oct–Dec 2019.
sented for each quarter of the year, averaged Each quarter’s panels show the 2019 rainfall (solid line),
across successive 30°-longitude bands, start- and the 1998–2018 climatology (dotted line), for four 30°
ing in the western Pacific at 150°E–180°. The sectors from 150°E–180° to 120°–90°W. (Source: CMORPH
2019 seasonal variation is compared against [Joyce et al. 2004].)
the 1998–2018 climatology.
From January through March, the positive
sea surface temperature (SST) anomalies in the
central Pacific were associated with consider-
able increases in precipitation around the date
line. During this time, large departures from
normal rainfall were recorded in February
just south of the equator (Figs. 4.10a, 4.11a)
within the SPCZ. A strongly intensified ITCZ
developed in March (Fig. 4.11b). Conversely,
well-below-normal rainfall was recorded in
the western Pacific and the Maritime Conti-
nent in February. Persistent dryness affected
many islands within Micronesia during the
first quarter of 2019 (PEAC 2019, Pacific ENSO
update).
Figure 4.12 shows a more detailed compari-
son of the western Pacific CMORPH rainfall
transect during January–March (JFM) 2019
relative to all other years in the satellite da-
taset. During JFM, the ITCZ was quite strong,
with the most exceptional rainfall anomalies—
approaching and exceeding the largest values Fig. 4.11. Rainfall anomalies (mm day−1) for (a) Feb and (b)
in the CMORPH dataset—recorded within the Mar 2019. The anomalies are calculated with respect to the
ITCZ in the northern Pacific between 150°E 1998–2018 climatology. (Source: CMORPH [Joyce et al. 2004].)
AU G U S T 2 0 2 0 | S t a t e o f t h e C l i m a t e i n 2 0 1 9 4. THE TROPICS S198and 180°. This pattern is atypi-
cal of the composite anomalies
associated with more canonical
El Niño conditions. However,
it is consistent with an atmo-
spheric response to positive SST
anomalies centered around and
west of the date line, noting the
amplitude of the rainfall anoma-
lies observed are still somewhat
unprecedented.
Rainfall anomalies broadly
Fig. 4.12. Rainfall rate (mm day−1) for Jan–Mar, for each year 1998 to 2018,
consistent with weak El Niño con- averaged over the longitude sector 150°E–180°. The cross-sections are
ditions persisted until about July, color-coded according to NOAA’s ONI, except 2019, which is shown in
Downloaded from http://journals.ametsoc.org/bams/article-pdf/101/8/S185/4991599/bamsd200077.pdf by guest on 09 November 2020
after which most El Niño–South- black. Dotted lines are individual years, and solid lines are the average
ern Oscillation (ENSO) indicators over all years in each ENSO phase. Inset legend indicates how many years
dipped below El Niño thresholds went into each composite. (Source: CMORPH [Joyce et al. 2004].)
and ENSO-neutral conditions took
hold. However, the continued development of a positive Indian Ocean dipole (IOD; one of the
strongest on record) influenced rainfall patterns from September through the end of the year,
especially in the western Pacific (section 4h). During this period, dry conditions developed and
impacted some areas of the western Pacific and Maritime Continent again. At the same time, the
ITCZ shifted north of its climatological position in the central and eastern equatorial Pacific east
of the date line.
In November 2019, SST anomalies increased in the central and western Pacific. The continu-
ation of positive IOD conditions well into December led to dry conditions forming across parts
of the western Pacific and the Maritime Continent. The SPCZ was clearly shifted northeast of its
climatological position in the southwest Pacific during December, leading to dry conditions across
Papua New Guinea, the Solomon Islands, Vanuatu, and New Caledonia.
2) Atlantic— A. B. Pezza and C. A. S. Coelho
The Atlantic ITCZ is a well-organized convective band that oscillates between approximately
5°–12°N during July–November and 5°N–5°S during January–May (Waliser and Gautier 1993;
Nobre and Shukla 1996). Equatorial atmospheric Kelvin waves can modulate ITCZ intraseasonal
variability (Guo et al. 2014). ENSO and the Southern Annular Mode (SAM) can also influence
the ITCZ on interannual time scales (Münnich and Neelin 2005). The SAM, also known as the
Antarctic Oscillation, describes the north–south movement of the westerly wind belt that circles
Antarctica, dominating the middle to higher latitudes of the Southern Hemisphere (SH). The
changing position of the westerly wind belt influences the strength and position of cold fronts
and midlatitude storm systems. During a positive SAM event, the belt of strong westerly winds
contracts toward Antarctica. Conversely, a negative SAM event reflects an expansion of the belt of
strong westerly winds towards the equator. The SAM, which was mostly positive in recent years,
started to oscillate between predominantly neutral and negative phases in 2019, with negative
values developing late in the year (see section 6b). This was consistent with an El Niño-like state
in the Pacific, with weak coupling between equatorial Pacific oceanic and atmospheric conditions.
This transition state was associated with an Atlantic ITCZ oscillating around its climatological
position. Occasional southern excursions during March and April contributed to positive rainfall
anomalies offshore and in some small areas of northeastern Brazil during the first half of the year
(Fig. 4.13). These bursts were associated with an anomalously warm Atlantic Ocean south of the
equator and a cool North Atlantic during the first half of the year. This SST pattern reverted to a
AU G U S T 2 0 2 0 | S t a t e o f t h e C l i m a t e i n 2 0 1 9 4. THE TROPICS S199Fig. 4.13. Observed precipitation anomaly for tropical and subtropical South America (mm day−1) during (a) Jan–Jun and
(b) Jul–Dec 2019. Anomalies are calculated based on a 1998–2018 climatology. (Source: CMORPH [Joyce et al. 2004].)
Downloaded from http://journals.ametsoc.org/bams/article-pdf/101/8/S185/4991599/bamsd200077.pdf by guest on 09 November 2020
more neutral set up from June to October, and then
re-intensified toward the end of the year.
The Atlantic Index (Pezza and Coelho 2019),
as defined by the SST south of the equator minus
the SST north of the equator over key areas of
influence for the ITCZ, reflects well the role of the
north–south gradient mechanism highlighted
above for 2019, with the ITCZ tending to shift to-
ward the warmer side of this gradient (Fig. 4.14).
A weaker subtropical South Atlantic anticyclone
associated with a negative SAM also contributed
to re-establish a positive SST anomaly pattern
south of the equator toward the end of the year.
This pattern resulted in an abrupt increase in the
Atlantic Index (Fig. 4.14). This increase is also
consistent with possible atmospheric Kelvin wave
propagation, although the ITCZ was too far north
to be impacted.
e. Global monsoon summary— B. Wang and Q. He
The global monsoon is the dominant mode of
annual tropical–subtropical precipitation and circu-
lation variability and thus a critical part of Earth’s Fig. 4.14. (a) Atlantic ITCZ position inferred from OLR
(Liebmann and Smith 1996) during Mar 2019. The colored
climate system (Wang and Ding 2008). Figure 4.15
thin lines indicate the approximate position for the six
shows global precipitation anomalies, focusing on pentads of the month. The black thick line indicates the
monsoon rainfall anomalies, especially over the climatological position for Mar. SST anomalies for Mar
land monsoon region, for the monsoon seasons 2019 based on the 1982–2018 climatology are shaded
in the (a) Southern Hemisphere (SH; November (°C). Boxes indicate areas used to calculate the Atlantic
2018–April 2019) and (b) Northern Hemisphere (NH; index. (b) Atlantic index for 2015–19, based on monthly
OISST (Smith et al. 2008) anomaly time series averaged
May–October 2019), which constitute the global
over the South Atlantic sector (SA box, 10°–50°W, 5°N–
monsoon year of 2018/19. Figure 4.16 shows the time 5°S) minus the same averaged over the North Atlantic
series of monsoon precipitation and low-level circu- sector (NA box, 20°–50°W, 5°–25°N). A positive index
lation indices (Yim et al. 2014) for each of the eight indicates favorable conditions for enhanced Atlantic
regional monsoons. Note that these precipitation ITCZ activity south of the equator.
AU G U S T 2 0 2 0 | S t a t e o f t h e C l i m a t e i n 2 0 1 9 4. THE TROPICS S200Fig. 4.15. Precipitation anomalies (mm day−1) averaged for (a) the SH monsoon season: Nov 2018–Apr 2019 and (b) the NH
monsoon season: May–Oct 2019. Red lines outline the global monsoon precipitation domain defined by two climatological
conditions: first, the local monsoon season precipitation minus that of the cool season exceeds 300 mm and second, the
monsoon season precipitation constitutes at least 55% of the total annual amount (Wang and Ding 2008). Precipitation
Downloaded from http://journals.ametsoc.org/bams/article-pdf/101/8/S185/4991599/bamsd200077.pdf by guest on 09 November 2020
indices for each regional monsoon are defined by the areal mean precipitation in the corresponding rectangular regions
(dashed blue), which are highly correlated with that of the corresponding real regional monsoon domains (Table 4.1).
(Source: GPCP [Huffman et al. 2009].)
Fig. 4.16. Summer mean precipitation (green) and circulation (red) indices for each of eight regional monsoons defined in
Table 4.1, normalized by their corresponding std. dev. In each panel, R denotes the correlation coefficient between the
seasonal mean precipitation and circulation indices (sample size: 40). Dashed lines indicate ±0.5 std. dev. The monsoon
seasons are May–Oct for the NH and Nov–Apr for the SH. The normalization method is discussed in Yim et al. (2014).
(Source: GPCP for precipitation; ERA-5 for circulation.)
AU G U S T 2 0 2 0 | S t a t e o f t h e C l i m a t e i n 2 0 1 9 4. THE TROPICS S201indices represent the average precipitation amount over both land and ocean areas in the boxed
regions shown in Fig. 4.16. The definitions of the circulation indices for each monsoon region are
provided in Table 4.1. In most regions, the precipitation and circulation indices are well correlated,
with correlation coefficients ranging from 0.68 to 0.86, except for the southern African monsoon.
The correlation coefficients in Table 4.1 were computed using monthly mean data from 1979 to 2018
(sample size is 160). The precipitation and circulation indices together provide consistent measure-
ments of the strength of each regional monsoon system.
Global land monsoon precipitation is strongly influenced by tropical sea surface temperature
(SST) anomalies, especially those associated with the El Niño–Southern Oscillation (ENSO; Wang
et al. 2012). As shown in Fig. 4.15a, during the SH monsoon season, precipitation increased over
the central-western Pacific and was suppressed over the Maritime Continent–Australian monsoon
region (Fig. 4.15a). This pattern was consistent with the SST anomalies associated with the weak
El Niño that occurred from January to July 2019. The South American monsoon was characterized
by below-normal precipitation and circulation intensity, especially a significant weakening of
Downloaded from http://journals.ametsoc.org/bams/article-pdf/101/8/S185/4991599/bamsd200077.pdf by guest on 09 November 2020
the South American monsoon circulation (Fig. 4.16g). The Australian summer monsoon region
also received markedly less precipitation than normal, but the strength of the corresponding
circulation was near normal (Fig. 4.16h). The southern African summer monsoon precipitation
was near normal, but the circulation intensity was below normal (Fig. 4.16f). Overall, the SH sum-
mer monsoon was generally below normal with reduced precipitation and monsoon circulation,
although the degree of weakening varied in the three SH regional monsoons.
During the NH monsoon season, precipitation over the Maritime Continent was significantly
below normal with a prominent reduction of precipitation to the west of Sumatra over the tropi-
cal eastern Indian Ocean (Fig. 4.15b). On a regional scale, the northern African monsoon was
characterized by above-normal precipitation and circulation intensity, both of which reached
~1.5 std. dev. (Fig. 4.16e) above normal, indicating a strong monsoon year over northern Africa.
Table 4.1. (Modified from Yim et al. 2014). Definition of the regional summer monsoon circulation indices
and their correlation coefficients (CCs) with the corresponding regional summer monsoon precipitation
indices for the period 1979–2018. All circulation indices are defined by the meridional shear of the zonal
wind at 850 hPa, which measures the intensity (relative vorticity) of the monsoon troughs at 850 hPa
except for northern African (NAF) and East Asian (EA). The NAF monsoon circulation index is defined by
the westerly monsoon strength: U850 (0°–15°N, 60°–10°W), and the EASM circulation index is defined by
the meridional wind strength: V850 (20°–40°N, 120°–140°E), which reflects the east–west thermal contrast
between the Asian continent and the western North Pacific. The precipitation indices are defined by the
areal mean precipitation over the blue box regions shown in Fig. 4.15. The correlation coefficients were
computed using monthly time series (160 summer months) (Jun–Sep [JJAS] in NH [1979–2018] and Dec–
Mar [DJFM] in SH [1979/80–2018/19]). Bolded numbers represent significance at the 99% confidence level.
Region Definition of the circulation index CC
U850 (5° –15°N, 40°–80°E) minus
Indian (ISM) 0.69
U850 (25°–35°N, 70°–90°E)
U850 (5°–15°N, 100°–130°E) minus
Western North Pacific (WNPSM) 0.80
U850 (20°–35°N, 110°–140°E)
East Asian (EASM) V850 (20°–40°N, 120°–140°E) 0.70
U850 (5°–15°N, 130°–100°W) minus
North American (NASM) 0.83
U850 (20°–30°N, 110°–80°W)
Northern African (NAFSM) U850 (0°–15°N, 60°–10°W) 0.68
U850 (20°–5°S, 70°–40°W) minus
South American (SASM) 0.82
U850 (35°–20°S, 70°–40°W)
U850 (15°S-0°, 10°–40°E) minus
Southern African (SAFSM) 0.53
U850 (25°–10°S, 40°–70°E)
U850 (15°S–0°, 90°–130°E) minus
Australian (AUSSM) 0.86
U850 (30°–20°S, 100°–140°E)
AU G U S T 2 0 2 0 | S t a t e o f t h e C l i m a t e i n 2 0 1 9 4. THE TROPICS S202Boreal summer precipitation over India was significantly above normal, but precipitation over
Bangladesh and the Indo-China peninsula was below normal. The western North Pacific monsoon
precipitation was ~1 std. dev. above normal (Fig. 4.16b). Both the East Asian summer monsoon
rainfall and its circulation were near normal (Fig. 4.16c) with a dipolar pattern: above-normal
precipitation over the East China Sea to western Japan and below-normal precipitation along the
subtropical frontal zone extending from the middle Yangtze River Valley to the Korean peninsula
(Fig. 4.15b). The North American monsoon was characterized by both below-normal precipitation
and circulation intensity (Fig. 4.16d). Overall, total monsoon precipitation was above normal in the
NH and below normal in the SH. There was a notable contrast between the Eastern and Western
Hemispheres, with increased rainfall over the Eastern Hemisphere tropical monsoon regions and
reduced rainfall over those of the Western Hemisphere (e.g., the American monsoon regions).
f. Tropical cyclones
1) Overview— H. J. Diamond and C. J. Schreck
Downloaded from http://journals.ametsoc.org/bams/article-pdf/101/8/S185/4991599/bamsd200077.pdf by guest on 09 November 2020
The IBTrACS dataset comprises historical tropical cyclone (TC) best-track data from numerous
sources around the globe, including all of the World Meteorological Organization (WMO) Regional
Specialized Meteorological Centers (RSMCs; Knapp et al. 2010). This dataset represents the most
complete compilation of global TC data. From
these data, Schreck et al. (2014) compiled
1981–2010 climatological values of TC activity
for each basin using statistics from both the
WMO RSMCs and the Joint Typhoon Warning
Center (JTWC). These values are referenced in
each subsection.
Tallying the global TC numbers is challeng-
ing and involves more than simply adding up
basin totals, because some storms cross TC
basin boundaries, some TC basins overlap,
and multiple agencies track and categorize
TCs. Compiling the activity using preliminary
IBTrACS data over all seven TC basins from
NOAA’s National Hurricane Center and the
JTWC (Fig. 4.17), the 2019 season (2018/19 in
the Southern Hemisphere [SH]) had 96 named
storms (sustained wind speeds ≥ 34 kt or 17
m s −1), which is one more than last season
(Diamond and Schreck 2019) and above the
1981–2010 average of 82 (Schreck et al. 2014).
The 2019 season also featured 53 hurricanes/
typhoons/cyclones (HTC; sustained wind
speeds ≥ 64 kt or 33 m s−1), which is above
the climatological average of 46 (Schreck et
al. 2014). During the 2019 season, 31 storms
reached major HTC status (sustained wind
speeds ≥ 96 kt or 49 m s−1), which is also above
the long-term average of 21 and five more than Fig. 4.17. (a) Global summary of TC tracks overlaid on associated
the 2018 season (Diamond and Schreck 2019). OISST anomalies (°C; Reynolds et al. 2002) for the 2019 season
All of these metrics were in the top 10% rela- relative to 1982–2010; (b) global TC counts; and (c) global ACE
tive to 1981–2010 (Table 4.2). values. Horizontal lines on (b) and (c) are 1981–2010 normals.
AU G U S T 2 0 2 0 | S t a t e o f t h e C l i m a t e i n 2 0 1 9 4. THE TROPICS S203You can also read