Grievance Submittal Form - State of Michigan
←
→
Page content transcription
If your browser does not render page correctly, please read the page content below
Grievance Submittal Form
    Nondiscrimination in Michigan Department of Environment, Great Lakes, and Energy (EGLE) Programs
                                         Policy and Procedure Number 09-024

SECTION I. COMPLAINANT INFORMATION
FIRST NAME: Nicholas                                        LAST NAME: Leonard
EMAIL ADDRESS: nicholas.leonard@glelc.org
TELEPHONE NUMBER: 313-782-3372
MAILING ADDRESS: 4444 Second Avenue
CITY: Detroit                                               STATE: MI              ZIP: 48201

SECTION II. INCIDENT INFORMATION
DATE OF INCIDENT:     01/29/2020               DATE OF GRIEVANCE SUBMISSION:         07/27/2020
LOCATION OF INCIDENT (Include street crossing, street number, Street, City, State, ZIP)
6520 Georgia Street, Detroit, MI 48201

Please identify the parties harmed or potentially harmed by the alleged discrimination. Use additional pages if
necessary.
See Attachment

List the state and/or federal statute(s) or regulation(s) that EGLE allegedly violated and detail with specificity
the action(s) or inaction(s) by EGLE that support the alleged violation. Use additional pages if necessary.
See Attachment

Describe with specificity the action(s) or inaction(s) allegedly resulted in discrimination. Use additional pages
if necessary.
See Attachment

Michigan.gov/EGLE | 800-662-9278                       Page 1 of 2                                EQP0120 (01/2020)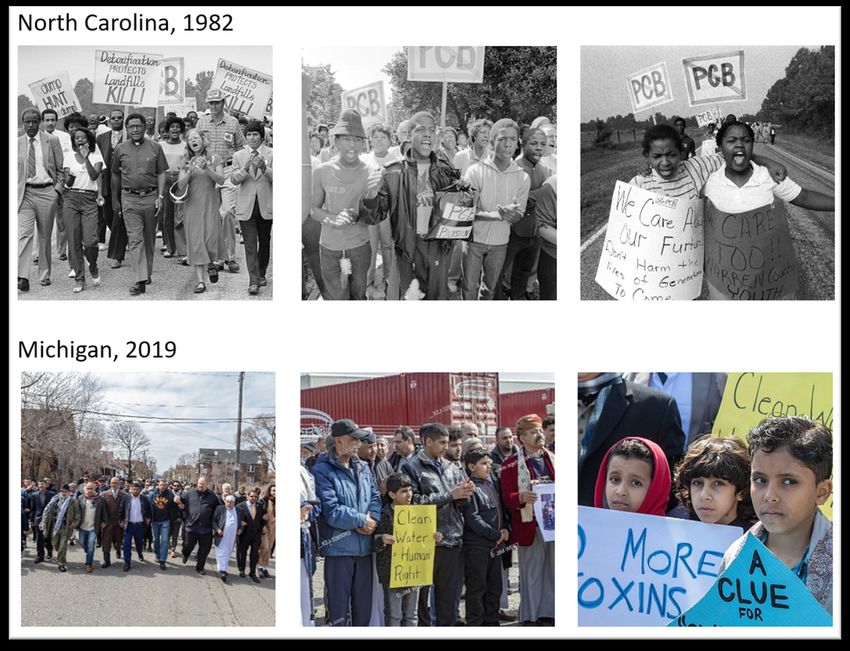
GRIEVANCE SUBMITTAL FORM
                                             Nondiscrimination in EGLE Programs - Policy and Procedure Number 09-024

SECTION III. CERTIFICATION
I certify under penalty of law that I am familiar with the information submitted and that, based on my experience and
inquiry, I believe the submitted information is true, accurate, and complete.

                                                                                                    07/27/2020
Signature                                                                                          Date

Nicholas Leonard
Print Name

                                          Submit this form with any additional pages to:

                                       Nondiscrimination Compliance Coordinator
                                                    Executive Office
                              Michigan Department of Environment, Great Lakes, and Energy
                                                    P.O. Box 30473
                                                Lansing, MI 48909-7973

                                                              or by email to:

                                           EGLE-NondiscriminationCC@Michigan.gov

The Michigan Department of Environment, Great Lakes, and Energy (EGLE) does not discriminate on the basis of race, sex, religion,
age, national origin, color, marital status, disability, political beliefs, height, weight, genetic information, or sexual orientation in the
administration of any of its programs or activities, and does not intimidate or retaliate against any individual or group because they have
exercised their rights to participate in or oppose actions protected by applicable laws and regulations, or for the purpose of interfering
with such rights, and claims of intimidation and retaliation will be handled promptly if they occur.

                                                                  Page 2 of 2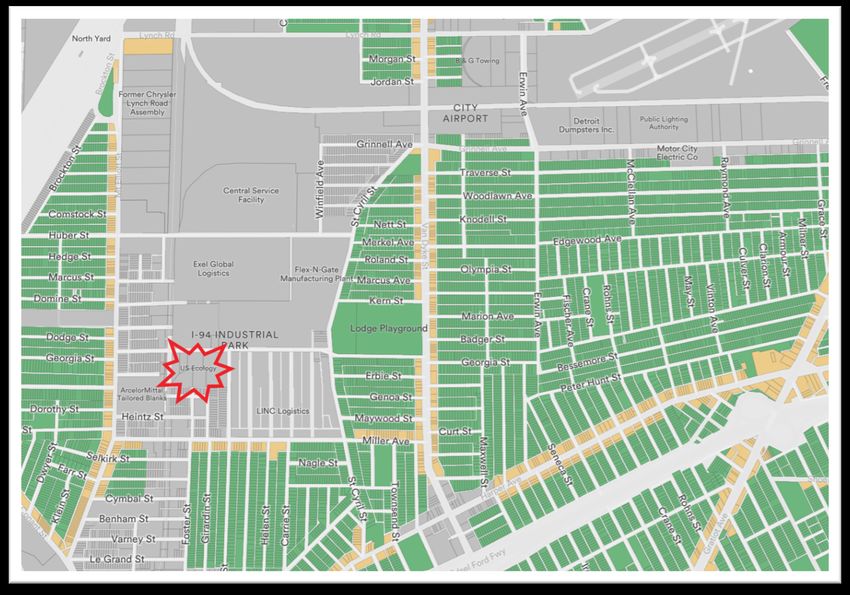
By electronic mail

July 27, 2020

Attn: Nondiscrimination Compliance Coordinator
Executive Office
Michigan Department of Environment, Great Lakes, and Energy
525 West Allegan
P.O. Box 30473
Lansing, MI 48909-7973
EGLE-NondiscriminationCC@Michigan.gov

Regina Strong
Office of the Environmental Justice Public Advocate
Michigan Department of Environment, Great Lakes, and Energy
525 West Allegan
P.O. Box 30473
Lansing, MI 48909-7973
StrongR1@Michigan.gov

Al Taylor
Hazardous Waste Section
Materials Management Division
Michigan Department of Environment, Great Lakes, and Energy
525 West Allegan
P.O. Box 30241
Lansing, MI 48909-7741
taylora@michigan.gov

Liesl Clark
Director
Michigan Department of Environment, Great Lakes, and Energy
525 West Allegan
P.O. Box 30473
Lansing, MI 48909
clarkl20@michigan.gov

Re:    Title VI Complaint Under Michigan Department of Environment, Great Lakes, and
       Energy Policy and Procedure 09-024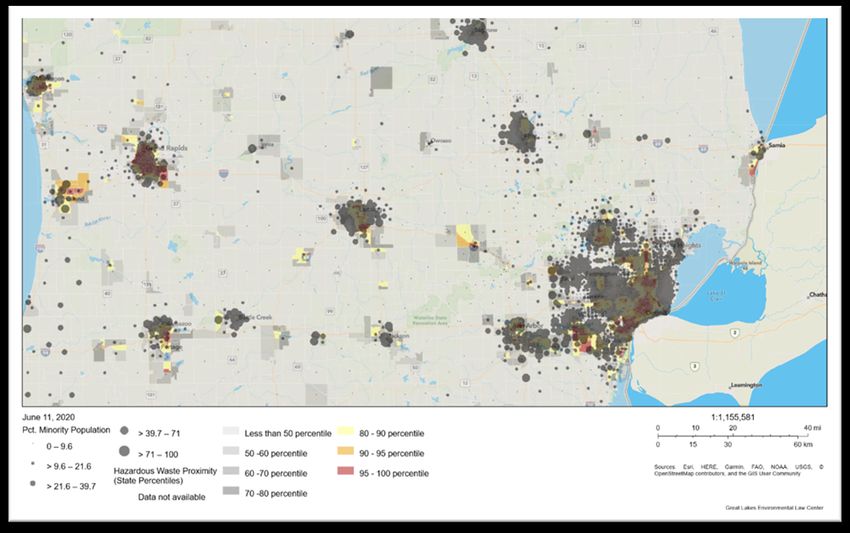
On behalf of the residents of Detroit, Hamtramck, and the state of Michigan, as well as the
named individuals and organizations provided in Section II (“Complainants”) the Great Lakes
Environmental Law Center is submitting this Complaint regarding the Michigan Department of
Environment, Great Lakes, and Energy’s pattern of neglect and disregard for communities of
color in regards to the licensing of commercial hazardous waste facilities that has resulted in
these facilities being disproportionately located in communities of color.

On January 29, 2020, the Michigan Department of Environment, Great Lakes, and Energy
approved a license modification for U.S. Ecology North that will allow the facility to increase its
storage capacity nine-fold. It did this despite the fact that the facility is located in a densely
populated low-income community of color that already includes another commercial hazardous
waste facility just to the south as well as a number of other industrial sites that have caused
nearby residents physical and mental harm. In doing so, EGLE is continuing a history of
discriminatory practices that has plagued this neighborhood since the 1940’s.

The Michigan Department of Environment, Great Lakes, and Energy’s decision to allow U.S.
Ecology North to significantly expand its operations is part of a larger pattern of neglect and
disregard for low-income communities of color regarding commercial hazardous waste facilities.
In Michigan, the disproportionate siting of commercial hazardous waste facilities in communities
of color has been found the worst in the nation. Today, that pattern continues unabated. 65% of
the people living within 3 miles of a commercial hazardous waste facility in Michigan are people
of color despite being only 25% of Michigan’s total population. To make matters worse,
commercial hazardous waste facilities hardly serve their own communities. In 2017, 70% of the
waste sent to all commercial hazardous waste facility came from out of state, 25% came from
another county within Michigan, and only 5% came from the county in which the commercial
hazardous waste facility is located.

To put it simply, Michigan’s low-income communities of color are disproportionately bearing
the burden of living near large commercial hazardous waste facilities. These facilities serve as
the dumping ground for hazardous waste that comes from all over the country. The
Complainants submit this Complaint and request that the Michigan Department of Environment,
Great Lakes, and Energy conduct a thorough investigation of the issues raised herein.
I.   Introduction

Since springing into the national consciousness in the 1980s, the environmental justice
movement has compelled federal, state, and local governments to examine how environmental
laws and regulations may result in communities of color bearing a disproportionate burden
regarding environmental risks. The start of the environmental justice movement is often
pinpointed at 1982 in Warren County, North Carolina, where residents protested North
Carolina’s decision to locate a hazardous waste landfill in a predominantly Black and low-
income community. However, the roots of the environmental justice movement stretch back to
the civil rights struggles of the 1960s, including Martin Luther King Jr. supporting Black garbage
workers in their strike for equal pay and better working conditions. It is from the civil rights
struggle that the environmental justice movement drew its core principles. One of these core
principles of environmental justice was concisely described by Dr. King himself:

         When the Constitution was written, a strange formula to determine taxes and
         representation declared that the Negro was sixty percent of a person. Today another
         curious formula seems to declare he is fifty percent of a person. Of the good things in
         life, the Negro has approximately one half those of whites. Of the bad things of life, he
         has twice those of whites.1

At the heart of the environmental justice movement is rectifying the inequitable distribution of
burdens and benefits that Martin Luther King decried. As a concept, environmental justice has
been defined in many ways by government agencies and community activists. The United States
Environmental Protection Agency has defined environmental justice as “the fair treatment and
meaningful involvement of all people regardless of race, color, or national origin, or income with
respect to the development, implementation, and enforcement of environmental laws,
regulations, and policies.”2 The concept of “fair treatment” in the context of the development,
implementation, and enforcement of environmental laws means that “no group of people,
including racial, ethnic, or socio-economic groups, should bear a disproportionate share of the
negative environmental consequences resulting from industrial, municipal, or commercial
operations or the execution of federal, state, local and tribal programs and policies.”3

While today’s laws no longer expressly codify racial segregation and unequal treatment, the
legacy of racism continues to this day. As noted by environmental justice scholar and activist Dr.
Robert Bullard:

         The laws that codify racial segregation have been eradicated but the practices continue
         today, which is why you get refineries, chemical plants and landfills disproportionately in

1
  Rev. Martin Luther King Jr., The Southern Christian Leadership Conference Presidential Address, Aug. 16, 1967.
2
  U.S. Environmental Protection Agency, Environmental Justice, available at
https://www.epa.gov/environmentaljustice
3
  Robert Bullard, Paul Mohai, Robin Saha, and Beverly Wright, Toxic Wastes and Race at Twenty 1987-2007: A
Report Prepared for the United Church of Christ Justice & Witness Ministries, March 2007 (Appendix A).

                                                                                                                   1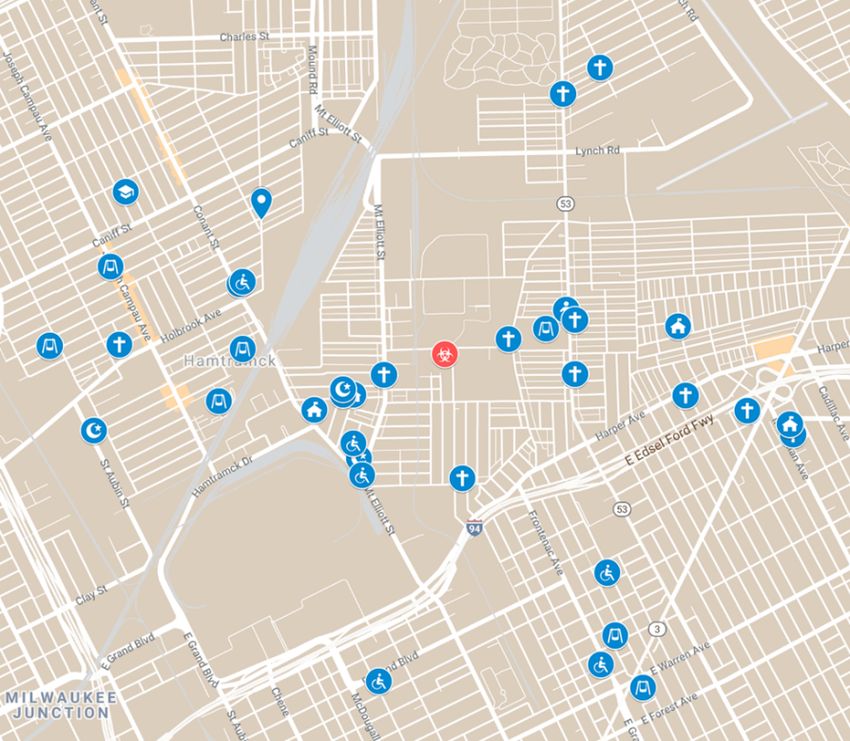
communities of color…The only way to reverse that is to change the idea that
        communities of color are dumping grounds for pollution.4

One of the primary environmental burdens that has historically been borne by Black
communities is living near commercial hazardous waste storage, treatment, and disposal
facilities. Such commercial facilities accept wide varieties of hazardous waste from far-reaching
locations. These wastes are often the toxic byproducts of a wide variety of industrial processes,
as well as contaminated soil or water extracted from contaminated sites from across the country.
After the birth of the environmental justice movement in Warren County in 1987, the United
Church of Christ analyzed the relationship between race and the location of commercial
hazardous waste facilities. As described in more detail below, the study concluded that
commercial hazardous waste facilities were disproportionately sited in Black communities
nationwide. In its follow up report 20 years later, the United Church of Christ found that the
trend of disproportionately siting commercial hazardous waste facilities in communities of color
had continued unabated.

This problem is particularly egregious in Michigan. As noted by the United Church of Christ’s
2007 study, the percentage of people of color living nearby commercial hazardous waste
facilities is 66%, whereas the percentage of people of color living in all other areas of the state is
19%. This disproportionality was found to be the most severe in the entire country. This problem
remained unaddressed. Today, 65% of the peoples living within 3 miles of a commercial
hazardous waste facility are people of color, despite being only 25% of Michigan’s total
population.

The decision by the Michigan Department of Environment, Great Lakes, and Energy (“EGLE”)
to allow U.S. Ecology to significantly expand the capacity of its hazardous waste storage and
treatment facility continues the discriminatory legacy of requiring communities of color to bear
the disproportionate burden of living in communities that are dumping grounds for hazardous
waste. Unfortunately, U.S. Ecology North (“Facility”) does not exist in isolation. Throughout
Michigan, commercial hazardous waste facilities are overwhelmingly located in low-income
communities of color.

During the U.S. Ecology licensing process, community members repeatedly brought up their
concerns regarding the disproportionate siting of commercial hazardous waste facilities in low-
income communities of color. EGLE never responded to these concerns. Instead, it simply stated
that EGLE “does not have the authority to consider whether the facility is needed or wanted
when deciding whether to issue or deny a license.”5 EGLE has a legal obligation, pursuant to the
EPA’s Title VI regulations, to ensure that its licensing decisions do not have a discriminatory
effect. Instead of closely examining the proposed license to ensure that it would not have an
unjustified adverse disparate impact on the surrounding community, EGLE continued its
disappointing legacy of shirking its Title VI obligations to communities of color which

4
  Oliver Milman, Robert Bullard: ‘Environmental justice isn’t just slang, it’s real,’ THE GUARDIAN, December 20,
2018, https://www.theguardian.com/commentisfree/2018/dec/20/robert-bullard-interview-environmental-justice-
civil-rights-movement (last visited Jul 23, 2020).
5
  Michigan Department of Environment, Great Lakes, and Energy, Responsiveness Summary, Proposed Hazardous
Waste Management Facility Operating License, Jan. 29, 2020 (Appendix B)

                                                                                                                   2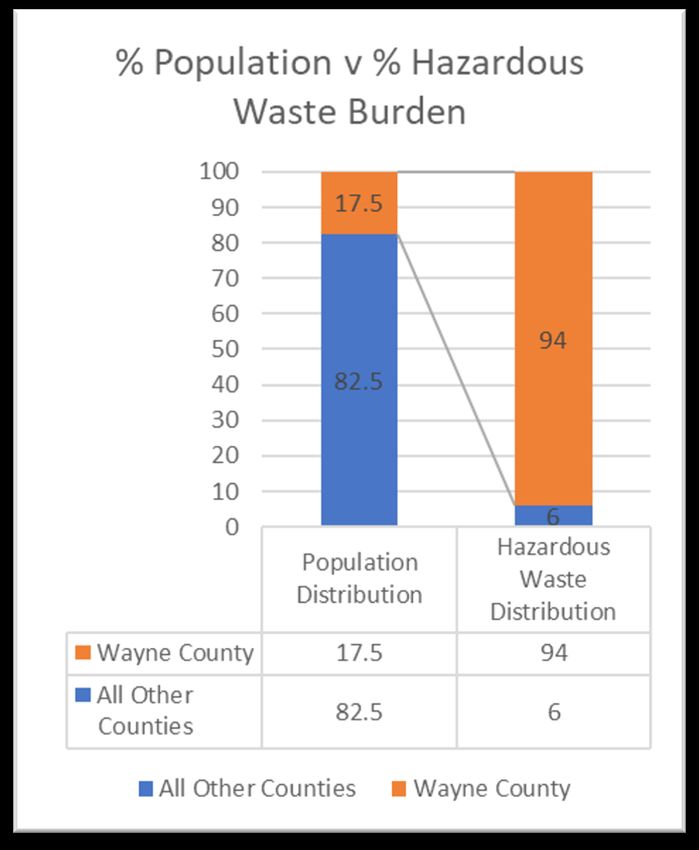
perpetuates the environmental injustice of commercial hazardous waste facilities in Michigan
being disproportionately located in communities of color.

Now, the Complainants are submitting this Complaint for relief under EGLE Policy and
Procedure 09-024, Nondiscrimination in EGLE Programs regarding EGLE’s decision to issue an
amended license to U.S. Ecology North on January 29, 2020, permitting the significant
expansion of its hazardous waste storage capacity.6 Pursuant to EGLE Policy and Procedure 09-
024, any person or group may submit a complaint alleging discrimination of any kind by EGLE,
including discrimination by EGLE that may constitute a violation of 40 C.F.R. Part 7 or any state
or federal statutes or regulations that EGLE enforces.7 Here, the Complainants allege that
EGLE’s decision to issue the amended license to U.S. Ecology North is in violation of Title VI
of the Civil Rights Act of 1964 and the EPA’s Title VI regulations described in 40 C.F.R. Part 7.
Specifically, the Complainants allege as follows:

      •   EGLE discriminated on the basis of national origin by failing to identify limited English
          proficient persons living nearby U.S. Ecology North and by failing to provide adequate
          translation and interpretation services at its community meeting held on March 28, 2019
          in violation of 40 C.F.R. Part 7.
      •   EGLE’ s decision to approve the license modification regarding the U.S. Ecology North,
          which permits a significant expansion of the Facility’s hazardous waste storage capacity,
          violates 40 C.F.R. Part 7.
      •   EGLE’s failure to adopt policies or regulations requiring the consideration of racial and
          economic demographic information in hazardous waste licensing decisions has
          established a pattern or practice of discrimination on the basis of race, color, and national
          origin in violation of 40 C.F.R. Part 7 and 42 U.S.C. § 2000d.

    II.   Complainants

Complainant Michigan Environmental Justice Coalition (“MEJC”) is a statewide coalition of
individuals, organizations, and academic institutions. MEJC works to achieve a clean, healthy,
and safe environment for Michigan’s most vulnerable residents in alignment with the principles
of environmental justice that were drafted and adopted by the delegates to the First National
People of Color Environmental Leadership Summit held on October 24-27, 1991.8

Complainant Sierra Club is the nation’s largest non-profit, grassroots environmental organization
with more than 60 chapters throughout the country. Sierra Club’s purpose is to protect the wild
places of the earth; to practice and promote the responsible use of the earth’s ecosystems and
resources; and to educate and enlist humanity to protect and restore the quality of the natural and
human environments. Sierra Club’s Michigan Chapter has been active in furthering
environmental justice throughout the state.

6
  EGLE Policy and Procedure 09-024, Nondiscrimination in EGLE Programs, Last revised Jan. 21, 2020 (Appendix
C).
7
  Id.
8
  Principles of Environmental Justice, First National People of Color Environmental Leadership Summit, Last
modified Apr. 6, 1996, available at https://www.ejnet.org/ej/principles.html

                                                                                                           3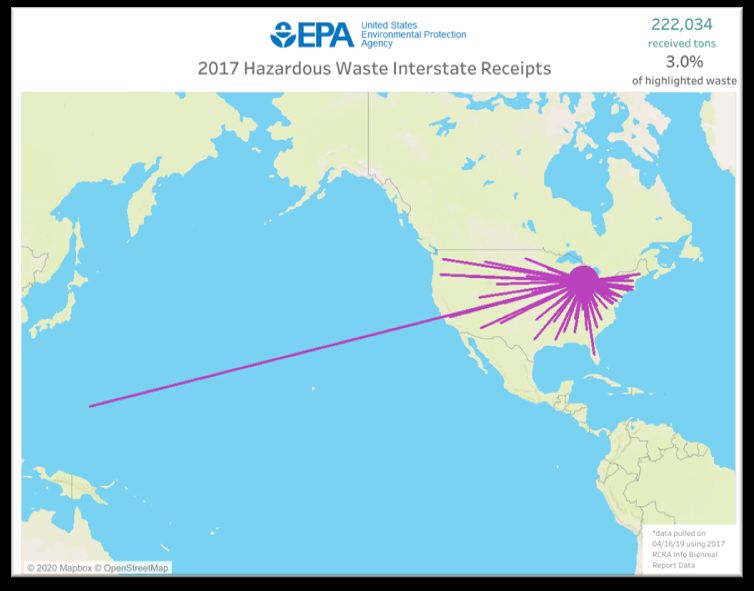
Complainant Pamela McWilliams is a resident of Detroit, Michigan. Her primary residence is
immediately to the south of U.S. Ecology North. She is concerned about the operation of U.S.
Ecology North as well as EGLE’s decision to approve an amended license for the Facility to
allow it to significantly expand its hazardous waste storage capacity. Specifically, she is
concerned that the expansion of U.S. Ecology North’s operations will result in increased adverse
impacts for nearby residents.

Complainant Irene Sinclar is a resident of Detroit, Michigan. Her primary residence is
immediately to the south of U.S. Ecology North. She is concerned about the operation of U.S.
Ecology North as well as EGLE’s decision to approve an amended license for the Facility to
allow it to significantly expand its hazardous waste storage capacity. Specifically, she is
concerned that the expansion of U.S. Ecology North’s operations will result in increased adverse
impacts for nearby residents.

Complainant Kheir Arabi is a resident of Detroit, Michigan. His primary residence is
immediately to the west of U.S. Ecology North. He is concerned about the operation of U.S.
Ecology North as well as EGLE’s decision to approve an amended license for the Facility to
allow it to significantly expand its hazardous waste storage capacity. Specifically, he is
concerned that the expansion of U.S. Ecology North’s operations will result in increased adverse
impacts for nearby residents. He is also concerned about EGLE’s failure to identify limited
English proficient persons living nearby U.S. Ecology North, as well as its failure to provide
adequate translation and interpretation services.

Complainant Mark Covington is a resident of Detroit, Michigan. His primary residence is
immediately to the east of U.S. Ecology North. He is concerned about the operation of U.S.
Ecology North as well as EGLE’s decision to approve an amended license for the Facility to
allow it to significantly expand its hazardous waste storage capacity. Specifically, he is
concerned that the expansion of U.S. Ecology North’s operations will result in increased adverse
impacts for nearby residents.

Complainant Sharon Buttry is a resident of Hamtramck, Michigan, and is an active participant in
the Coalition to Oppose the Expansion of U.S. Ecology. She is concerned about the operation of
U.S. Ecology North as well as EGLE’s decision to approve an amended license for the Facility to
allow it to significantly expand its hazardous waste storage capacity. Specifically, she is
concerned that the expansion of U.S. Ecology North’s operations will result in increased adverse
impacts for nearby residents.

III.    Factual Background

To understand how commercial hazardous waste facilities in Michigan have come to be so
disproportionately located in low-income communities of color, it is necessary to examine the
history of race and housing in places such as Detroit, as well as the history of the environmental
justice movement.

   A. History of Race and Housing in Detroit

                                                                                                     4
From 1910 to 1970, Detroit’s Black population increased from 5,741 to 660,428.9 The most rapid
increase came in the 1940s when Detroit saw its Black population double from roughly 150,000
residents to 300,000 residents.10 This influx of Black residents was part of the Great Migration,
which saw six million Black southerners leave their homes in search of better lives away from
the Jim Crow South in the rapidly industrializing North. The rapid increase in the number of
Black residents from the South led observers to call Detroit “the northernmost southern city” or
“the largest southern city in the United States.”11 With the influx of Black residents came a rise
in racism, which was clearly exhibited in the growing practice of race-based residential
segregation throughout Detroit.
Throughout much of the early and mid-20th century, racial covenants restricting the sale of
property to Black residents was a commonly used tool to maintain housing segregation in a
rapidly changing Detroit. Upon arrival in the 1940s, most Black residents were forced into
overcrowded neighborhoods such as “Paradise Valley” and “Black Bottom” on Detroit’s near-
eastside. In addition to these neighborhoods, Black enclaves were also established in pockets of
Detroit, including a Black enclave nearby the current U.S. Ecology North facility on the border
of Hamtramck. Notably, Black neighborhoods throughout Detroit were consistently redlined for
mortgages in the 1940s. This policy of redlining Black neighborhoods was officially and
expressly approved by federal housing policy.
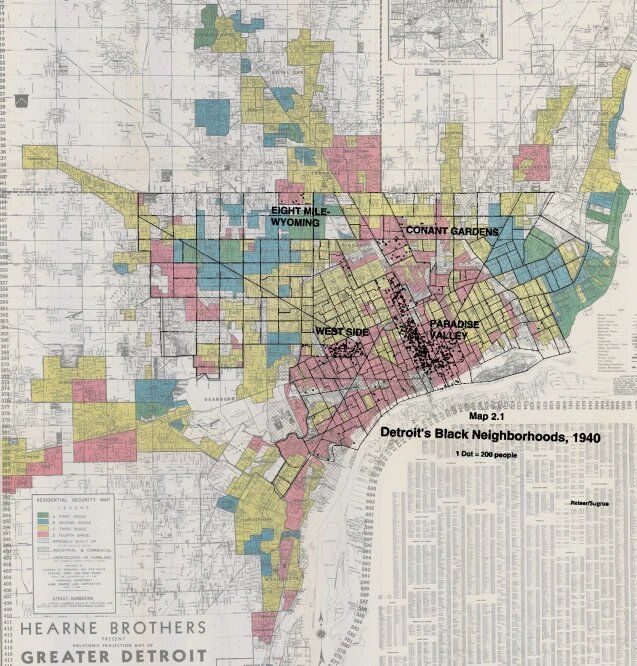
The primary sources used by lenders to determine eligibility for mortgages and home loans were
Security Maps and Surveys developed by Federal Home Loan Bank Board officials.12 These
maps, such as the one provided in Figure 1 below, subdivided Detroit into four sections. The
factors most important to determining a neighborhood’s classification was the level of racial
homogeneity, and the absence of a “lower grade population.”13 Neighborhoods with even a
relatively small Black population, such as the neighborhood nearby the U.S. Ecology North
facility, were given a “D” rating. Additionally, areas that were perceived as “shifting” or were
experiencing “infiltration” by “an undesirable population” were given a “D” rating.14 An area’s
classification had severe consequences. Residents in areas rates “C” or “D” were very unlikely to
qualify for mortgages, and builders and developers were unlikely to receive financial backing for
developments in such neighborhoods.15 In short, federal housing policy legitimized and backed
systemic discrimination against Blacks in housing in Detroit and throughout the country.16
As a result of the widespread use of restrictive, race-based covenants in real estate transactions
and redlining, a rapidly increasing influx of Black residents were trapped in densely packed
neighborhoods with deteriorated housing at inflated prices. By 1947, of the 545,000 housing
units available in Detroit, only 47,000 were available to Blacks.17 Unable to move to newly
9
U.S. Department of Commerce, Bureau of the Census, United States Census of Population, 1910-1970
(Washington, D.C.: U.S. Government Printing Office, various years).
10
Id.
11
Thomas J. Sugrue, The Origins of the Urban Crisis: Race and Inequality in Postwar Detroit, at 23, Princeton
University Press (1996) (hereinafter, “Sugrue”)
12
Sugrue at 43.
13
Id. at 43-44.
14
Id. at 44.
15
Id.
16
Id.
17
Id.
5developed housing units and unable to obtain financing for home improvements, Black
neighborhoods and enclaves throughout Detroit became overcrowded and physically
deteriorated. Black residents converted all types of buildings into housing for the increasing
numbers of new residents. In 1943, eighteen Black families lived in a former church that had
been converted into an apartment building.18 In 1946, Lester Velie described housing
discrimination as “Detroit’s Time Bomb.”19
Figure 1 - Residential Security Map Prepared by the Federal Home Loan Bank Board (1939)
Superimposed by 1940 Mapped Locations of Detroit’s Black Neighborhoods.
18
Id. at 42.
19
Lester Velie, Housing: Detroit’s Time Bomb: Racial Rivalry is the dynamite that makes it dangerous, Collier’s
Weekly, Nov. 23, 1946, pp. 14-15.
6The overcrowding and deterioration of Detroit’s Black neighborhoods lead to municipal plans
for “slum clearance.” While there have been various methods of slum clearance, one such
method was targeting Black neighborhoods for industrial development. As Detroit was
experiencing a large increase in its Black population, its City Planning Commission was
developing its “industrial renewal” policy to revitalize the City’s industrial base.20 To attract
industrial developers, in 1951, the City established industrial corridors in its Master Plan and
proposed to the condemnation and demolition of substandard residential structures that have a
blighting effect in industrial districts.21 As demonstrated by Figure 2 below, the industrial
corridors proposed in Detroit’s 1951 Master Plan coincided very closely with Detroit’s Black
neighborhoods show in in Figure 1, which had been redlined for new residential developments
and mortgages due in large part to federal housing policy.
Figure 2 - Map from City of Detroit’s 1951 Master Plan Proposing Industrial and
Commercial Areas.22
B. History of Environmental Justice
The widespread practice of racial housing discrimination throughout much of the 20th century
ensured that people of color were purposefully restricted from moving to predominantly white
neighborhoods and trapped in deteriorating and overcrowded neighborhoods. To make things
worse, the Detroit government engaged in slum clearance efforts, which targeted Black
communities for condemnation and demolition to make room for industrial developments. This
20
Sugrue at 164.
21
Id.
22
City of Detroit, City of Detroit Master Plan 1951, Industrial and Commercial Land use (1951).
7long-standing practice of housing discrimination and siting industrial developments near
communities of color eventually led to the rise of the environmental justice movement.
The story of the environmental justice movement often starts in North Carolina when the
Governor decided to landfill more than 30,000 gallons of PCB-contaminated soil in Warren
County. North Carolina’s decision to foist this environmental burden on this community was no
accident. Warren County contained the highest percentage of Black residents in North Carolina
and was also the poorest county in the state.23 While Blacks composed only 24% of the state’s
population, they were 63% of the population of Warren County.24 The per capita income for
Warren County residents was approximately $7,000 in 1982, compared to $9,200 for the state.
Warren County ranked 92nd out of 100 counties in median household income in 1980.25 To put it
bluntly, residents in Warren County in 1982 were predominantly Black and low-income.
The Governor’s decision to locate a PCB landfill in a predominantly Black and low-income
community galvanized what is held by many to be the United States' first national environmental
justice protest. Local residents were joined by national civil rights leaders, including Reverend
Leon White of the United Church of Christ’s Commission for Racial Justice, Reverends Joseph
Lowery, Ben Chavis, and Fred Taylor of the Southern Christian Leadership Conference, and
District of Columbia Delegate Walter Fauntroy of the Congressional Black Caucus.26 When the
state attempted to start dumping PCB waste at the landfill, hundreds of protestors laid in the road
to block the trucks. As a result, more than 55 protestors were arrested.27 All told, more than 414
protestors were arrested over the course of several days of protests.28
The decision by North Carolina to site a hazardous waste landfill in a Black community was
indicative of a broader, national problem. Dr. Charles Cobb, the director of the United Church of
Christ’s Commission on Racial Justice, gave voice to these concerns:
We must move in a swift and determined manner to stop yet another breach of
civil rights. We cannot allow this national trend to continue. If it means that every
jail in this country must be filled, then I say let it be. The depositing of toxic
wastes within the black community is no less than attempted genocide.29
The protests soon galvanized multiple reports that demonstrated the truth behind the concern that
hazardous waste facilities were being disproportionately sited in communities of color. In 1982,
Walter E. Fauntroy requested that the United States General Accounting Office (GAO)
determine the correlation between the location of hazardous waste landfills and the racial and
23
Robert Bullard. Dumping in Dixie: Race, Class, and Environmental Quality, http://www.ciesin.org/docs/010-
278/010-278chpt2.html (last visited Jul 23, 2020).
24
Id.
25
Id.
26
Id.
27
Special to the New York Times, 55 Arrested in Protest at a Toxic Dump in Carolina, THE NEW YORK TIMES,
September 16, 1982, https://www.nytimes.com/1982/09/16/us/55-arrested-in-protest-at-a-toxic-dump-in-
carolina.html (last visited Jul 23, 2020).
28
Robert Bullard. Dumping in Dixie: Race, Class, and Environmental Quality, http://www.ciesin.org/docs/010-
278/010-278chpt2.html (last visited Jul 23, 2020).
29
Urban Environment Conference, Inc., Taking Back Our Health: An Institute on Surviving the Toxic Treat to
Minority Communities (Washington, D.C.: Urban Environment Conference, Inc., 1985)
8economic status of the surrounding communities.30 This investigation focused on offsite
hazardous waste landfills that are not a part of or contiguous to any industrial facility located in
the Southeast EPA Region IV. The report found that the three of the four offsite hazardous waste
landfills located in the Southeast were located in communities that were composed of over 50%
Black residents and that at least 26% of the population in each community had an income below
the federal poverty level.31
C. United Church of Christ Report – Toxic Waste and Race
In addition to the GAO report which analyzed the racial and economic demographics of the
communities surrounding offsite hazardous waste landfills in the Southeast, in 1987 the United
Church of Christ’s Commission for Racial Justice conducted a national survey of commercial
hazardous waste facilities and the racial and economic demographics of the communities
surrounding such facilities.32 This report concluded that:33
• Race proved to be the most significant among variables tested in association with the
location of a commercial hazardous waste facility.
• Communities with the greatest number of commercial hazardous waste facilities also had
the highest composition of people of color. Specifically, in communities with two or
more commercial hazardous waste facilities, the average percentage of people of color of
the population was more than three times that of communities without any such facilities.
• Communities with a single commercial hazardous waste facility have an average
percentage of people of color that is twice that of communities without any such
facilities.
• While socioeconomics is an important factor in the location of a commercial hazardous
waste facility, race proved to be the predominant factor.
• Incomes and home families were substantially lower when communities with commercial
hazardous waste facilities were compared to those without such facilities.
The protests in Warren County served as a galvanizing moment, forever entwining the
environmental and civil rights movements to form the environmental justice movement. While
many advancements in environmental justice have been made, little progress has been made to
address the disproportionate siting of commercial hazardous waste facilities in communities of
color.
In 2007, the United Church of Christ surveyed the racial composition of communities living near
commercial hazardous waste facilities 20 years after its original and groundbreaking study. The
study’s findings found that the trends identified in the 1987 report had continued unabated, as
illustrated by Figure 3 below:
30
United States General Accounting Office. Siting of hazardous waste landfills and their correlation with racial and
economic status of surrounding communities. (1983) (Appendix D).
31
Id.
32
United Church of Christ. Toxic Wastes and Race in the United States, (1987), available at
https://www.nrc.gov/docs/ML1310/ML13109A339.pdf
33
Id.
9People of Color Percentages in Neighborhoods with Clustered
Facilities, Non-Clustered Facilities and No Facility
80
69
70
60
51
50
Clustered Facilities
40
33 Non-Clustered Facilities
30 29
30 25 No Facility
20 16
12 12
10 8
4 4
0
% of All People of % African American % Latinx % Asian/Pac. Islander
Color
Figure 3 - Chart Comparing Percentages of People of Color in Neighborhoods with Clustered
Facilities, Non-Clustered Facilities, and No Facilities.34
The disproportionate location of commercial hazardous waste facilities in communities of color
is a national problem. Of the 44 states that have a licensed and operating commercial hazardous
waste facility 40 have disproportionately high percentages of people of color living in
communities with a commercial hazardous waste facility (commonly referred to as a “host
community”).35 In Michigan, the problem is particularly acute. As illustrated by Figure 4 below,
the 2007 United Church of Christ report found that Michigan had the largest difference in the
country between the percentage of people of color in host communities compared to non-host
communities:
34
Robert Bullard, Paul Mohai, Robin Saha, and Beverly Wright, Toxic Wastes and Race at Twenty 1987-2007: A
Report Prepared for the United Church of Christ Justice & Witness Ministries, March 2007 (Appendix A)
35
Id.
10Percentage of People of Color Living In Commercial
Hazardous Waste Host and Non-Host Communities
70 66
60
50
44
40
Host Communities
30 Non-Host Communities
23
19
20
10
0
Michigan Nationwide
Figure 4 - Chart Comparing Percentage of People of Color Living in Commercial Hazardous
Waste Host Communities with Percentages in Non-Host Communities in Both Michigan and
Nationwide.36
In summary, more than 20 years after the birth of environmental justice, significant racial
disparities in the distribution of commercial hazardous waste facilities persist throughout the
country.37 Nowhere is this more true than Michigan, where the racial disparity regarding the
location of commercial hazardous waste facilities is at its most severe.38
D. U.S. Ecology North Hazardous Waste Facility
As discussed above, the neighborhood surrounding the U.S. Ecology North facility was one of
Detroit’s first Black enclaves in the 1940s. Despite the pervasiveness of housing discrimination
and “slum clearance” efforts that sought to transform the neighborhood into an industrial
corridor, to this day, it remains a vibrant and diverse community. It includes people such as
Complainant Ms. McWilliams has lived in her home to the south of U.S. Ecology North for 33
years and who loves her neighborhood but is genuinely concerned about pollution from nearby
industrial sites. It also includes people like Complainant Mr. Arabi, who lives to the west of U.S.
Ecology North in the predominantly Yemeni-American community.
36
Id.
37
Id.
38
Id.
11i. Demographics of the Surrounding Community
The communities that exist within a 3-mile radius of the Facility, while diverse, are
disproportionately people of color and low-income as demonstrated by Figure 5 below:39
Comparison Between Percentage of People of Color, Low-
Income, and Limited English Proficient Persons - U.S.
Ecology and the State of Michigan
90%
80%
80%
70%
70%
60%
50%
40%
30% 25%
20% 14% 12%
10% 2%
0%
% Low-Income % People of Color % Limited English Proficient
Within 3-mile of U.S. Ecology North State Average
Figure 5 - Chart Comparing Percentages of People of Color, Low-Income, and Limited English
Proficiency within 3 miles of U.S. Ecology North v Statewide Data.40
In its summary of the history of the U.S. Ecology North facility, EGLE states that the
“surrounding area has gone from residential to industrial.”41 This callous statement ignores the
history of housing discrimination and slum clearance for industrial activity that turned what was
once one of Detroit’s few Black enclaves into a community that is disproportionately composed
of low-income people of color. EGLE’s statement is also plainly incorrect, as thousands of
people live nearby the Facility. Specifically, 2,005 people live within a 0.5-mile radius of the
Facility and 8,910 people live within a 1-mile radius of the Facility.42 As illustrated by the map
below, the Facility is just over 200 meters from the nearest occupied residential housing, 300
meters from a church, and 500 meters from a children’s playground. In all, four playgrounds,
five parks, seven nursing homes, three mosques, 11 churches, four pre-school head start
programs, three elementary and middle schools, and a high school are located within a 1.5-mile
39
Low-income refers to any person whose ratio of household income to poverty level in the past 12 months was less
than 2.
40
EJSCREEN Report (Version 2019), 3-mile ring centered at U.S. Ecology North; LEP data from U.S. Census
Bureau. (2017). 2011-2015 ACS 5-year Estimates. Retrieved from https://data.census.gov/
41
Michigan Department of Environmental Quality. US Ecology Detroit North (formerly Dynecol) Summary Report.
https://www.michigan.gov/documents/deq/USE_565_summary_529374_7.pdf
42
United States Environmental Protection Agency. 2019 version. EJSCREEN. Retrieved July 22, 2020, from
https://ejscreen.epa.gov/mapper/demogreportpdf.aspx?report=acs2017. US Census Bureau, American Community
Survey (ACS) 2013-2017.
12radius of this hazardous waste facility. The neighborhood surrounding U.S. Ecology is plainly
not “industrial.”
Figure 6 - Map of schools, houses of worship, playgrounds, parks, and nursing homes within 1.5
miles of US Ecology North
The effect in asserting the falsehood that the “surrounding area has gone from residential to
industrial” in response to the concerns of citizens is to deny the existence of these communities.
In reality, US Ecology North exists is on a slim industrial zone surrounded on three sides by
residential housing (green in the image below).43 3,730 housing units are located within a 1-mile
radius of the facility.44
43
City of Detroit, Zoning Portal. https://zoning.detroitmi.gov/projects/381907/guide/location
44
United States Environmental Protection Agency. 2019 version. EJSCREEN. Retrieved July 22, 2020: from
https://ejscreen.epa.gov/mapper/demogreportpdf.aspx?report=acs2017. US Census Bureau, American Community
Survey (ACS) 2013-2017.
13Figure 7 – Map of Residential Areas Nearby U.S. Ecology North45
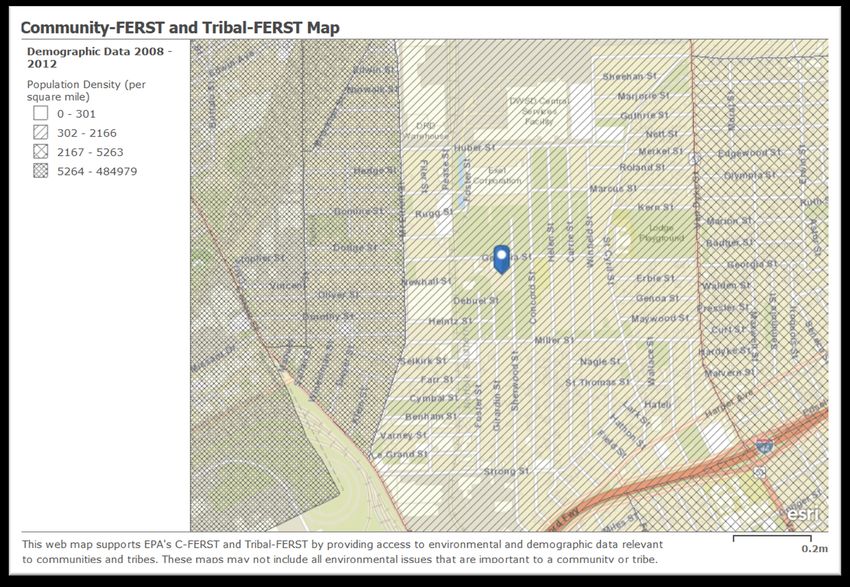
The sheer density of residential housing in the census tract where the Facility is located makes
for an average population density of 1,120 individuals per square mile, over six times the state
average population density.46 A half-mile to the east marks the start of another census tract,
hosting a population density of 5,209 people per square mile, over 25 and a half times the state
average population density.47 The census tract beginning a mere .25 miles west of the Facility
hosts a population density of 7,567 individuals per square mile, 43 times the state average
population density.48 Beginning less than one mile from the facility is the densest census tract in
the entire state of Michigan outside of the Michigan State University Campus in East Lansing.49
Located in Hamtramck, the tract has a population density of 19,323 individuals per square mile,
109 times the state average population density. 50
45
City of Detroit, Zoning Portal. https://zoning.detroitmi.gov/projects/381907/guide/location
46
United States Census Bureau, 2008-2012 ACS 5 Year Dataset. (2013). Retrieved from EPA Community FERST
47
Id.
48
Id.
49
Id.
50
Id.
14Figure 8 - Map of Population Density Near U.S. Ecology North by Census Tract51
In short, EGLE’s assertion that the area surrounding U.S. Ecology North has transitioned from a
residential to an industrial area is not only incorrect, but it is also having the harmful effect of
continuing the erasure of the many people of color that do live nearby the Facility.
To place U.S. Ecology North in context, it is helpful to compare it to another commercial
hazardous waste facility in Michigan. Comparing the demographics of the communities
surrounding U.S. Ecology North with that of Drug and Laboratory Disposal, Inc, which is the
only commercial hazardous waste facility in Michigan that is outside of the metro-Detroit area,
helps to bring the environmental injustice into focus. Residing in Allegan County, Drug and
Laboratory Disposal Inc.’s census tract has an average density of 305 people per square mile.52
The only other census tract within a mile of the facility hosts a density of only 247 individuals
per square mile.53 More people live within a three-mile radius of U.S. Ecology North
encompassing 28 square miles than within an 11-mile radius of Drug and Laboratory Disposal,
an area encompassing a total of 380 square miles54 Accompanying the area’s low density is the
smallest percentage of minorities, the lowest percentage of low-income households and limited
English proficiency individuals within 3 miles of any of Michigan’s commercial hazardous waste
51
United States Census Bureau, 2008-2012 ACS 5 Year Dataset. (2013). Retrieved from EPA Community FERST
52
United States Census Bureau, 2008-2012 ACS 5 Year Dataset. (2013) Retrieved from https://data.census.gov/
53
Id.
54
Id.
15facilities, as well as the lowest amount of tonnage received both as a total and that which came
from out of state.
Table 1 - Demographic and Tonnage Data Comparison Between U. S. Ecology North and Drug
and Laboratory Disposal55
Facility LEP per % Total Tons Total Tons Total Tons Percent of
square Minority of of of Total Tons
mile within 3 Hazardous Hazardous Hazardous of Hazardous
within 3 miles Waste Waste from Waste from Waste from
miles Received MI Outside Out of State
County
Drug and 5 7% 942 850 812 9.7%
Laboratory
Disposal
US Ecology 468 80% 22,409 18,069 17,776 19.4%
North
In summary, the communities surrounding U.S. Ecology North are socioeconomically
vulnerable, which puts them at risk for just the type of expansion that U.S. Ecology North
proposed to EGLE. Almost 40 years after the residents of Warren County steadfastly declared
their right to live free of the disparate burden of toxins, the residents living nearby U.S. Ecology
North staged numerous protests and packed public hearings to oppose the state’s decision to
allow their community to be a dumping ground for hazardous waste.56 In comment after
comment, they decried the inequity inherent in approving a major expansion of a commercial
hazardous waste facility in a low-income community of color, and the adverse impacts that such
a decision will bring. The Detroit and Hamtramck community has proudly built upon the legacy
55
U.S. Census Bureau. 2011-2015 ACS 5-year Estimates. (2017). Retrieved from https://data.census.gov/; United
States Environmental Protection Agency, RCRAInfo Public Extract. Retrieved from https://rcrapublic.epa.gov/rcra-
public-export/?outputType=CSV.
56
See generally Neighbors, Residents Protest Expansion of Hazardous-Waste Plant,
https://www.publicnewsservice.org/2017-08-23/water/neighbors-residents-protest-expansion-of-hazardous-waste-
plant/a59071-1 (last visited Jul 22, 2020).; Group rallies against expansion of waste facility near Detroit-
Hamtramck border, , https://www.detroitnews.com/story/news/local/detroit-city/2019/06/29/group-rallies-against-
expansion-waste-facility-near-detroit-hamtramck-border/1607128001/ (last visited Jul 22, 2020); Sarah Cwiek,
Protesters keep up the fight against U.S. Ecology Detroit expansion, https://www.michiganradio.org/post/protesters-
keep-fight-against-us-ecology-detroit-expansion (last visited Jul 22, 2020); Steve Neavling, Expansion of hazardous
waste plant in Detroit smacks of “environmental racism,” Rep. Robinson says, DETROIT METRO TIMES,
https://www.metrotimes.com/news-hits/archives/2020/01/31/expansion-of-hazardous-waste-plant-in-detroit-smacks-
of-environmental-racism-rep-robinson-says (last visited Jul 22, 2020); Mary Schuermann Kuhlman, Michiganders
find solidarity in fighting hazardous waste, DETROIT METRO TIMES , https://www.metrotimes.com/news-
hits/archives/2020/02/12/michiganders-find-solidarity-in-fighting-hazardous-waste (last visited Jul 22, 2020).
16of Warren County. It has also been informed by the mountains of data and research that the
Warren County protests inspired that continues to pile the now irrefutable evidence that
discrimination, whether outright in the past or self-perpetuating in the present, continues to
impact decision making when siting hazardous waste facilities.57
ii. Environmental Quality of the Surrounding Area
The community understands the reality: that the operation of U.S. Ecology North presents
serious public health risks for nearby residents. However, U.S. Ecology North does not exist in
isolation. In addition to the Facility, numerous other industrial facilities are located nearby,
including Strong Steel, Universal Logistics, and Flex-n-Gate. When the impact of all these
facilities is considered cumulatively, it is apparent that the community is subject to a
disproportionate level of a variety of environmental risks. As shown by Table 2 below, the 3-
mile ring centered at the US Ecology facility ranks in the 90th percentile or higher for seven
57
See Bonam, C. M., Bergsieker, H. B., & Eberhardt, J. L. (2016). Polluting Black space. Journal of Experimental
Psychology: General, 145(11), 1561–1582. (Where a national sample of over 400 white U.S. citizens were asked to
read a proposal to build a potentially hazardous chemical plant near a residential neighborhood. Half of the
participants were told the nearby neighborhood is mostly black, while the other half was told that the area is mostly
white. Even though all participants read the same proposal, they were less likely to report opposition to building the
chemical plant when the nearby neighborhood was mostly black.)
17harmful environmental indicators, including levels of particulate matter, diesel particulate matter,
the cancer risk from air toxins, risk of respiratory hazards, and proximity to sites mandated to
produce Risk Management Plans.58 Tied for worst of all indicators, the community is in the 94th
percentile in the state for its proximity to hazardous waste.59 A mere 6% of the state faces a
higher risk in this regard.
Environmental Indicators: 3-mile Ring Centered at 6520 Georgia St, Detroit, MI
Statewide Within 3mi radius Percentile in
Variable Average of US Ecology State
Particulate Matter (PM 2.5 in ug/m3) 8.56 9.61 90
Ozone (ppb) 44.0 45.7 88
NATA Diesel PM (ug/m3) 0.34 0.68 94
NATA Air Toxics Cancer Risk (risk per MM) 24 30 94
NATA Respiratory Hazard Index 0.29 0.37 93
Traffic Proximity and Volume (daily traffic count/distance to road) 660 1800 91
Lead Paint Indicator (% pre-1960s housing) 38% 80% 87
Superfund Proximity (site count/km distance) 0.15 0.07 53
RMP Proximity (facility count/km distance) 0.53 2.00 94
Hazardous Waste Proximity (facility count/km distance) 1.00 3.70 94
Wastewater Discharge Indicator (toxicity-weighted concentration/m distance) 0.23 1.00E-05 49
Table 1 – Comparing EPA Environmental Indicators Within 3-Mile Ring Centered at U.S.
Ecology North Facility with Michigan Statewide Average and Area’s Percentile For Each
Indicator as Compared to Rest of State of Michigan.
When the demographic and environmental indicators generated by the EPA’s EJSCREEN are
combined, the picture facing communities among whom this hazardous waste site stands
becomes clear. In this area, one of the most densely populated sites in the state, the EPA tool
estimates residents are within the 87th to 97th percentile in the state for every applicable
Environmental Justice risk.60
58
United States Environmental Protection Agency. 2019 version. EJSCREEN. Retrieved July 22, 2020: from
https://ejscreen.epa.gov/mapper/ejscreen_SOE.aspx.
59
Id.
60
United States Environmental Protection Agency. 2019 version. EJSCREEN. Retrieved July 22, 2020: from
https://ejscreen.epa.gov/mapper/ejscreen_SOE.aspx.
18Environmental Justice Indexes: 3-mile Ring Centered at 6520 Georgia St, Detroit, MI
Percentile in
Variable State
EJ Index for Particulate Matter (PM 2.5) 92
EJ Index for Ozone 92
EJ Index for NATA Diesel PM 95
EJ Index for NATA Air Toxics Cancer Risk 93
EJ Index for NATA Respiratory Hazard Index 93
EJ Index for Traffic Proximity and Volume 95
EJ Index for Lead Paint Indicator 93
EJ Index for Superfund Proximity 90
EJ Index for RMP Proximity 97
EJ Index for Hazardous Waste Proximity 96
EJ Index for Wastewater Discharge Indicator 87
Table 2 - EJSCREEN Report (Version 2019)
The Environmental Justice Index reaching the second-highest percentile of risk is, even before
this expansion, the proximity to hazardous waste. When combining the area’s data on
demographics with that of nearby hazardous waste sites, the Environmental Justice Index for
hazardous waste proximity for the 3-mile ring centered at the US Ecology facility is already at a
higher risk of environmental injustice due to hazardous waste than 96% of Michigan, before any
additional expansion of capacity has begun.61
iii. Location of Origin Regarding Hazardous Waste Received by U.S. Ecology North
As detailed above, the communities surrounding U.S. Ecology North are diverse and vibrant but
are also socioeconomically and politically vulnerable because they are predominantly composed
of low-income people of color. Given this vulnerability, these communities have been targeted
for industrial development since the 1950s, which has resulted in a number of industrial sites
locating in this dense urban neighborhood. This has caused the surrounding communities to be
exposed to high levels of a variety of environmental risks.
To make matters worse, their community is serving as a hazardous waste dumping ground that
primarily serves other communities throughout the state and country. Data from US Ecology
North’s 2017 Biennial Report shows that 98.38% of the waste received by the Facility came
from outside of Wayne county. A summary of the place of origin for wastes received by U.S.
Ecology North is provided in Table 4 below:
//
//
61
Id.
19Table 4 - Place of Origin Regarding Wastes Received by U.S. Ecology in 201762
Total Tons From In-State From Wayne From Other From Out of
Received County MI Counties State
Tons 22,409 18,069 292 17,776 4,340
Percent - 80.63% 1.62% 79.01% 19.37%
E. Commercial Hazardous Waste Facilities in Michigan
U.S. Ecology North does not exist in isolation. It is one of several commercial hazardous waste
facilities that exist throughout Michigan. Unfortunately, most commercial hazardous waste
facilities in Michigan are similar to U.S. Ecology North in that they are disproportionately
located in low-income communities of color. Additionally, most of the hazardous waste received
by these facilities originated outside of Michigan.
i. Demographic Data Regarding Communities Nearby Commercial Hazardous Waste
Facilities
Michigan currently houses eight hazardous waste facilities permitted to accept offsite waste.63 As
demonstrated by Table 5 below, of these eight facilities, seven are in communities where the
percentage of people of color within a three-mile radius of the facility is at or above the
statewide average.64 Five are located in communities where within a three-mile radius of the
facility, the percentage of low-income residents is above the statewide average.65
//
//
//
//
//
62
2017 Biennial Report, U.S. Ecology North
63
Michigan Department of Environmental Quality, Waste Data System,
https://www.deq.state.mi.us/wdspi/AdvancedSearch.aspx (last visited Jul 22, 2020).
64
United States Environmental Protection Agency. 2019 version. EJSCREEN. Retrieved July 22, 2020: from
https://ejscreen.epa.gov/mapper/ejscreen_SOE.aspx.
65
Id. (EPA calculates “percent low-income” as percent of individuals whose ratio of household income to poverty
level in the past 12 months was less than 2 as a fraction of individuals for whom ratio was determined. Calculated
from the Census Bureau's American Community Survey 5-year summary estimates.)
20Demographic Data of MI Hazardous Waste Treatment Facilities Accepting Offsite Waste Compared to State Averages
Specific Site Name City, County % Low Income within 3 Mi Radius * % Minority within 3 mi Radius
Wayne Disposal Inc. Belleville, Wayne 30% 39%
Michigan Disposal Waste Treatment Plant Belleville, Wayne 30% 39%
US Ecology Detroit North Detroit, Wayne 70% 80%
PSC Environmental Services Detroit, Wayne 55% 79%
US Ecology Detroit South Detroit, Wayne 65% 75%
Gage Products Co. Ferndale, Oakland 44% 54%
Drug & Laboratory Disposal, Inc. Plainwell, Allegan 29% 7%
Republic Industrial and Energy Solutions Romulus, Wayne 46% 40%
Michigan Average 33% 25%
Table 3 - EJSCREEN Report (Version 2019), 3-mile ring centered on Michigan commercial
hazardous waste facilities
When analyzed cumulatively, of all the Michiganders living within 3-miles of a commercial
hazardous waste facility accepting offsite waste, 55% are low-income, and 65% are minorities as
defined by the US Census Bureau. As shown by Figure 9, while the total population of
individuals living within 3-miles of these facilities makes up just 5% of Michigan’s population, it
makes up 14% of the state’s total population of minorities.
Demographic Makeup of Total Population Living within 3 mile
Radius of Comercial Hazardous Waste Facilities Accepting
Offsite Waste Compared to Statewide Population
70% 65%
60% 55%
50%
40%
33%
30% 25%
20%
10%
0%
% Low Income % Minority
Population within 3mi Radius MI Total Population
Figure 9
21In addition to commercial hazardous waste facilities being disproportionately located in low-
income communities of color, they are also disproportionately located in limited English
proficient communities. 21,975 individuals with limited English proficiency, 7 percent of the
statewide total, live within 3 miles of Michigan’s eight hazardous waste facilities.66 As illustrated
by Table 6, the density of limited English proficient individuals within 3 miles of each of the
eight facilities exceeds the Michigan average.67 In total, the average density of limited English
proficient individuals within the areas encompassing the 3-mile radii of all of the facilities is 148
per square mile, greater than the Michigan average of 3.1 per square mile by a factor of nearly
48.68
Table 6 - Density of LEP persons per square mile for area within 3-mile
radius of each commercial hazardous waste facility
Facility Density of LEP per square mile
within 3-mile radius of facility
Michigan Average 3.1
Republic Industrial 77.64
Michigan Disposal 25.73
Wayne Disposal 25.73
Drug and Laboratory Disposal, Inc. 5.02
PSC Environmental Services 20.67
EQ Detroit 401.98
US Ecology North 468.72
Gage Products Co 159.41
Six of the eight facilities reside in Wayne County, with one more sitting a mere 495 meters from
the county’s border. Wayne County hosts the largest and most densely populated Limited
English Proficiency communities in the state, with an average density of limited English
proficient persons per square mile that is 3,817% that of the state average.69
ii. Location of Origin Regarding Hazardous Waste Received by All Michigan Commercial
Hazardous Waste Facilities
As discussed above, Michigan’s trend of siting commercial hazardous waste facilities in low-
income communities of color has continued unabated for several decades. In 2007, the United
Church of Christ found Michigan to be the worst state when it came to disproportionately siting
commercial hazardous waste facilities in communities of color. That legacy of environmental
injustice has to date been left intact, unchallenged, and unaltered.
66
U.S. Census Bureau. 2011-2015 ACS 5-year Estimates. (2017). Retrieved from https://data.census.gov/
67
Id.
68
U.S. Census Bureau. 2011-2015 ACS 5-year Estimates. (2017). Retrieved from https://data.census.gov/
69
Id.
22To make matters worse, there does not
appear to be any logistical justification for
siting commercial hazardous waste
facilities in these communities. As shown
by Table 7, all but one of these facilities
imported over 90% of their hazardous
waste from outside the county they are
located.70 In total, 222,034 tons of
hazardous waste were imported into
Michigan in 2017, roughly equivalent to
the weight of Chicago’s Sears Tower71 or
8 Statue of Liberties.72 As shown by
Figure 10, the imported waste traveled
from far and wide, including 317 tons
making the over 7,000 mile trip across the Figure 10 – Map demonstrating the location of origin for
world from the Northern Mariana Islands, shipments of hazardous waste received by commercial
1000 miles off the coast of Japan, to make hazardous waste facilities in Michigan
Michigan its resting place.73
//
//
//
//
//
//
//
//
//
/
70
Id.
71
History & Facts—Willis Tower, https://www.willistower.com/history-and-facts (last visited Jun 29, 2020).
72
Mailing Address: Liberty Isl, New York & NY 10004 Phone:363-3200 Contact Us, Statue Statistics—Statue of
Liberty National Monument (U.S. National Park Service), https://www.nps.gov/stli/learn/historyculture/statue-
statistics.htm (last visited Jun 29, 2020).
73
United States Environmental Protection Agency, 2017 Hazardous Waste Interstate Shipments and Receipts,
https://public.tableau.com/shared/M4D9KK239?:display_count=y&:origin=viz_share_link&:embed=y (last visited
Jul 22, 2020).
23You can also read