MAKING SENSE OF STATE FISH ADVISORIES - A Policy-Maker's Guide to Mercury, Fish and Public Health - SPPI
←
→
Page content transcription
If your browser does not render page correctly, please read the page content below

MAKING SENSE OF STATE
  FISH ADVISORIES
  A Policy-Maker's Guide to Mercury,
        Fish and Public Health
            by Robert Ferguson

          SPPI REPRINT SERIES    ♦   March 2005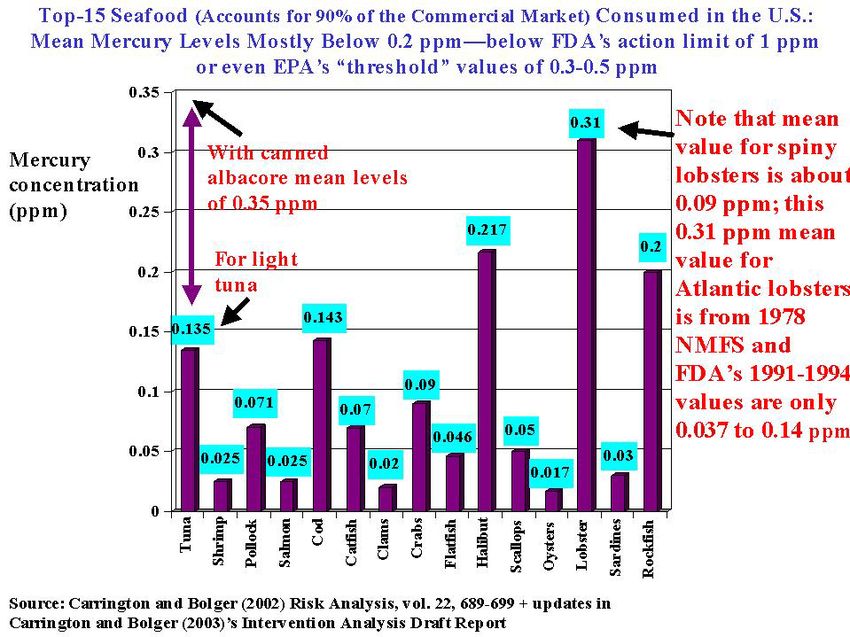
TABLE OF CONTENTS
EXECUTIVE SUMMARY .................................................................................................................... 4

SECTION 1 – SOME FREQUENTLY ASKED QUESTIONS ............................................................. 5

SECTION 2 – FISH ADVISORY LISTINGS: INTRODUCTION AND OVERVIEW ............................... 9

SECTION 3 – HOW ACCURATE ARE STATE ADVISORIES? ARE THEY
            REALLY THAT USEFUL? ...................................................................................... 14
                              FEDERAL ACTIONS ........................................................................................... 14
                              STATE ACTIONS ............................................................................................... 15
                              SCIENCE BEHIND THE ADVISORIES ...................................................................... 16
                              SECTION SUMMARY ......................................................................................... 19

SECTION 4 – SOME OF THE ASSUMPTIONS UNDERLYING STATE FISH ADVISORIES
            ARE LIKELY SCIENTIFICALLY WRONG................................................................. 20

SECTION 5 – WORKING HYPOTHESIS FOR EXPLAINING RECENT
            FISH ADVISORY TRENDS .................................................................................... 25

SECTION 6 – SPECIFIC EXAMPLES OF STATE ADVISORIES: ALASKA, MARYLAND,
            PENNSYLVANIA, AND VIRGINIA.......................................................................... 29
                              ALASKA .......................................................................................................... 31
                              MARYLAND ..................................................................................................... 33
                              PENNSYLVANIA ................................................................................................ 35
                              VIRGINIA ......................................................................................................... 36

SECTION 7 – MOST STATES ADOPT EPA’S ULTRA-PRECAUTION AS BASIS
            FOR FISH ADVISORIES ........................................................................................ 37

SECTION 8 – “FIRST DO NO HARM” – POTENTIAL FOR PUBLIC CONFUSION
            AND NEGATIVE HEALTH CONSEQUENCES .......................................................... 40

SECTION 9 – LIFE CYCLE OF MERCURY................................................................................... 48

SECTION 10 – CONCLUSIONS .................................................................................................... 50

ENDNOTES .................................................................................................................................... 52

                                                                                                                                                 2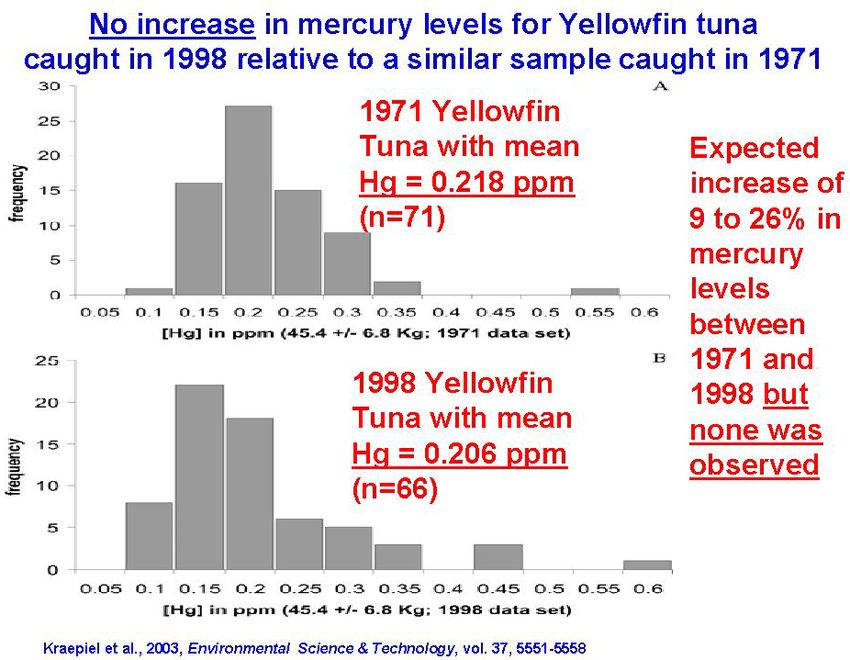
“National fish consumption advisories that are based solely on assessment
of risk of exposure to contaminants without consideration of consumption
benefits result in overly restrictive advice that discourages eating fish even
in areas where such advice is unwarranted. In fact, generic fish advisories
may have adverse public health consequences because of decreased fish
consumption and substitution of foods that are less healthy.

 “Public health is on the threshold of a new era for determining actual
 exposures to environmental contaminants, owing to technological
 advances in analytical chemistry. It is now possible to target fish
 consumption advice to specific at-risk populations by evaluating
 individual contaminant exposures and health risk factors. Because of the
 current epidemic of nutritionally linked disease, such as obesity,
 diabetes, and cardiovascular disease, general recommendations for
 limiting fish consumption are ill conceived and potentially dangerous.”

 – Scott M. Arnold, PhD, Tracey V. Lynn, DVM, MS, Lori A. Verbrugge, PhD and
 John P. Middaugh, MD, (2005) American Journal of Public Health, vol. 95, 393-
 397

 “We do not believe that there is presently good scientific evidence that
 moderate fish consumption is harmful to the fetus. However, fish is an
 important source of protein in many countries and large numbers of
 mothers around the world rely on fish for proper nutrition. Good
 maternal nutrition is essential to the baby’s health. Additionally, there is
 increasing evidence that the nutrients in fish are important for brain
 development and perhaps for cardiac and brain function in older
 individuals.”

 – Dr. Gary Myers, a leading scientist of the Seychelles Island Child Development
 Study in his July 29, 2003’s testimony to the U.S. Senate Environment and Public
 Work Committee

 “Fish intake by the mother during pregnancy and by the infant
 postnatally, was associated with higher mean [child] development
 scores. For example, the adjusted mean MacArthur comprehension score
 for children whose mothers consumed fish four or more times per week
 was 72 ... compared with [a score of] 68 among those whose mothers did
 not consume fish. ...Although the total cord mercury levels increased with
 maternal fish intake, our data did not suggest adverse developmental
 effects associated with mercury.”

 – Daniels et al. (2004) Epidemiology, vol. 15, 395-402

                                                                                    3
MAKING SENSE OF STATE FISH ADVISORIES
   A Policy-Maker's Guide to Mercury, Fish and Public Health

                              by Robert Ferguson | March 2005

EXECUTIVE SUMMARY

This paper focuses on currently wide-spread and growing State fish consumption advisories.
State notices are attributed to health concerns about “contaminants” such as traces of fish
methylmercury (MeHg) in a wide range of aquatic systems including lakes, rivers, watershed
basins and coastal zones. State issued advisories are in addition to – and sometimes conflict
with – federal advisories.

The 2003 National Listing of Fish Advisories (NLFA) released by the U. S. Environmental
Protection Agency (EPA) in August 2004 is the 12th annual listing since the first such
collection of locally issued fish advisories and safe eating guidelines in 1993. Despite EPA
caution against inappropriate extrapolation or inferences from NLFA statistical data, there is
a persistent pattern of public misinformation and alarmism suggesting that trends in the
number of fish advisories evidence progressively worsening mercury (Hg) “pollution” of
U.S. fresh water and marine fish. EPA rejects this notion.

Corollary to the scientifically weak notion of increasing levels of mercury in fish is the
hypothesis directly linking traces of the biologically active form of mercury (MeHg) in fish to
Hg emissions from industrial sources, especially coal-fired power plants. Computer models
based on this hypothesis tend to predict a linear response, but there are little data to support
their predictions.

The science reported in current peer-reviewed literature strongly suggests that
methylmercury has existed in fish and fish consumers (human and wildlife) since both
evolved on earth. This natural and historical condition predominately derives from Earth’s
geology and marine ecodynamics.

State advisories vary widely and can appear confusing, subjective and even arbitrary.
Advisory rules often are set according to differing thresholds, definitions, needs, and
political pressures within each State.

EPA’s own ultra-precautionary approach to MeHg influences final determinations of “safe”
versus “unsafe” underlying the various and disparate State fish advisories. Ominously, there
appears to be a trending tendency for some States rationalizing even lower fish MeHg criteria
for issuing fish consumption safety advisories. Such decisions appear based on a dose-
challenged belief that if less exposure is good then near-zero exposure must be better.

                                                                                              4
This hyper-cautious approach seems to accord little to no consideration to potential loss of
substantial nutritional benefits derived from fish consumption, especially for pregnant
women and children. The employment of “precaution” in formulating fish advisories
seems to work strictly in one direction only – toward tighter regulation and away from
better public health. This is particularly grave relative to women’s health impacts such as
pre-term delivery and low birth weight, fetal brain development, cardiac health, breast
cancer, type 2 diabetes, postpartum depression, bipolar disorders, and even suicidal
ideation. (Alaska’s reluctance to issue any consumption advisories for fish caught in its
waters appeared to be based on such a thoughtful balancing of health concerns.)

In other words, calls for reductions in fish consumption inherent in fish advisories, should be
balanced against concerns for widespread, unintended public health loss. The most
fundamental principle for any fish consumption advisory must be to do no harm. Policy
makers should weigh the indisputable fact that sometimes excessive or wrong regulation can
be as, or more, deleterious than none at all.

This requires considering some pertinent questions concerning risk. How cautious is caution?
Is there a point at which caution itself becomes harmful; where hyper-precaution becomes
irrational to the point of becoming the greater risk; a point at which the resulting alarmism
can damage public health by frightening consumers away from nutritional fish consumption?

A more rational, informed and calm framework for dealing with MeHg exposure through
fish consumption is urgently needed.

[n.b.: This paper is meant to be a reference, covering a wide range of literature and issues
associated with State issued fish consumption advisories and their rationale; it also
demonstrates that the subject of mercury and human health is more complex and far less
alarming than often portrayed. It is also meant to be read more than once, including the
extensive endnotes. Much important information and references have been placed in the
endnotes in order to help the main text flow well.]

                     SECTION 1 –SOME FREQUENTLY ASKED QUESTIONS

QUESTION #1: What is an advisory and how are advisories developed?

ANSWER #1: According to EPA,

   “If elevated concentrations of chemicals, such as mercury or dioxin, are found in local
   fish and certain water-dependant wildlife (such as ducks or turtles), then a State may
   issue health advice to the public in the form of fish consumption advisory. A fish
   consumption advisory may include recommendations to limit or avoid eating certain
   fish species caught from specific water bodies or, in some cases, from specific water
   body types (e.g., all lakes). An advisory may be issued for the general population, or
   for specific groups such as recreational and subsistence fishers, or for sensitive
   subpopulations such as pregnant women, nursing mothers, and children. A
                                                                                             5
consumption advisory is not a regulation, but rather a voluntary recommendation
   issued to inform people.” 1

QUESTION #2: Why are there so many more advisories now than 12-13 years ago?

ANSWER #2: The issuing of an increasing number of fish advisories runs counter to available
evidence showing decreasing trends in many pollutants (including mercury) since the 1970s.
It seems clear, therefore, that the increase in the number of advisories is not related to
reputed increased levels of methylmercury (MeHg) in fish, or to increasing pollution. The
increase in advisories likely represents political decisions influenced by a range of factors.
(See Section 5.)

EPA specifically noted that:

   “The increase in the number of river miles placed under advisory in 2003 is due to new
   State-wide mercury river advisories in three States: Washington, Montana, and
   Wisconsin. State-wide advisories are issued as a precautionary measure when fish
   monitoring data indicate widespread contamination has been detected in certain
   species of fish or certain types of water bodies (e.g., rivers).” [Emphasis added.]

In other words, when States transition from more limited “site-specific” advisories to State-
wide advisories a very large amount of lake acres and rivers miles are suddenly added to
EPA’s data base in that year, with little or no relevance to actual increases in air pollution or
levels of MeHg in fish tissue compared to the previous year. EPA’s cautions anticipated
many popular claims that are now misrepresenting fact and reality.

QUESTION #3: How many States have State-wide advisories?

ANSWER #3: In the 2003 National Listing of Fish Advisories released August 2004, a total of
45 States had issued at least one fish mercury advisory. 21 States (Connecticut, Florida,
Illinois, Indiana, Kentucky, Maine, Maryland, Massachusetts, Michigan, Minnesota, Missouri,
Montana, New Hampshire, New Jersey, North Dakota, Ohio, Pennsylvania, Rhode Island,
Vermont, Washington, and Wisconsin) had issued State-wide advisories for mercury in at
least one species of fish in inland freshwater lakes and rivers. As explained by EPA, a State-
wide advisory is issued mainly as a precautionary measure rather than any fact-based
documentation of actual increased contamination from industrial sources.

In addition, 12 States (Alabama, Florida, Georgia, Hawaii, Louisiana, Maine, Massachusetts,
Mississippi, North Carolina, Rhode Island, South Carolina, and Texas) had issued State-wide
advisories for fish mercury in their coastal waters. The Micmac tribe of Maine had issued two
State-wide tribal advisories warning against mercury in their freshwater and marine
fish/seafood, including lobster.

                                                                                               6
QUESTION #4: What do fish advisories really mean? On what are they based?

ANSWER #4: Actual monitoring efforts for detecting contaminants is not only costly but
also highly limited by EPA and State ability to adequately measure and sample fish in local
waters. Clearly, it takes only one measurement of fish mercury above a certain pre-defined
level of acceptance (i.e., more commonly 0.5 ppm or 0.3 ppm) to trigger a fish consumption
advisory. (See Sections 3, 6, 7 for more details.) Fish advisories are issued with the good
intention of avoiding un-necessary risk of over exposures to toxic contaminants like MeHg in
fish. Most fish consumption advisories are careful to emphasize the benefits of fish
nutrition; but often confusion and fear rather than clarification results from highly negative
and emotional messages spread by the media campaigns of special interest organizations –
potentially leading to substantial drops in consumption of fish.

QUESTION #5: Does a fish (consumption) advisory mean real risk?

ANSWER #5: The amount of MeHg in fish consumed by most American is very low. The
State of Alaska views greater health dangers from a lack of sufficient intake of fish, rich in
high-quality protein, omega-3 polyunsaturated fatty acids, sulfur-containing amino acids,
vitamin E, selenium, lysine, iodine, copper, calcium, zinc, iron, manganese, etc. This is why
Alaska suggests no consumption restriction, while urging their high fish consuming
population, including “pregnant women, women who are breast feeding, women of
childbearing age, and young children”, to eat more fish caught from Alaskan waters (see
Section 6). Existing medical evidence under both clinical and epidemiological settings
suggest that the trace levels of MeHg in U.S. fish are not likely to suddenly overwhelm the
well-established health benefits gained from consuming a variety of fish from restaurants,
grocery stores and even most caught recreationally in local waters.

Also, trace levels of MeHg found in fish are likely no different from levels in fish long before
any possibility of industrial contamination (sic). It is very rare to find claims of MeHg
poisoning through regular (i.e., chronic) low dose fish consumption paralleling the two
tragic incidences of direct high dose MeHg poisonings from industrial waste dumping in
Minamata Bay and Niigata City, Japan during the 1950s and 1960s, respectively.

QUESTION #6: Does an advisory in one State mean the same thing as an advisory in another
State? Is there any uniformity?

ANSWER #6: There is no uniformity among States. The evidence shows that different States
not only use different fish mercury threshold (“safety”) levels for issuing their advisories but
often adopt different standards of proof for potential harm and definitions for assessing
exposure risk to MeHg in fish. There are also differing designations (age ranges) for defining
population subgroups, like children.

Further confusion stems from apparent conflict of interests and goals between federal fish
advisories for commercial fish and individual State advisories for local freshwater fish. For

                                                                                              7
example, Maine, Wisconsin, Minnesota and Washington have recently urged FDA and EPA
not to distribute federal fish advisories to doctors’ offices and public health clinics in their
States. (See Section 8.)
QUESTION #7: What are the sources of mercury in fish and what are the uncertainties?
ANSWER #7: The biologically active form of mercury found in fish tissue is called
methylmercury or MeHg. Chemically MeHg is written as CH3Hg+ with additional chemical
elements such as carbon and hydrogen. Elemental mercury (Hg) has to undergo a series of
biological, chemical and physical processes to be converted to methylmercury (MeHg), and
then accumulated in fish tissue. It is through the pathway of fish consumption that the case
is being made that human health is at possible risk; but actual health harm requires exposure
to an exceptionally, uncommonly large dose of MeHg. It is very important to clarify that
coal-fired power plants do not emit MeHg. Careful and extended analyses by EPA have been
unable to scientifically find that public health is directly at risk from Hg emissions from
power plants.
There is little doubt that levels of MeHg ultimately accumulating in fish tissue depends
primarily upon environmental and ecosystem factors such as amounts of sulfate, sunlight
and organic matter, pH level or temperature of water, amounts of bacteria or zooplankton.
MeHg levels in fish do not depend simply on the amount of elemental Hg available for
conversion. This is why a distinguished group of scientists 2 recently concluded that a simple
change in bacterial activity alone could “cause an increase in fish mercury concentrations
even as atmospheric deposition [from industrial mercury emission sources] decreases”.
[Emphasis added.] (See Section 9.)
QUESTION #8: What does RfD stand for?
ANSWER #8: Reference Dose. According to EPA’s definition, reference dose is defined as
“an estimate of a daily exposure to the human population (including sensitive
subpopulations) that is likely to be without a risk of adverse effects when experienced over
a lifetime.”
QUESTION #9: What is EPA’s fish mercury advisory threshold value?
ANSWER #9: The current value is 0.3 ppm (parts per million).
8SECTION 2 – FISH ADVISORY LISTINGS: INTRODUCTION AND OVERVIEW
This paper focuses on currently wide-spread and growing State fish consumption advisories.
State notices are attributed to health concerns about trace “contaminants” such as traces of
fish methylmercury (MeHg) in a wide range of aquatic systems including lakes, rivers,
watershed basins and coastal zones. They are in addition to the federal advisory 3 issued
jointly by the EPA and the U.S. Food and Drug Administration (FDA) in March 2004 to
minimize exposure for sensitive sub-groups, such as the offspring of women who are or
might become pregnant, nursing mothers and young children. The federal joint advisory
concerns primarily trace levels of MeHg in commercial ocean or farmed fish.
The 2003 National Listing of Fish Advisories 4 (NLFA) released by EPA 5 in August 2004 is the
12th annual listing since the first collection of locally issued fish advisories and safe eating
guidelines in 1993. EPA offered a few summary statistics, routinely misinterpreted in media
reports:
• The 2003 NLFA database lists 3,094 total advisories in 48 States, the District of
Columbia, and the U.S. Territory of Samoa (Figure 2-1). The water bodies under
advisory represent: (i) 35% (or about 14.2 million acres) of the nation’s total lake acres;
(ii) 24% (or about 846 thousand miles) of the nation’s river miles; (iii) 75% of the
nation’s contiguous coastal water (including 92% of the Atlantic coast, 100% of the
Gulf coast and 37% of the Pacific coast) and (iv) 100% of the Great lakes and their
connecting waters.
• The mercury-specific fish advisories for 2003 numbered at 2,362, an increase of some
160% since 1993 (Figure 2-2). Forty-five States now issue mercury advisories, a steady
increase from only 27 States in 1993.
• 21 States (Connecticut, Florida, Illinois, Indiana, Kentucky, Maine, Maryland,
Massachusetts, Michigan, Minnesota, Missouri, Montana, New Hampshire, New
Jersey, North Dakota, Ohio, Pennsylvania, Rhode Island, Vermont, Washington, and
Wisconsin) have issued State-wide advisories for mercury in at least one specie of fish
in all their inland freshwater lakes and rivers. Twelve States (Alabama, Florida,
Georgia, Hawaii, Louisiana, Maine, Massachusetts, Mississippi, North Carolina, Rhode
Island, South Carolina, and Texas) have issued State-wide advisories for fish mercury
in their coastal waters. The Micmac tribe of Maine has issued two State-wide tribal
advisories to warn against mercury in their freshwater and marine fish/seafood
(including lobster 6).
• State fish consumption advisories based on the five most measured contaminants
(mercury combined with PCBs, chlordane, dioxins, and DDT) accounted for 98% of all
advisories in effect in 2003. From 2001 to 2003, mercury-only advisories rose to
account for about 86-92% of all advisories. In other words, only about 8% of fish
advisories are non-mercury related. Since 1993, the lake acres and river miles covered
by all states fish consumption advisories for all contaminants have been steadily and
systematically increasing (Figure 2-3).
9Figure 2-1: Changes in total number of fish consumption advisories from 2002 (totaled 2831)
to 2003 (totaled 3094). (Adapted from EPA's August 24, 2004 Briefing Package at http://
www.epa.gov/waterscience/fish/advisories/index.html.)
Despite EPA caution against inappropriate extrapolation or inferences from NLFA statistical
data, there is clearly an ongoing pattern of public misstatements suggesting that the
increasing number of public fish advisories are evidence of progressively worsening mercury
“pollution” of U.S. fresh water and marine fish.
For example:
• U.S. Senator Jim Jeffords (I-VT): “This listing clearly indicates we are moving in the
wrong direction on mercury pollution.” (AP News, August 24, 2204.)
• “Fish warnings up due to mercury pollution-EPA.” (Reuter’s Planet Ark headline,
August 25, 2004.)
• August 24, 2004 press release by the Sierra Club’s Executive Director, Carl Pope 7 –
“Today the Environmental Protection Agency announced in its 2003 National Listing
of Fish and Wildlife Advisories 8 that 766,872 miles of America’s rivers and 13,068,990
lake acres are contaminated with so much poisonous mercury that the fish aren’t safe
to eat -- that is a more than 60 percent increase for river miles and an eight percent
increase for lake acres since the 2002 report.” [Emphasis added.] [See Figure 2-4 for an
explanation as to why this statement could be viewed as alarmist and promotional,
having ignored EPA’s clear explanation that the increase is particularly related to the
10issuance of recent State-wide advisories by Montana and Washington, switching
from their previous year’s site-specific advisories.]
• “In the U.S., the consequences [of “mercury pollution” from China] are being
detected not just in the air people breathe but in the food they eat. The U.S.
Environmental Protection Agency recently reported that a third of the country’s lakes
and nearly a quarter of its rivers are now so polluted with mercury that children and
pregnant women are advised to limit or avoid eating fish caught there.” (December
17, 2004, Wall Street Journal article 9.)
Figure 2-2: Mercury-specific advisories issued in 2003 versus those in 1993. (Adapted from
EPA's August 24, 2004 Briefing Package at http://www.epa.gov/waterscience/fish/advisories/
index.html.)
As indicated in the Q&A section of its fish advisory web site, 10 EPA anticipated some misuse
of NLFA data:
Q: “Why have the number of advisories and the geographic extent of advisories
steadily increased over the past 15 years?
A: EPA believes that the increase in advisories is primarily due to increased sampling
of previously untested waters by States and tribes and not necessarily due to
increased levels or frequency of contamination.” [Emphasis added.]
11In other words, EPA rejects the notion that its NLFA data points to increasing levels of trace
MeHg in fish caught in U.S. waters. Instead, the increase in total volume of aquatic systems
under advisories is primarily derived from the on-going socio-political decisions of the
individual States regarding the scope of their fish advisories (Figure 2-4) rather than any
actual increase in fish mercury content over time. These individual State decisions run the
gamut from State-wide coverage (Montana) to none at all (Alaska).
Figure 2-3: Number of river miles and lake acres under a fish advisory (for all contaminants
including mercury) from 1993 through 2003. Mercury-only advisories account for about 86-92%
of all advisories from 2001-2003. See discussion under Section 5 on how and why these two
“statistics” could not be attributed to any actual increase in mercury pollution and the
ultimate increase in the biologically more toxic form of mercury, methylmercury or MeHg, in
fish caught in U.S. waters. (Adapted from EPA's August 24, 2004 Briefing Package
at http://www.epa.gov/waterscience/fish/advisories/index.html)
Corollary to the notion of increasing levels of mercury in fish is the hypothesis directly linking
traces of the biologically active form of mercury (MeHg) in fish to Hg emissions from
industrial sources, especially coal-fired power plants. This claim is more fully examined in
Sections 8, 9, 10. Suffice it here to point out that proponents of harsh mercury regulatory
regimes to reduce Hg emissions to minimal levels or zero anticipate linear reductions of
MeHg in fish. Their declared primary aim is to improve fetal and early childhood health by
reducing maternal exposure to trace MeHg through fish consumption. The assumptions
underlying their actions are seriously questioned by science.
12Figure 2-4: Number of river miles under a fish advisory for all contaminants from 1993 through
2003. EPA clearly warned that the large increase (i.e., more than 60% increase in one year!) in
the number of river miles under mercury advisories from about 473 thousand miles in 2002 to
about 767 thousand miles in 2003 is related particularly to the issuance of State-wide
advisories by Montana and Washington 11 from their previous year’s site-specific advisories.
Unfortunately, EPA’s cautions have been largely ignored. (Adapted from EPA's August 24,
2004 Briefing Package at http://www.epa.gov/waterscience/fish/advisories/ index.html.)
A distinguished research team led by the University of Maryland’s R. Mason recently
concluded 12:
“It is not clear whether changes in mercury input will result in a linear change in
mercury methylation [i.e., creating MeHg]. Computer models, such as one developed
for the Florida Everglades, tend to predict a linear response, but there are little data to
support the predictions…. [D]ecision makers need more than mercury concentrations
to be able to ensure defensible interpretation of the indicators, such as MeHg in fish.
Other necessary information includes land use; food-web structure; the introduction
of exotic species; point-source discharges; changes in climate, atmospheric
chemistry, and acidic deposition; and hydrological regimes (e.g., retention time and
water level fluctuation). ... Other factors, such as sulfate and organic matter that
impact bacterial activity, could also possibly cause an increase in fish mercury
concentration even as atmospheric deposition decreases.” [Emphasis added.]
The science literature strongly suggests that methylmercury has most likely existed in fish
and fish consumers (human and wildlife) since both evolved on earth. This natural and
historical condition likely derives from Earth’s geology and marine ecodynamics.
Indisputably, mercury is ubiquitous in both land and aquatic environments. Earth’s oceans
13alone contain tens of millions of tons of mercury, with deep ocean vents likely the dominant
source of MeHg production ending up naturally and persistently over time in ocean fish. 13
(Section 9 offers a brief discussion of the largely misunderstood processes for the creation
and destruction of MeHg.)
It is also indisputable that fish is a nutritious, highly abundant resource for maintaining
overall health for many, especially those within subsistent cultures. Fish is known to be rich
in essential high-quality protein, omega-3 polyunsaturated fatty acids, sulfur-containing
amino acids, vitamin E, selenium, lysine, iodine, copper, calcium, zinc, iron, manganese and
more. Existing medical evidence from both clinical and epidemiological settings suggest that
the trace levels of MeHg in our fish are not likely to suddenly overwhelm well-established
nutritional benefits derived from consuming a variety of fish found in restaurants, grocery
stores and most local waters. To increase the existing large margin of safety for the most
sensitive groups − the offspring of pregnant and nu rsing women and young children less
than 6 years of age − one may choose to lower intake of certain species of fish, allowing for
a lowering of mercury in the body (which takes 50 to 200 days to reduce by half). For the
anxious, it is certainly reasonable to follow the March 2004 joint FDA/EPA fish advisory that
pregnant women and young children avoid “Shark, Swordfish, King Mackerel, or Tilefish.” 14
For these reasons, policy makers should be vigilant about alarmist misuse of NLFA and other
data which fosters the injurious and irresponsible public misperception that fish is not safe
for consumption. Contrary to an expanding body of published peer-reviewed literature, the
repetition of such claims in the media often only serves to frighten away fish consumers.
This potentially denies them a wide range of proven health benefits inherent in fish
nutrition. 15 Most fish advisories are not intended to inhibit consumption, but rather to
suggest varying levels of personal precaution based on MeHg levels in particular fish. This
report demonstrates that many of the current State advisories are scientifically problematic.
SECTION 3 – HOW ACCURATE ARE STATE FISH ADVISORIES? ARE THEY REALLY THAT USEFUL?
This section provides a basic overview on what constitutes fish advisories, and the
soundness of their scientific base. State advisories vary widely in accepted standards of
exposure. They also may be confusing and misleading to fish consumers (see Section 8).
FEDERAL ACTIONS
First, a historical note on the progressive development of FDA fish mercury guidelines,
according to the “Mercury Timeline” offered on the website of Senator Patrick Leahy (D-
VT) 16.
1969 – FDA sets an “administrative guideline” of 0.5 ppm for “mercury” in ocean fish.
1974 – FDA converts “administrative guideline” to what is termed an “action
level.”
141979 – FDA raises the “action level” from 0.5 ppm to 1 ppm which is said to be
equivalent to a limited consumption rate of 0.5 µg of “mercury” per kg of
body weight (b.w.) per day by the National Marine Fisheries Agency.
1984 – The 1 ppm action level was converted from a “mercury” standard to one
based on methylmercury (MeHg) – the biologically active form of mercury. 17
EPA’s documentation confirms FDA’s current action level of 1 ppm.18
Thus, FDA has the responsibility to make sure that commercial marine fish and seafood
contain MeHg levels no higher than 1 ppm. 19 FDA’s action level, according to some
commentators, is “the limit at or above which FDA will take legal action to remove a product
from the market.” 20 As proof that FDA has taken its responsibility seriously, there exist pre-
1979 reports of “large-scale confiscation of swordfish and the lesser-scale confiscation of
tuna, as a consequence of the establishment by the U.S. Food and Drug Administration of a
maximum permissible level of 0.5 parts per million (ppm) for mercury in fish.” 21
Details on how to estimate a fish tissue level from an assumed consumption limit of
methylmercury in fish is discussed in Section 7.
STATE ACTIONS
State consumption advisories for freshwater or recreational fishing in coastal waters may
have been issued at various fish mercury concentration levels. For example, in the December
10-11, 2002 Workshop on Advisories for Mercury in Gulf Marine Fish, 22 five Gulf State
representatives summarized their approaches to establishing an advisory as follows:
• Alabama: 1 ppm − consumption advisory issued
• Florida: >1.5 ppm− no consumption; 0.5 -1.5 ppm− 1meal/month for
sensitive subpopulation or 1 meal/week for general population; < 0.5 ppm
− no restrictions
• Louisiana: 0.5 ppm
• Mississippi: 1.0 ppm
− consumption advisory issued;1.5 ppm − no
consumption
• Texas: 0.7 ppm.
As a second example of diversity in advisory standards, the Minnesota Pollution Control
Agency (2004) recently reported that any river in Minnesota would be considered
“impaired” if a particular top predator species at certain standard size (i.e., 550 cm for
northern pike) recorded mercury levels exceeding the predefined threshold of 0.2 ppm. In
other words, a fish advisory will be issued for Minnesota rivers if a 550 cm-long northern
pike is tested with a tissue mercury reading above 0.2 ppm.
15SCIENCE BEHIND THE ADVISORIES
But are State issued advisories based on a sound understanding of the natural factors
affecting MeHg in fish? Figures 3-1 and 3-2 reveal some challenges for understanding the
meaning of mercury levels in fish and the environment upon which advisories are based.
Figure 3-1 shows five northern pike caught in Sargent Lake (Michigan) containing total Hg
(HgT) levels above 0.5 ppm (or 500 ng/g marked in the figure), triggering a consumption
advisory. In neighboring Lake Ritchie with fish tissue HgT levels below 0.3 ppm, no advisories
are listed, according to a recently published study (Gorski et al. 2003). 23
This appears to make sense at first. The lake containing fish exceeding the prescribed HgT
limit is under advisory. The lake below the set fish limit is not. But there are complications.
Researchers discovered that the actual measured levels of total mercury in the waters of
Lake Ritchie (non-advisory) are higher than those in Sargent Lake (advisory), suggesting a
more complicated picture of how mercury is accumulated in fish. This is why the authors of
this study concluded, “At this stage [of research understanding], we are unable to identify
lakes where mercury concentrations will exceed consumption advisories without direct
measurement of mercury concentrations in fish [which can be costly and labor intensive].”
In other words, States relying on mercury levels in water as a proxy for indicating levels in
fish from those waters may be deceived, resulting in the issuing of “false alarm” advisories.
It is often the case that concentrations of total mercury (HgT) and methylmercury (MeHg) in water samples
are not useful predictors of mercury concentration in fish. Contrast the mercury values in northern pike
from Lake Sargent (advisory lake) with those from Lake Richie (non-advisory lake). Despite the fact that
HgT in Sargent Lake pike (filled symbols) is significantly higher than Lake Richie pike (open symbols), both
the HgT and MeHg water measurements are slightly higher in Lake Ritchie, the non-advisory lake.
Five of these 5-6
year old pike
from Sargent
Lake are above
0.5 ppm
Gorski et al. (2003) Science of the Total Environment, vol. 304, 327-348
Figure 3-1: A comparison of mercury levels in northern pike caught in both an advisory lake
(Sargent Lake) and a non-advisory lake (Lake Ritchie). Sargent Lake is labeled an advisory lake
because five of its northern pike have mercury levels above Michigan’s fish advisory threshold
level of about 0.5 ppm (or 500 ng/g). Sargent and Ritchie are inland lakes of Isle Royale
National Park, Lake Superior, MI.
16Also, as evidence of layered-precaution, Michigan’s advisory for not consuming northern
pike from Sargent Lake (like all similar State advisories) makes the implicit assumption that
Sargent Lake fishermen will always be unfortunate enough to catch only those few northern
pike (see figure 3-1) with mercury levels above 0.5 ppm (instead of those pike measured with
very “safe” mercury levels at 0.1 ppm), and then eat them every day, for an entire life time
(the definition of an RfD for exposure). 24
Figure 3-2 shows that mercury levels in young and adult perch caught in Sargent Lake and
Lake Ritchie are both generally low. But more importantly, the perch mercury levels are
largely similar. Thus, if perch instead of northern pike were considered the fish of choice,
then no fish consumption advisories would be necessary for either Sargent Lake or Lake
Ritchie.
Another science-based challenge for State officials is related to the dependence of fish
mercury levels on fish growth rates. Recently, scientists from the University of Quebec
examined walleye pike in 12 lakes located in four different regions of Quebec in order to
determine this relationship. 25 They found that:
“When all walleye populations of the 12 lakes were considered together, growth
rates were significantly correlated to Hg concentration (r=0.9244; P< 0.001). This
suggests that faster-growing walleyes will have lower Hg concentrations than slow-
growing fish at a given length. The growth rate as a biological factor dominates all
other environmental factors to account for differences in Hg concentrations in
walleye populations studied. ... For … regular fisher[men] and their families, the fact
that a walleye of edible interest, say between 350 and 450 mm in total length,
contains between 0.1 and 1 ppm of Hg in its flesh is quite puzzling as the consumption
of certain specimens from certain lakes can pose a serious health risk. To identify
which fish from which lake can be safely consumed, governmental institutions have
commonly used normative approaches. In that case, mean Hg concentrations in
walleye of each of the 12 lakes can be calculated according to a given standardized
length of 350 mm, for example. Under these conditions, Fig. 5 [not re-shown in this
report] shows that standard Hg concentrations in walleye range from 0.13 ppm in
Lake Waconichi to 0.79 ppm in Lake Malartic. Combining these calculations to the
threshold of 0.5 ppm of Hg in fish flesh, classic fish consumption advisories would
recommend limiting fish consumption for 5 of the 12 lakes considered. Should Health
Canada lower the warning threshold of Hg in fish from 0.5 to 0.3 ppm or even less,
the situation of “safe” vs. “unsafe” lakes would change drastically. This whole
situation is then quite confusing for fish consumers. More accurate ways of deciding
whether one can safely eat fish (walleye) from different lakes should be sought. We
therefore propose to include fish growth rates when establishing walleye
consumption advisories.” [Emphasis added.]
In other words, the amount of Hg in fish depends not only on fish size (i.e., as shown in
Figures 3-1 and 3-2), but also on the rate of fish growth. Thus, fish in different lakes under
different growth environments can contain mercury levels either below or above the level of
17concern adopted by a State for its advisory. This situation is especially confusing and
potentially dangerous to public health if it steers people away from eating fish.
A third challenge for State regulators lays in the question of what is actually being measured
in the fish tissue – total mercury (HgT) or methylmercury (MeHg)? MeHg is a potent
neurotoxin known to affect human health at very high and uncommon dose levels. 26 Hg is
less so unless in extreme exposure situations. It is known that there are long lists of
independent biological, chemical and physical processes and factors governing the
conversion of Hg into MeHg. 27 Thus, it is crucial to know the specific form of mercury
regulators are targeting for measurement in order to judge the scientific validity of an
advisory.
“ At this stage, we ar e unable to identify lakes where mer cur y concentr ations will
exceed consumption advisor ies without dir ect measur ement of mer cur y
concentr ations in fish”
Factor s causing five of the nor ther n pike in Sar gent L ake to exceed the fish
consumption advisor y level of 0.5 ppm are not cer tain. The HgT in age-1 and
adult yellow per ch fr om both lakes are similar .
Age-1 perch Adult per ch (aged 2-4 year s)
Gor ski et al. (2003) Science of the Total Envir onment, vol. 304, 327-348
Figure 3-2: No significant difference in HgT between the Age-1 (one year old) perch and adult
perch for both the advisory lake (Sargent Lake) and the non-advisory lake (Lake Ritchie). All
perch caught from both lakes are below the Michigan’s fish advisory threshold level of about
0.5 ppm (or 500 ng/g).
In this context, it important to be aware of a potentially misleading assumption marketed in
EPA’s June 2001 fact sheet, reporting on the status of the 2000 National Listing of Fish and
Wildlife Advisories (NLFWA, the predecessor of the 2003 NLFA):
“Because of the higher cost of methylmercury analysis, EPA recommends that total
mercury rather than methylmercury concentrations be determined in state fish
contaminant monitoring programs. EPA also recommends that the assumption be made
that all mercury is present as methylmercury in order to be most protective of human
health.” [Emphasis added.]
18In other words, although actual MeHg may range between 70-98% of the HgT measured in
fish tissue, EPA and some State agencies argue for erring on the side of further caution –
assuming all 100% of the measured HgT in the fish tissue as MeHg. For example, a
measurement of 0.6 ppm of HgT consisting of only 0.4 ppm of MeHg would trigger issuance
of a false advisory where MeHg = 0.5 ppm were the threshold. This could result in needless
harm to public health by provoking restrained fish consumption based on technical
imprecision in the definition of “mercury.”
It has been estimated that 90% or more of the methylmercury concentrations in fish tissues
come from the fish’s dietary intake. 28 Yet it should also be noted that for food web
components lower in the food chain, like zooplankton, aquatic insects and mussels, the
relative percentage of HgT as MeHg ranges from only 15% to 80%. 29
Therefore, it is essential that EPA and State agencies justify to policy makers, health
professionals and consumers why all fish tissue mercury must erroneously be presumed to
be in the form of MeHg.
SECTION SUMMARY
There’s little wonder that State advisories can appear confusing, subjective and even
arbitrary.
It is clear that fish consumption advisories in the NLFA program are intended to serve and
protect public health, particularly specific subpopulations such as the offspring of pregnant
women and small children that may be more susceptible to large and persistent exposures
to MeHg. But the more relevant issues focus on questions of whether fish advisories really
accomplish this, or instead actually cause confusion, needless anxiety and threats to public
health from fish-constrained diets.
This concern is further illustrated by the co-sharing of waters and fish between the States of
Montana and Wyoming. A September 2001 USGS report 30 found that 5 samples of walleye
caught from the Bighorn Lake, geographically shared between Montana and Wyoming,
measured a mean HgT level of 0.68 ppm. The 0.68 ppm level is sufficient to trigger a
consumption advisory in the State of Montana, but not in Wyoming. The State of Wyoming
simply does not issue any advisories. What should Bighorn Lake fishermen think? Is a
walleye consumer in Wyoming any less “safe” than one in Montana?
19SECTION 4 – SOME OF THE ASSUMPTIONS UNDERLYING STATE FISH ADVISORIES ARE LIKELY
SCIENTIFICALLY WRONG
Once in place, State fish advisories might never be removed given the rationale for current
policy: regulatory prescriptions seeking the elimination of power plant Hg emissions
presume reductions will lead to a linear reduction of MeHg in ocean and freshwater fish, in
turn leading to a reduction in human exposure through fish consumption. Once the fish
have been returned (sic) to “safe” levels of mercury, then one presumes advisories would
be lifted. But the underlying hypothesis and model connecting Hg power plant emissions to
MeHg levels in fish tissue is scientifically unsupportable.
EPA and most State officials (Alaska seemingly a noted exception) appear to discount the
vast body of literature challenging such invalid model; opening the way for serious
unintended, negative economic, political and health outcomes.
This section presents a sample of available fish mercury data challenging the premise that
anthropogenic industrial emissions and deposition of Hg to air and water has led to
heightened levels of MeHg in fish over time. In rejecting the hypothesis, evidence strongly
suggests that (1) MeHg has likely always been present in fish, (2) current MeHg levels in fish
over time vary naturally, and (3) the natural production (and destruction) of MeHg is not
limited by the amount of Hg available in aquatic systems. Hence, claims directly connecting
fish mercury levels to minor 31 U.S. power plant Hg emissions confirm a serious
misunderstanding of both real-world observations and scientific evidence.
To begin, Figure 4-1 shows recent results by Kraepiel et al. (2003) 32 finding no increase in
MeHg levels for Yellowfin tuna caught in 1998 relative to a similar cohort caught in 1971. The
theoretical expectation (similar to EPA’s) was that methylmercury concentrations “should
have increased by 9 to 26%” over the interval “if methylation occurred in the mixed layer or
in the thermocline [of the Pacific oceans].” The theory was not proven. Further, Zhang et
al. (2002) 33 has estimated that China’s mercury emissions from coal combustion are
increasing at the rate of 5% per year (from available data from 1978 through 1995), which is
consistent with the theoretical expectation of increased amounts of methylmercury in the
waters of the Pacific Ocean if the Hg-to-MeHg conversion process is sensitive to industrial
emissions loading. On the contrary, Kraepiel et al. (2003) clearly concluded that “[s]uch an
increase is statistically inconsistent with the constant mercury concentrations measured in
tuna. We conclude tentatively that mercury methylation in the oceans occurs in deep waters
or in sediments.” 34 [Emphasis added] This is why the relatively small man-made sources of
mercury emissions can neither overwhelm nor directly alter the natural cycling of the very
large amount of mercury readily available in the environment and biosphere.
20Figure 4-1: No significant change in the measured levels of mercury in Pacific Yellowfin tuna
for similar weight-size samples caught in 1971 versus those caught in 1998.
Another study (Figure 4-2) found that although one can find clear increases of MeHg
concentration in western Atlantic blue hake as fish length increases, one can hardly see any
significant changes in the fish mercury-size relation between fish samples caught in 1880s
and samples caught in the 1970s. The authors of the paper concluded:
“This result supports the idea that the relatively high concentrations of mercury
found in marine fish that inhabit the surface and deep waters of the open ocean
result from natural processes, not 20th century industrial pollution.” 35 [Emphasis
added.]
This research clearly suggests that MeHg concentrations in ocean fish are not likely to be
changed or modified by small alterations of inorganic Hg sources (either anthropogenic or
natural). This is why popular claims or any indirect suggestions that EPA’s proposed Clean
Air Mercury Rule (CAMR) will lead to a measurable reduction in MeHg accumulated in ocean
and fresh water fish are factually misleading. 36
21No evidence of increasing trend or any change in
Hg of deep-sea fish (blue hake): 1970s versus 1880s fish
“ To test for a change in mercury content in the last century, two
samples of the deep-sea fish named blue hake (Antimora
rostrata) were analyzed. Antimora rostrata is resident
throughout the world’ s oceans at depths of 1000-3000 m but
does not venture into depths shallower than 800 m [actually
about 200 m in the cold waters of the polar region]; therefore,
Old Fish this deep-sea species is not exposed to local estuarine, coastal, or
atmospheric inputs of mercury. A sample of 21 specimens
collected in the 1880s was compared with a sample of 66
specimens collected in the 1970s in the western North Atlantic
Ocean. In both recent and old fish mercury increased as a
function of length, but comparison of the two concentration vs.
Newer Fish length relationships shows that there has not been an increase in
mercury concentration in deep-sea fish in the last century. This
result supports the idea that the relatively high concentration of
mercury found in marine fish that inhabit the surface and deep
waters of the open ocean result from natural processes, not 20th
century industrial pollution.”
Bar ber et al. (1984) Envir onmental Science & Technology, vol. 18, 552-555; Bar ber et al. (1972) Science, vol. 178, 636-639
Figure 4-2: The mercury-fish length relation for Atlantic blue hake caught in the 1970s and
1880s. No clear change in the mercury-fish length relation between the two eras suggests
that mercury levels in blue hake are largely unrelated to any trends in man-made mercury
emissions.
Figure 4-3 compares mercury levels in various samples of tuna, including those from canned
tuna more recently compiled by FDA and EPA. Dated fish samples from the Smithsonian
museum (1878-1909) indicate a relatively elevated mercury level associated with past
sources and exposure unrelated to modern power plant mercury emissions. These old
samples contain a mean level of about 0.38 ppm, significantly exceeding the mean levels of
0.29 ppm and 0.15 ppm for the 1971-1972 samples and the large FDA (1993) 220-canned tuna
samples, respectively. The authors of this important research concluded:
“The data for both tuna and swordfish [not discussed in this report] lend support to
the contention that the mercury levels now being found in wide-ranging ocean fish
are not primarily the consequence of man-made pollution but are of natural
origin.” 37 [Emphasis added.]
22Mercury levels in tuna:
Old (museum) versus New specimens
Hg levels in tuna (marine fish)
had been naturally high in the past!
1
0.9
Mercury 0.8
concentration
(ppm) 0.7
0.6 maximum
0.5 mean
0.4 minimum
0.38 ppm
mean level of0.3
Smithsonian 0.2 0.21 ppm
Museum EPA (1997)
1878-1909 0.1 mean level
samples 0 today
Old 'Modern' NMFS FDA
(1878-1909) (1971-72) (1978) (1993)
7 samples 5 samples 250 samples 220 canned samples
Data Sources: Miller et al. (1972), Science, vol. 175, 1121-1122; Carrington et al. (1997), Water, Air and Soil Pollution, vol. 97, 273-283
Figure 4-3: Comparison of mercury levels in old 1878-1909 tuna samples from the Smithsonian
Museum and modern 1971-72 samples. Additional values are tuna mercury measurements
performed by National Fisheries and Marine Services in 1978, FDA’s canned tuna samples as
well as the EPA’s canned tuna samples.
Figure 4-4 adds new evidence against the theory of an increasing trend in MeHg fish levels
by examining concentrations in the tissue of striped bass from the San Francisco Bay area
over the period 1970-2000. 38 The result shows that in any given year there is at least one
striped bass sample containing mercury values above EPA’s consumption advisory threshold
value of 0.5 ppm. Perhaps even more significant, those striped bass with mercury
concentration values above 0.5 ppm had no apparent connection to any power plant or
industrial Hg emissions.
Figure 4-4 reveals another important finding from the Greenfield et al. (2004) study. Even
though no accumulation trend was noted for mercury in striped bass in the 1970-2000
intervals, significant declines in the late 1990s were noted for other contaminants like DDT
and chlordane in San Francisco Bay fish tissues. The authors suggest that these declines may
be linked to known curtailed usage of the two chemicals in the 1970s and 1980s. Thus, the
combined findings suggest a more complicated and complex chain of methylation and
bioaccumulation of mercury in fish than supposed in EPA’s current modeling efforts. That is,
compared to other contaminants it appears that the pathway and behavior of mercury
transformation and accumulation in fish differs significantly from that of other
contaminants.
23No evidence of increasing trend in Hg concentration in striped bass
caught off San Francisco Bay area from 1970-2000
EPA’ s consumption advisor y threshold at 0.5 ppm
Note that at any given year
there is at least one striped
bass with Hg level at or above
the EPA’ s consumption
advisory threshold of 0.5 ppm
since 1970 with no apparent tie
to any US power plant Hg
emission sources. Also
although no increasing trend is
clear for Hg, declines were
noted in the fish tissue’ s DDT
and chlordane in the late 90s.
Those declines may be related
to the use curtailment of these
two chemicals in the 70s and
80s.
Gr ay bar s: annual median values (ppm) • : Hg values for individual fish
Greenfield et al. (2004) Science of the Total Environment, in press
Figure 4-4: Mercury levels for stripped bass caught in San Francisco Bay. The results clearly
shown that at any given time, available measurements of the stripped bass mercury levels had
exceed the EPA’s consumption levels set either at 0.5 ppm or even 0.3 ppm.
A similar tendency was recently reported 39 for levels of contaminants in fish from upper
River Thames in Britain by a group of zoologists from Oxford University and Cornell
University. These authors concluded that although the recent decrease in the contamination
level of PCBs may be partly associated with industrial and human activities, it was difficult to
find such associations for mercury.
Figure 4-5 presents recently published fish mercury data sets for various sport fish species
(yellow perch, walleye pike, smallmouth bass, northern pike, white sucker, and carp) caught
from 17 “areas of concern for mercury contamination” in the Canadian Great Lakes from
1971 to 1997. The results again evidence that historical changes in mercury concentrations
are not simply to be expected from local industrial Hg emissions. In fact, the author
concluded that 40
“Differences observed [among different areas of concern] did not consistently
parallel expectations associated with historical presence of chlor-alkali plants in the
vicinities of some locations.” [Emphasis added.]
24Equally important, the author also noted that “An attempt to correlate the fish tissue
mercury with the frequency of occurrence of infantile cerebral palsy at AOC [areas of
concern] was unsuccessful.” This fact illustrates the great difficulty in confirming various
popular claims regarding trace MeHg causing serious childhood neurological health
complications.
Hg concentr ation in spor t fish fr om Canadian Great L akes ar eas of concer n: No
link to occur r ence of infantile cer ebral palsy
“ The tissue mercury concentration in six species
length
of fish collected at the 17 Areas of Concern
Hg [AOC] ... were analyzed. A linear increase in Hg
yellow per ch walleye concentration with fish length was found, but
slopes differed among locations. The temporal
pattern over the period 1971-1997 differed across
species in fish collected in Lake St. Clair; in at
least two species there was evidence of increased
mercury concentration during the 1990s that had
been suggested in an earlier analysis. AOC
differed significantly in observed tissue
smallmouth bass
nor ther n pike concentrations. Differences observed did not
consistently parallel expectations associated with
historical presence of chlor-alkali plants in the
vicinities of some locations. An attempt to
length correlate the fish tissue mercury with the
Incr eased Hg trend
based on one poi nt
frequency of occurence of infantile cerebral palsy
i n 1994 at AOC was unsuccessful.”
Hg
white sucker car p
Weis (2004) Envir onmental Resear ch, vol. 95, 341-350
Figure 4-5: Mercury content in for 6 fish species from the so-called “area of concern” for
mercury contamination (and 10 other toxic substances) in the Canadian Great Lakes and their
trends since 1971.
SECTION 5 – WORKING HYPOTHESIS FOR EXPLAINING RECENT FISH ADVISORY TRENDS
This section expands previous comments on EPA’s 2003 NLFA advisories concerning the
apparent dramatic rise in total U.S. river miles and lake acres under fish advisories. From
1993-2003, the river miles advised increased from 74.5 thousand miles to 846.3 thousand, an
overall jump of almost 800% in just 10 years. A similarly remarkable statistical increase
occurred for the lake acres advised, from a low of 3.4 million acres to 14.2 million acres, a
sharp rise of more than 400% in the same decade (see Figures 2-3, 2-4).
25You can also read