Healthy Food Within Reach - Helping Bay Area residents find, afford and choose healthy food - SPUR

Page created by Salvador Graves
 
CONTINUE READING
Healthy Food Within Reach - Helping Bay Area residents find, afford and choose healthy food - SPUR
SPUR REPORT
                                          FEBRUARY 2015

Healthy Food
Within Reach
Helping Bay Area residents find, afford
and choose healthy food
Healthy Food Within Reach - Helping Bay Area residents find, afford and choose healthy food - SPUR
Contents
This report is a component of the SPUR
Regional Strategy, a vision for the future
of the San Francisco Bay Area
spur.org/regionalstrategy

SPUR Lead Sta and Task Force Co-Chair            4    Executive Summary
Eli Zigas
                                                 6    How Can Bay Area Cities Best Support Access to Healthy Food?
Research Assistant
Sean Becker                                      8    Why Food Access Matters

SPUR Food Access Task Force                      18   Recommendations
Heather Wooten (Co-Chair), ChangeLab
Solutions                                        34   Plan of Action for Local Governments
Lisa Craypo, Ad Lucem Consulting
Lisa Feldstein, UC Berkeley
Jennifer Gross, formerly with the San Mateo
                                                 36   APPENDIX 1
                                                      Self-Su ciency Standard and Poverty Measures and Levels
                                                                                                                            Healthy Food Within
                                                                                                                            Reach
County Health Department
Erin Healy, The Health Trust                     37   APPENDIX 2
Teri Olle, SF-Marin Food Bank                         Minimum Wage Earnings Compared to California Poverty
Rachel Poplack, The Health Trust                      Measure Thresholds
Shakirah Simley, Bi-Rite Family of Businesses
Deborah Quick, Morgan, Lewis & Bockius           38   APPENDIX 3
                                                      Methodology for Food Retail Environment Maps                          Helping Bay Area Residents Find, Afford
Mapping and GIS Analysis
Lauren Heumann, Darshini Shah                                                                                               and Choose Healthy Food
Resources and reviewers
Susana Algert, Carle Brinkman, Bonnie
Broderick, Arden Bucklin-Sporer, Carlo Carino,
Nicole Coxe, Brian Darrow, Jaime Flores,
Becky Gershon, Allison Hagey, Stefan Harvey,
Susana Hennessey-Lavery, Andy Hull, Doug
Johnson, Paula Jones, Sarah Nelson, Shu Wen
Ng, Leo O’Farrell, Bogdan Rau, Zetta Reicker,
Dottie Rosenbaum, Bhavdeep Sachdev, Hilary
Seligman, Darshini Shah, Diana Sokolove,
Laura Tam, Egon Terplan, Iris Tiong, Kris
Vantornhout, Tony Vi, Chris Wimer, Diane
Woloshin, Sabrina Wu

SPUR’s Food Systems and Urban Agriculture
Program is generously supported by the
Columbia Foundation, Clarence E. Heller
Charitable Foundation, TomKat Charitable
Trust, 11th Hour Project, New Belgium
Family Foundation, Seed Fund, John and
Marcia Goldman Foundation, Clif Bar Family
Foundation and Veritable Vegetable.

Edited by: Karen Steen                           SPUR
                                                                                                   c/o Impact Hub Oakland
Cover photo of E&F Market, Oakland,              654 Mission Street        76 South First Street   2323 Broadway
by Sergio Ruiz                                   San Francisco, CA 94105   San Jose, CA 95113      Oakland CA, 94612
                                                 tel. 415.781.8726         tel. 408.638.0083       tel. 510.250.8210
                                                 info@spur.org             infosj@spur.org         infooakland@spur.org     The SPUR Board of Directors reviewed, debated and adopted this report as o cial policy on September 17, 2014.
Healthy Food Within Reach - Helping Bay Area residents find, afford and choose healthy food - SPUR
Executive Summary

                                One in 10 adults in the Bay Area struggle to consistently
                                find three meals a day. More than half of all adults are
                                overweight or obese. And residents in many of the region’s
                                communities live in neighborhoods where fast food
                                restaurants and convenience stores abound, while grocery
                                stores are scarce or don’t exist at all. To meet our basic
                                needs, improve public health and enhance our quality of
                                life, Bay Area residents must have access to healthy food.
                                     There are four main barriers to food access            City and county agencies should not try
                                that prevent someone from having a healthy diet:      to address food access by themselves, nor do
                                                                                      they necessarily need to lead all the initiatives
                                  • Physical access: Can you find healthy food?       described in this report. While we have targeted our
                                                                                      recommendations to city and county governments,
                                  • Economic access: Can you afford healthy
                                                                                      all of our recommended actions should involve
                                    food?
                                                                                      other community stakeholders. Local merchant
                                  • Educational access: Do you know how to            associations, food banks, nonprofit educators,          Sergio Ruiz

                                    make healthy choices and how to cook?             food policy councils and other similar groups are
                                                                                      important partners — and in some cases may be           STRATEGY 3: Make healthy food available in all                         STRATEGY 5: Reduce demand for unhealthy food while
                                  • Cultural access: Do you want the healthy food
                                                                                      in the best position to lead an effort in partnership   neighborhoods                                                          increasing demand for healthier options
                                    that is available and affordable?
                                                                                      with local government agencies.
                                                                                                                                                     Recommendation 4: Tailor grocery store attraction and                Recommendation 9: Limit or prohibit the sale and
                                     City and county agencies have a variety                SPUR recommends 12 actions that local
                                                                                                                                                     corner-store conversion initiatives at the neighborhood              marketing of unhealthy food in environments frequented
                                of tools they can use to address these barriers.      governments can take to identify and address these
                                                                                                                                                     level.                                                               by children, especially at facilities that receive government
                                SPUR’s Food Access Task Force analyzed different      issues in Bay Area communities.
                                                                                                                                                                                                                          funding.
                                policy tools as they have been used both inside                                                                      Recommendation 5: Use zoning thoughtfully to shape food
                                and outside the Bay Area to help evaluate the         STRATEGY 1: Understand the local context                       retail options.                                                      Recommendation 10: Engage selectively in publicly funded
                                effectiveness of various strategies. We found that    when developing food access strategies                                                                                              marketing campaigns.
                                                                                                                                                     Recommendation 6: Link public financial assistance for
                                a one-size-fits-all approach rarely works. A retail
                                                                                           Recommendation 1: Conduct an assessment                   food retailers with requirements that they offer healthy             Recommendation 11: Tax sugar-sweetened beverages to
                                strategy for a dense urban neighborhood is unlikely
                                                                                           or use existing data to develop a targeted set            options.                                                             decrease consumption and generate revenue for initiatives
                                to work as well in a suburban neighborhood. A
                                                                                           of food access programs and initiatives.                                                                                       addressing diet-related disease and food access.
                                social service outreach program based on one                                                                         Recommendation 7: Support food pantries and emergency
                                language or culture may not translate well to a                                                                      food assistance for those who cannot afford, or are not able,
                                different community. To make progress on food         STRATEGY 2: Increase the purchasing                            to shop at food retailers.                                      STRATEGY 6: Support research that evaluates and
                                access, policymakers must examine the barriers at a   power of low-income residents to improve                                                                                       improves food access initiatives
                                neighborhood scale.                                   their economic access to healthy food
                                                                                                                                              STRATEGY 4: Ensure that people know how to cook and                         Recommendation 12: Partner with local academic
                                     We also found that some strategies should be
                                                                                           Recommendation 2: Maximize enrollment in               make healthy food choices                                               institutions to evaluate food access programs, and give
                                evaluated in more detail to determine their cost-
                                                                                           federally funded food assistance programs.                                                                                     preference to projects that include robust evaluation.
                                effectiveness and their long-term impacts on public                                                                  Recommendation 8: Support educational initiatives
                                health. This kind of research would be especially          Recommendation 3: Support long-term                       promoting food literacy and encourage their integration
                                helpful for evaluating food retail initiatives             funding for healthy food incentive programs.              into existing food access programs.                             See pages 34-35 for a plan of action identifying the parties
                                and would provide policymakers with critical                                                                                                                                         responsible for implementing these recommendations.
                                information for how to focus their efforts.

4   SPUR REPORT FEBRUARY 2015                                                                                   HEALTHY FOOD WITHIN REACH     EXECUTIVE SUMMARY                                                                                              SPUR REPORT FEBRUARY 2015 5
Healthy Food Within Reach - Helping Bay Area residents find, afford and choose healthy food - SPUR
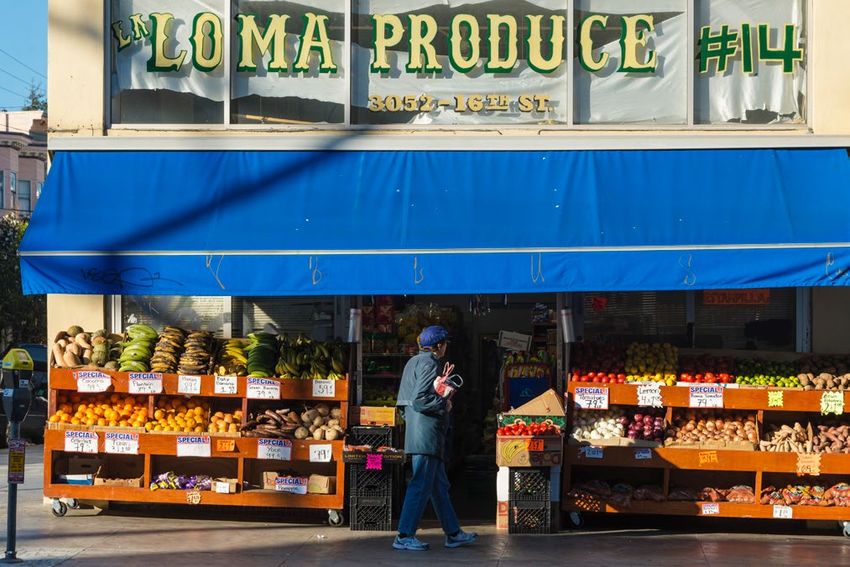
Defining Healthy and
  How Can Bay Area
                                                                                                                                                             FIGURE 1

                                                                                                                                                             The Four Barriers to Food Access
                                                                                                                                                             The barrier of physical access corresponds with the supply or availability   Unhealthy Food
  Cities Best Support Access
                                                                                                                                                             of healthy food. The barriers of economic, educational and cultural access
                                                                                                                                                             correspond with the demand for healthy food. Food access efforts need to
                                                                                                                                                             address all four.
                                                                                                                                                                                                                                          Throughout this report, we emphasize the importance of
                                                                                                                                                                                                                                          increasing access to “healthy food” and reducing consumption

  to Healthy Food?                                                                                                                                                                PHYSICAL
                                                                                                                                                                      Can you find healthy food?
                                                                                                                                                                                                                        SUPPLY
                                                                                                                                                                                                                                          of “unhealthy food.” All calories are not created equal. Our diet
                                                                                                                                                                                                                                          is closely tied to our health, and improving food access should
                                                                                                                                                                                                                                          improve not just the quantity of food in someone’s diet but the
                                                                                                                                                                                                                                          quality. Providing highly processed food with little nutritional
                                                                                                                                                                                                                                          value may address hunger, but it could also contribute to obesity
                                                                                                                                                                                                                                          and other diet-related health problems. Successful efforts to
                                                                                                                                                                                                                                          improve food access should reduce hunger and promote a
                                                                                                                                                                                 ECONOMIC                                                 healthy diet at the same time.
                                                                                                                                                                                                                                                In this report, “healthy food” refers to food items that
                                                                                                                                                                    Can you afford healthy food?
                                                                                                                                                                                                                                          support the federal government’s Dietary Guidelines for
                                                                                                                                                                                                                                          Americans, which state that “a healthy eating pattern limits
                                                                                                                                                                                                                                          intake of sodium, solid fats, added sugars, and refined grains and
                              The Bay Area is a global culinary capital known for       and findings, we offer policymakers a framework for
                                                                                                                                                                                                                                          emphasizes nutrient-dense foods and beverages — vegetables,
                              offering delicious food from around the region and        improving food access and recommendations for                                          EDUCATIONAL
                                                                                                                                                                                                                                          fruits, whole grains, fat-free or low-fat milk and milk products,
                              around the world. Our restaurants, grocery stores and     how to prioritize their efforts going forward.
                                                                                                                                                                 Do you know how to make healthy                       DEMAND             seafood, lean meats and poultry, eggs, beans and peas, and nuts
                              farms helped pioneer the celebration of fresh, local           Our research scope covers the geography where
                                                                                                                                                                     choices and how to cook?                                             and seeds.”4
                              and organic food — as well as the business models         SPUR focuses its work: the nine-county Bay Area,
                                                                                                                                                                                                                                                “Unhealthy food” refers to food that the Institute of
                              that make this thriving food culture possible. Yet many   with a specific interest in San Francisco, San Jose
                                                                                                                                                                                                                                          Medicine’s Committee on Accelerating Progress in Obesity
                              Bay Area residents, like many Americans nationwide,       and Oakland, the region’s three central cities.1 Many
                                                                                                                                                                                                                                          Prevention describes as “calorie-dense and low in naturally
                              face a reality far removed from this celebration          of the issues that exacerbate obstacles to accessing
                                                                                                                                                                                 CULTURAL                                                 occurring nutrients. Such foods and beverages contribute little
                              of cuisine. In communities throughout the region,         healthy food — poverty, for example — require strong
                                                                                                                                                                                                                                          fiber and few essential nutrients and phytochemicals but contain
                              families have trouble affording three meals a day,        state or federal policy responses. Throughout this                     Do you want the healthy food that is
                                                                                                                                                                                                                                          added fats, sweeteners, sodium, and other ingredients.”5
                              grapple with the effects of diet-related diseases such    report, we highlight the issues where that is the case.                     available and affordable?
                                                                                                                                                                                                                                                While many nutrition professionals are working to devise
                              as obesity and diabetes, and have to travel far to find   At the same time, city and county governments have
                                                                                                                                                                                                                                          a system to identify and label healthy and unhealthy foods,
                              quality grocery stores that offer fresh, healthy food.    a variety of policy tools they can use to improve food
                                                                                                                                                                                                                                          currently there is no widely accepted standard in place to
                                    In the past decade, these problems have             access. Those tools are the focus of this report.
                                                                                                                                                                                                                                          categorize individual food items as healthy or unhealthy. 6 Instead,
                              intensified, and local governments have begun
                                                                                                                                                             address all four of these barriers to promote a more wholesome               the definitions above provide categories of food that generally
                              responding with a variety of initiatives. City
                                                                                                                                                             diet for individuals and a self-sustaining healthy food economy for          support or detract from a person’s health when consumed
                              and county agencies have worked to attract
                              supermarkets to neighborhoods that haven’t had a
                                                                                        Defining Food Access: Four                                           communities. 3                                                               frequently.
                                                                                                                                                                   In the past decade, local government agencies and many
                              full-service grocer in years. They’ve partnered with      Barriers to Healthy Food                                             nonprofit organizations have focused heavily on addressing
                              corner stores to stock healthier options. They’ve
                              increased enrollment in food assistance programs,
                                                                                        Consumption                                                          physical access through initiatives such as attracting grocery
                                                                                                                                                             stores, improving corner store offerings, expanding food pantries
                              promoted urban agriculture and more. Each of these
                                                                                        We define food access as an individual or family’s                   and encouraging the start of new farmers’ markets. These
                              programs attempts to improve access to healthy
                                                                                        ability to obtain “sufficient, safe and nutritious food              initiatives can significantly improve the lives of residents, but by
                              food by approaching the problem from a different
                                                                                        to meet their dietary needs and food preferences                     their nature they are focused only on the supply side of a healthy
                              angle. Some have been more successful than others.
                                                                                        for an active and healthy life.”2 There are four main                food economy. For most initiatives to be economically self-
                              Despite these efforts, there is more work to be done                                                                                                                                                        4U.S. Department of Agriculture and U.S. Department of Health and Human
                                                                                        barriers to food access; see Figure 1. We need to                    sustaining, the other barriers outlined above — which underlie               Services, Dietary Guidelines for Americans, 2010 (Washington, DC: U.S.
                              to solve the problems of food insecurity, diet-related
                                                                                                                                                             demand for healthy food — must also be addressed. A new                      Government Printing Office, December 2010), ix.
                              disease and unhealthy food retail environments.
                                                                                                                                                             grocery store will fail without enough customers, corner stores              5 Institute of Medicine, Committee on Accelerating Progress in Obesity
                                    This report analyzes these various initiatives      1The nine counties are Alameda, Contra Costa, Marin, Napa,           will stop stocking healthy items that have anemic sales, and                 Prevention Food and Nutrition Board, Accelerating the Progress in Obesity
                              and provides policymakers with a recommended              San Francisco, San Mateo, Santa Clara, Solano and Sonoma.            farmers’ markets can’t succeed without shoppers who have the                 Prevention: Solving the Weight of the Nation (Washington, DC: The National
                              plan of action. SPUR’s Food Access Task Force                                                                                                                                                               Academies Press, 2012), 153.
                                                                                        2 This definition is based on the United Nations’ Food and           time, knowledge and desire to cook what’s on offer. Policymakers
                              reviewed existing programs in the Bay Area as             Agriculture Organization’s definition of “food insecurity,” a                                                                                     6 For a review of various nutrient profile standards under development, see:
                                                                                                                                                             interested in addressing food access must work to understand
                              well as in other parts of the country. Many of the        term that is in many ways similar to “food access.” In this report                                                                                Shirley Gerroir, “Nutrient Profiling Systems: Are Science and the Consumer
                                                                                                                                                             which barriers are present in their communities and to address
                              programs we studied involve commercial food               we use the framework and terminology of “food access” to                                                                                          Connected?” American Journal of Clinical Nutrition, vol. 91 (2010): 1116S-
                                                                                        describe all the barriers that people face in meeting their food     these obstacles simultaneously.                                              1117S. For a summary of issues regarding labeling specific foods as healthy
                              retailers such as grocery and corner stores, but
                                                                                        needs. We use the phrases “food security” and “food insecurity”                                                                                   or unhealthy in the context of the federal program, see: U.S. Department of
                              we also analyzed important noncommercial food                                                                                                                                                               Agriculture Food and Nutrition Service, Implications of Restricting the Use of
                                                                                        in the context of the economic barriers to obtaining food. See:
                              providers such as food pantries, home-delivered           Food and Agriculture Organization, “Declaration of the World         3 This framework is an adaptation of the work of Heather Wooten of           Food Stamp Benefits — Summary (March 1, 2007), http://www.fns.usda.gov/
                              meals and free dining rooms. Based on our research        Summit on Food Security” (November 2009).                            ChangeLab Solutions.                                                         sites/default/files/arra/FSPFoodRestrictions.pdf

6 SPUR REPORT FEBRUARY 2015                                                                                             HEALTHY FOOD WITHIN REACH            HOW CAN BAY AREA CITIES BEST SUPPORT ACCESS TO HEALTHY FOOD?                                                                  SPUR REPORT FEBRUARY 2015 7
Healthy Food Within Reach - Helping Bay Area residents find, afford and choose healthy food - SPUR
Why Food Access Matters
                                                                                                                                                    (14 percent) is only slightly lower than the national             FIGURE 2
                                                                                                                                                    average (16 percent). 8
                                                                                                                                                                                                                      Food Insecurity Varies Significantly by County Within the Bay Area
                                                                                                                                                          Food insecurity is most often caused by not
                                                                                                                                                                                                                      Adult food insecurity by county, 2011–2012
                                                                                                                                                     having enough money for basic expenses. When
                                                                                                                                                    cash is tight, individuals often choose to eat less or                                                                      20%

                                                                                                                                                                                                                                                                                                                                                                                                                                           SOLANO 18%
                                                                                                                                                    eat less healthfully in order to cover other expenses,
                                                                                                                                                    such as housing. Recognizing this phenomenon,                                                                               18%
                                                                                                                                                    analysts often use economic measures to estimate

                                                                                                                                                                                                                                                                                                                                                                                                                                                                                     CA 12%
                                                                                                                                                                                                                                  Percent of Adults Reporting Food Insecurity
                                                                                                                                                     poverty and food insecurity.                                                                                               16%
                                                                                                                                                          The most commonly used economic
                              Access to healthy food in the Bay Area is intimately
                                                                                      Addressing Hunger and

                                                                                                                                                                                                                                                                                                            CONTRA COSTA 13%
                                                                                                                                                    standard for estimating poverty — and identifying                                                                           14%
                              tied to three major problems facing the region:

                                                                                                                                                                                                                                                                                      ALAMEDA 12%

                                                                                                                                                                                                                                                                                                                                               NAPA 12%
                                                                                                                                                     individuals and families at risk of food insecurity
                                1. Hunger and food insecurity: Meeting
                                                                                      Food Insecurity Through                                       — is the federal poverty threshold. Created in                                                                              12%
                                                                                      Food Access

                                                                                                                                                                                                                                                                                                                                                                                                                                                        SONOMA 10%
                                   basic dietary needs to lead an active life                                                                        the 1960s and updated annually, this threshold
                                                                                                                                                                                                                                                                                10%

                                                                                                                                                                                                                                                                                                                                                                          SAN FRANCISCO 9%
                                                                                                                                                     is determined by estimating the costs of a basic
                                2. Public health: Improving diet to reduce the

                                                                                                                                                                                                                                                                                                                                  MARIN 8%

                                                                                                                                                                                                                                                                                                                                                                                                                     SANTA CLARA 8%
                                                                                      Even in a relatively wealthy region like the Bay Area,        diet and extrapolating a basic yearly budget for
                                   historically high levels of obesity and diabetes                                                                                                                                                                                             8%
                                                                                      many people experience food insecurity, a category            all household expenses from that figure. 9 Though

                                                                                                                                                                                                                                                                                                                                                                                             SAN MATEO 6%
                                3. Quality of life: Improving neighborhood            that includes both those who are chronically hungry           widely used, the federal poverty threshold relies
                                   food retail options                                and those who are uncertain, from one week to the             on national averages and does not reflect regional                                                                          6%
                                                                                      next, if they’ll be able to obtain enough food for an         differences in cost of living. As such, it does not
                              Below we present a series of baseline                                                                                                                                                                                                             4%
                                                                                      active and healthy life.                                      accurately measure food security in expensive
                              measurements that illustrate each of these
                                                                                           Ten percent of all adults in the Bay Area                 regions like the Bay Area.10
                              problems and can be used to evaluate future                                                                                                                                                                                                       2%
                                                                                      reported being food insecure in 2011–2012. While                    The California Poverty Measure, produced by
                              progress in addressing them.
                                                                                      the region’s rate is lower than the statewide                  the Public Policy Institute of California, provides a
                                                                                                                                                                                                                                                                                0%
                                                                                      average of 14 percent, food insecurity varies                  more accurate estimate of the income level at which
                                                                                                                                                                                                                      Source: UCLA Center for Health Policy Research, California Health Interview Survey, 2011–2012.
                                                                                      significantly by county. In some places, such as              an individual or family would be unable to meet
                              What Success Looks Like                                 Alameda and Contra Costa counties, the rate                    their basic needs. The poverty threshold reflects
                                                                                                                                                                                                                      FIGURE 3
                                                                                      approaches the statewide average, while Solano                changes in the cost of living by county and factors
                              What tangible metrics can we use to measure             County’s rate of food insecurity exceeds it (see               in government assistance in the form of cash                     Food Insecurity Increased Dramatically in the Bay Area
                              increased food access? In the long term, we would       Figure 2). 7                                                   benefits (such as child tax credits and the earned               in the Last Decade
                              feel confident that access to healthy food had               Between 2001 and 2012, the share of adults in             income tax credit) and in-kind benefits (such as                 Adult food insecurity in the Bay Area, 2001–2012
                              improved if the following changes occurred to a         the Bay Area who said they had trouble affording               food stamps). Approximately one in five Bay Area                 In the last decade, the percentage of adults in the region reporting food insecurity has jumped
                              significant degree throughout the Bay Area and          sufficient food increased by 72 percent, with the              residents were considered to be living in poverty in             from 6 percent (309,000 adults) to 10 percent (572,000 adults). The large increase between
                                                                                                                                                                                                                      2007 and 2009 corresponds to the start of the Great Recession. The number of food-insecure
                              across income levels:                                   most dramatic jump occurring at the start of the              2011 according to this measure, with poverty rates
                                                                                                                                                                                                                      adults in 2012 was greater than the populations of Oakland and Berkeley combined.
                                                                                      Great Recession. As of 2012, nearly one out of 10              ranging from 16 percent to 26 percent depending
                                 • A decrease in self-reported food insecurity
                                                                                      adults in the Bay Area — 572,000 total — reported             on the county (see Figure 4 on page 10).

                                                                                                                                                                                                                                                                                                                                                                                                                                       599,000 10.8%
                                                                                                                                                                                                                                                                                12%
                                 • A decline in both obesity and diabetes rates       being food insecure (see Figure 3). Looking at the

                                                                                                                                                                                                                                                                                                                                                                                                                                                                     572,000 10.3%
                                                                                      Bay Area within a national context, our region’s
                                 • An increase in fruit and vegetable                                                                               8 Feeding America, “Map the Meal Gap 2014,” http://
                                                                                      trend closely parallels that of the rest of the country.

                                                                                                                                                                                                                       Percent of Adults Reporting Food Insecurity
                                   consumption rates                                                                                                feedingamerica.org/hunger-in-america/hunger-studies/                                                                        10%

                                                                                                                                                                                                                         (Number of adults listed inside column)
                                                                                      When based on a cost-of-living analysis rather than           map-the-meal-gap/~/media/Files/research/map-meal-
                                 • An increase in the number of people reporting      a survey, the Bay Area’s rate of food insecurity              gap/2014-MMG-web-2014.ashx. The latter figure measured

                                                                                                                                                                                                                                                                                                                                394.000 7.6%
                                   access to fresh fruits and vegetables that they

                                                                                                                                                                                                                                                                                                                                                           382,000 7.2%
                                                                                                                                                    food insecurity by estimating income relative to the cost of                                                                8%
                                   can afford                                                                                                       living as well as estimating the food budget shortfall that

                                                                                                                                                                                                                                                                                                                                                                                                     350,000 6.5%
                                                                                                                                                    food-insecure individuals report they experience. Feeding
                                                                                      7 The California Health Interview Survey, the largest state

                                                                                                                                                                                                                                                                                               309,000 6%
                                 • A decrease in the proportion of residents                                                                        America’s methodology is available at: http://feedingamerica.
                                                                                      health survey in the nation, provides the most direct         org/hunger-in-america/hunger-studies/map-the-meal-gap/                                                                      6%
                                   living in poverty, according to the California     measurement of food insecurity. It asks five questions        how-we-got-map-data.aspx
                                   Poverty Measure thresholds                         related to skipping meals, reducing meal size, eating less
                                                                                                                                                    9 In 2013, the federal poverty threshold for a family of one
                                                                                      than one wants to or eating unbalanced meals because of
                                 • A decrease in the proportion of households         money. The survey likely provides a conservative estimate     parent and two children was $18,769; for a family of two                                                                    4%
                                   living below the Self-Sufficiency Standard for     of food insecurity because interviewers ask these questions   parents and two children, it was $23,624. See: U.S. Census
                                                                                                                                                    Bureau, “Poverty Thresholds for 2013 by Size of Family and
                                   California counties                                only of respondents who report making less than 200
                                                                                      percent of the Federal Poverty Level. See: UCLA Center for    Number of Related Children Under 18 Years,” http://www.
                              While it is beyond the scope of this report to          Health Policy Research, California Health Interview Survey,   census.gov/hhes/www/poverty/data/threshld/index.html.                                                                       2%
                                                                                                                                                    See also Appendix 1.
                              address the root causes of poverty, income levels       2011–2012, “Health Profiles: Greater Bay Area Counties,”
                              are important proxies for food security, and            March 2014, http://healthpolicy.ucla.edu/newsroom/press-      10 Sarah Bohn, Caroline Danielson, Matt Levin, Marybeth

                                                                                      releases/pages/details.aspx?NewsID=174; California Health     Mattingly and Christopher Wimer, The California Poverty                                                                     0%
                              sustainable, long-term success will mean increasing     Interview Survey, 2011–12, “Adult Questionnaire,” 156–157,    Measure: A New Look at the Social Safety Net (Public Policy                                                                         2001                                   2003                       2005                               2007                                     2009               20011–12
                              the number of people who can meet their dietary         http://healthpolicy.ucla.edu/chis/design/Documents/           Institute of California, October 2013), 2, http://www.ppic.org/
                                                                                                                                                                                                                       Sources: UCLA Center for Health Policy Research, California Health Interview Survey,
                              needs without public or private assistance.             CHIS2011adultquestionnaire.pdf                                content/pubs/report/R_1013SBR.pdf                                 “Adult Health Profiles”; SPUR analysis.

8 SPUR REPORT FEBRUARY 2015                                                                                        HEALTHY FOOD WITHIN REACH        WHY FOOD ACCESS MATTERS                                                                                                                                                                                                                                         SPUR REPORT FEBRUARY 2015 9
Healthy Food Within Reach - Helping Bay Area residents find, afford and choose healthy food - SPUR
California Poverty          Percent of All Residents Living             Self-Sufficiency           Percent of All Households
                                   Measure,                  Below California Poverty                    Standard,                     Living Below
                                                                                                                                                                          Improving Public Health                                             FIGURE 5

      County                                                                                                                                                                                                                               Adult Obesity Rates Vary Substantially From County to County
                               Family of Four                  Measure Thresholds                     Family of Four             Self-Sufficiency Standard                Through Food Access                                                  Rates of obese and overweight adults by county, 2011–2012
                                    201112                            201113                               201414                          201215
                                                                                                                                                                                                                                            Today, what we are eating is contributing significantly to historically high levels of obesity. The
                                                                                                                                                                          While numerous factors such as physical activity                  Bay Area’s adult obesity rates have been steadily increasing from 2001 to 2011, from 16 percent
      Alameda                        $31,701                                18%                            $72,830                             29%                        and genetics contribute to a person’s weight,                     to 20 percent, which is slightly lower than the statewide average of 25 percent.
                                                                                                                                                                          studies continue to show that what we eat has a
      Contra Costa                   $31,743                                19%                             $71,711                            26%                        strong influence on our weight and our likelihood
                                                                                                                                                                          of developing a diet-related disease such as                                                         Alameda                        21%                         55%
                                                                                                                                                                          diabetes.16 These health conditions don’t just
      Marin                          $35,785                                19%                            $87,263                             30%
                                                                                                                                                                          impact individuals’ lives; they also burden the                              Contra Costa                                             24%                              63%
                                                                                                                                                                          health system through increased hospitalizations
      Napa                           $31,335                                26%                             $74,110                            27%                        and treatment costs. A 2006 study estimated that
                                                                                                                                                                                                                                                                                     Marin              14%                         47%

                                                                                                                                                                          the overall cost to public and private insurers for
                                                                                                                                                                                                                                                                                     Napa                             29%                       61%
      San Francisco                  $36,349                                23%                            $79,092                             26%                        treating obese children was two to three times the
                                                                                                                                                                          average cost of treating all children.17                              San Francisco                                       11%                           42%                       Overweight or Obese
      San Mateo                     $36,504                                 18%                            $85,090                             29%                                                                                                                                                                                                          Obese
                                                                                                                                                                          Obesity                                                                                            San Mateo                    17%                           51%

      Santa Clara                    $34,377                                19%                            $81,774                             30%                        The Bay Area’s adult obesity rates steadily                                                        Santa Clara                   19%                            54%
                                                                                                                                                                          increased from 2001 to 2011, from 16 percent to
      Solano                         $30,166                                16%                            $66,580                             35%                        20 percent. This is a historically high level and                                                      Solano                                     36%                       69%
                                                                                                                                                                          only slightly lower than the statewide average of
                                                                                                                                                                          25 percent.18 Overweight and obesity rates also                                                       Sonoma                          22%                       55%
      Sonoma                         $30,898                                17%                            $70,434                             34%                        vary substantially from county to county (see
                                                                                                                                                                          Figure 5). Over a third of Solano County residents                                                  California                         25%                           60%
                                                                                                                                                                          are obese, compared to one in 10 people in San
                                                                                                                                                                                                                                                                                             0%   10%     20%    30%        40%     50%    60%     70%      80%     90%   100%
                                                                                                                                                                          Francisco.19
          Over the long term, it’s important to track                $930 per month. The thresholds for families of                      FIGURE 4                                                                                             Source: UCLA Center for Health Policy Research, California Health Interview Survey, 2011–2012.
                                                                                                                                                                               In the past decade, changes in obesity rates
     not only whether more people have become food                   four for all nine Bay Area counties are shown in
                                                                                                                                        Self-Sufficiency and              have not been distributed equitably across income
     secure but whether greater numbers of people                    Figure 4, and data for a family of three is available
                                                                                                                                        Poverty Thresholds                levels. The most recent data available shows that                   FIGURE 6
     have the income they need to be food secure                     in Appendix 1. In the Bay Area in 2012, between
                                                                                                                                        by County                         rates of obesity are twice as high among Bay
     independent of government or private assistance.                one-third and one-fourth of all households lived                                                                                                                       Obesity Is More Prevalent, and Growing Faster, Among Very
                                                                                                                                        The California Poverty
     The California Self-Sufficiency Standard measures               below the self-sufficiency thresholds, depending                   Measure estimates the
                                                                                                                                                                                                                                            Low-Income Residents
     the income necessary for a family to meet its                   on the county. Both the California Poverty Measure                 income level below which an                                                                         Adult obesity rates in the Bay Area by household income ranges
     basic needs without assistance.11 According to                  and Self-Sufficiency Standard, while not direct                    individual or a family would      16Institute of Medicine, Accelerating the Progress in Obesity      Rates of obesity are twice as high among Bay Area adults with annual household incomes
     the index, a family of four (including a preschool              measurements of food insecurity, provide useful                    be unable to meet their           Prevention: Solving the Weight of the Nation, 34–36 and 48–54.     below $15,000 (28 percent) than among those with annual incomes of $100,000 or more
                                                                                                                                        basic needs. It is adjusted for   17 Trust for America’s Health and the Robert Wood Johnson          (14 percent).
     child and a school-age child) in San Francisco                  economic benchmarks for tracking progress in
                                                                                                                                        changes in the cost of living     Foundation, F As in Fat: How Obesity Threatens America’s
     required an income of $79,092 in 2014 to be self-               addressing poverty, the underlying cause of food                   by county and factors in                                                                                                              30%
                                                                                                                                                                          Future (August 2013), 25, footnotes 41 and 42. For more
     sufficient, while a family of three (one preschool              insecurity.                                                        government assistance. The        detailed estimates of the costs of obesity, see: California
     child) required $68,670. In 2014 in most Bay Area                                                                                  California Self-Sufficiency       Center for Public Health Advocacy, The Economic Costs of
     counties, to meet the dietary goals of the basic food                                                                              Standard, meanwhile,              Overweight, Obesity, and Physical Inactivity Among California                                        25%
                                                                                                                                        measures what income an           Adults — 2006 (July 2009), http://www.publichealthadvocacy.
     plan laid out by the U.S. Department of Agriculture

                                                                                                                                                                                                                                           Percent of Adults Who Are Obese
                                                                                                                                        individual or family would        org/costofobesity.html
     (USDA), a family of three would need to spend                                                                                      need to meet their basic          18 CHIS results, calculated using AskCHIS, http://ask.chis.
     approximately $680 per month on food while a                                                                                       needs without assistance.                                                                                                             20%
                                                                                                                                                                          ucla.edu/main/default.asp. The CHIS survey follows CDC
     family of four would need to spend approximately                                                                                                                     guidelines, which define obesity based on a body mass index
                                                                                                                                                                          (BMI) calculation. Individuals with a BMI of 30 or greater
                                                                                                                                                                          are considered obese, and individuals with a BMI between                                             15%
     11Insight Center for Economic Development, The Self-            13   Ibid.                                                                                           25 and 30 are considered overweight. The formula for BMI
     Sufficiency Standard for California 2014, http://www.           14 A family of four is defined as two adults, one preschooler                                        (in metric measurements) is weight in kilograms divided by
                                                                                                                                                                                                                                                                                                                                                      Annual Household Income
     insightcced.org/communities/besa/besa-ca/ca-sss.html.           and one school-age child. See: Insight Center for Community                                          height in meters squared. See: Centers for Disease Control                                           10%
     For the full methodology, see: Diana Pearce, Methodology        Economic Development, “2014 Self-Sufficiency Standard for                                            and Prevention, “About BMI for Adults,” http://www.cdc.gov/                                                                                                                    $0 – $14,999
     Appendix: The Self-Sufficiency Standard for California 2014     California,” http://www.insightcced.org/uploads/cfes/2014/                                           healthyweight/assessing/bmi/adult_bmi.                                                                                                                                         $15,000 – $29,999
     (January 2014), http://www.insightcced.org/uploads/             CA2014-All-Families.xlsx. For thresholds for a family of three,                                      19 Overweight and obesity rates are somewhat lower for Bay                                                                                                                     $30,000 – $59,999
     cfes/2014/MethodologyAppendix-2014.pdf                                                                                                                                                                                                                                     5%
                                                                     see Appendix 1.                                                                                      Area children and teenagers than adults, but still constitute
     12A family of four is defined as two adults and two children.                                                                                                                                                                                                                                                                                       $60,000 – $99,999
                                                                     15Insight Center for Community Economic Development, “The                                            a serious public health issue. See: UCLA Center for Health
     See: “Data Set: California Poverty by County” (Public Policy    Self-Sufficiency Standard by Select Household Characteristics:                                       Policy Research and California Center for Public Health                                                                                                                        $100,000+
     Institute of California, 2013), http://www.ppic.org/main/                                                                                                                                                                                                                 0%
                                                                     California 2012,” http://www.insightcced.org/uploads/                                                Advocacy, A Patchwork of Progress (2011), 4, http://www.
     dataset.asp?p=1399. For thresholds for a family of three, see                                                                                                        publichealthadvocacy.org/research/patchworkdocs/OFT%20                                                        2001        2003              2005              2007         2009         20011–12
                                                                     cfes/2014/CA2012ACS-County-Tables.xls
     Appendix 1.                                                                                                                                                          brief_final.pdf                                                     Sources: California Health Interview Survey, 2011–2012; SPUR analysis.

10   SPUR REPORT FEBRUARY 2015                                                                                                         HEALTHY FOOD WITHIN REACH          WHY FOOD ACCESS MATTERS                                                                                                                                              SPUR REPORT FEBRUARY 2015 11
Healthy Food Within Reach - Helping Bay Area residents find, afford and choose healthy food - SPUR
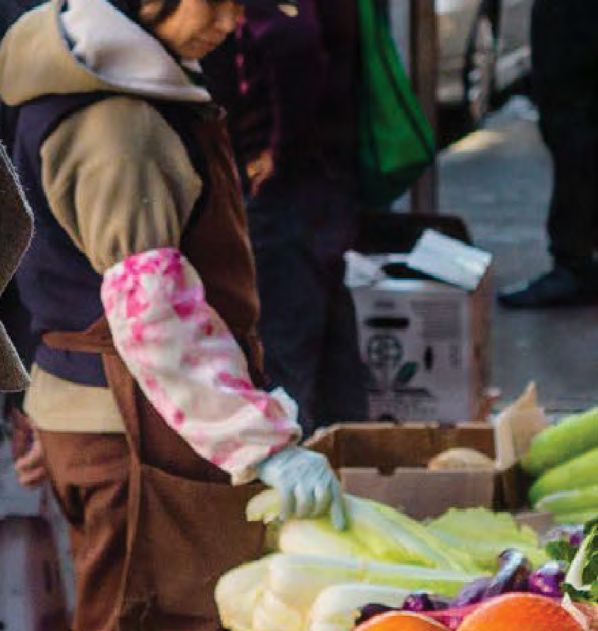
Area adults with annual household incomes below $15,000
   (28 percent) than among those with annual incomes of $100,000
                                                                                       Improving Quality of Life Through                                                   FIGURE 7

                                                                                                                                                                           Affording Fresh Produce Is a More Common Obstacle Than Finding It
   or more (14 percent). 20 As illustrated in Figure 6, the trends                     Food Access                                                                         Ten percent of Bay Area adults report difficulty finding fresh fruit and vegetables in their neighborhood, while more than 16 percent report difficulty affording it.
   of adult obesity rates in the past decade differ among income                                                                                                           The issues of availability and affordability are more acute for those with the lowest household incomes. Note: The question of affordability was only asked of those
   brackets. However, despite the important differences, all income                    Improving food access also improves quality of life by increasing                   who responded that they could find fresh produce in their neighborhood.
   groups in the Bay Area have seen their rates of obesity increase                    the convenience and availability of affordable, healthy and
   or, at best, stay steadily high in the past decade.                                 desirable food. Residents in some neighborhoods of the                                                                          Adults Reporting How Often They Can Find Fresh Fruits and Vegetables in Their Neighborhood,
                                                                                       Bay Area — especially low-income and rural ones — have to                                                                                                                                          Bay Area 2011–2012, by Income
   Diabetes                                                                            travel significantly farther than their counterparts in other                                                  100%
                                                                                       neighborhoods just to find a grocery store or market that offers
   Another public health issue strongly related to diet is Type
                                                                                       fresh fruit, vegetables and other healthy items. A longer trip is not                                          90%
   II diabetes. Though many factors contribute to the onset of
                                                                                       just an inconvenience and frustration for many residents, it’s also
   diabetes, our task force concluded that, because diet is a primary                                                                                                                                 80%
                                                                                       an equity issue because the transportation costs (in both money
   factor, it is important to measure progress on addressing food
                                                                                       and time) to get basic groceries pose a greater burden for lower-
   access by tracking the incidence of Type II diabetes. 21 Currently,                                                                                                                                70%
                                                                                       income residents. 26
   6 percent of Bay Area residents report having been diagnosed
                                                                                             One out of every 10 Bay Area adults report that they can find

                                                                                                                                                                             Percent of Respondents
   with Type II diabetes. 22                                                                                                                                                                          60%
                                                                                       fresh fruit and vegetables in their neighborhood only sometimes
                                                                                       or never. Of those who can access fresh produce in their
   Dietary Behavior                                                                                                                                                                                   50%
                                                                                       neighborhood, one out of every six adults report that they only
   Tracking obesity and diabetes — primary public health                               sometimes find it affordable, and 1 percent report that they never                                             40%
   concerns — is important in evaluating the outcome of food                           find it affordable. 27

                                                                                                                                                                                                                                                                                                                                                                                                                                       $100,000–$135,000
                                                                                                                                                                                                                                                                                                                                                                                                                    $90,000–$100,000
                                                                                                                                                                                                                                                                                                                       $40,000–$50,000
                                                                                                                                                                                                                                                                                                $30,000–$40,000

                                                                                                                                                                                                                                                                                                                                                                                               $80,000–$90,000
                                                                                                                                                                                                                                                                                                                                         $50,000–$60,000
                                                                                                                                                                                                                                                                              $20,000–$30,000

                                                                                                                                                                                                                                                                                                                                                           $60,000–$70,000

                                                                                                                                                                                                                                                                                                                                                                             $70,000–$80,000
                                                                                                                                                                                                                                                            $15,000–$20,000
   access efforts. Tracking dietary choices — a measurement of                               Among lower-income residents, the barriers to food access

                                                                                                                                                                                                                                          $10,000–$15,000
                                                                                                                                                                                                      30%

                                                                                                                                                                                                                         $5,000–$10,000
   individual behavior — is another way to evaluate the impact of                      are even more stark. Fifteen percent of households with an annual
   efforts to improve access to healthy foods. Public health officials                 income less than $20,000 report that they can only sometimes,                                                  20%

                                                                                                                                                                                                                                                                                                                                                                                                                                                           $135,000+
   commonly use fruit and vegetable consumption as a proxy                             or never, find fresh produce in their neighborhood, while nearly
Healthy Food Within Reach - Helping Bay Area residents find, afford and choose healthy food - SPUR
Starting at the turn of this century, many advocates       outlets classified as grocery stores or fast food               FIGURE 8
                               framed food access as an issue of bringing healthy         retailers. 30 But, even with these limitations, our
                                                                                                                                                          Neighborhoods With High Poverty and a Lack of Healthy Food Retail Options
                               food retail into places that had none — often              task force concluded that the Modified Retail Food
                                                                                                                                                          Focusing on San Francisco, San Jose and Oakland, SPUR used CDC data to highlight unhealthy food environments in neighborhoods where
                               called “food deserts.” Few places, however, are            Environment Index data could help policymakers                  more than 15 percent of families live in poverty. These areas are where we recommend that policymakers focus food access efforts.
                               completely lacking in food options. Rather, in             identify areas of their cities and counties with
                               many neighborhoods, there’s plenty of food being           unhealthy retail food environments. We looked at
                               sold — it’s just mostly unhealthy. Recognizing this        the data for the three central cities of the Bay Area:               San Francisco
                               distinction, advocates have begun labeling these           San Francisco, San Jose and Oakland. (See Figure
                               areas “food swamps” to draw attention to the need          8, pages 15-17.) To further refine the maps, SPUR
                               to change the relative prevalence of healthy and           highlighted unhealthy food retail environments
                               unhealthy options.                                         in census tracts where 15 percent or more of                                                      £
                                                                                                                                                                                            ¤
                                                                                                                                                                                            101

                                     The Centers for Disease Control and Prevention,      the households fall below the county-specific
                               responding to this more nuanced analysis of the            California Poverty Measure threshold. (For a more
                               physical food environment, created the Modified
                               Retail Food Environment Index, which calculates the
                                                                                          detailed explanation of the methodology that
                                                                                          generated these maps, see Appendix 3.) These are
                                                                                                                                                                                                                                                                                                           §
                                                                                                                                                                                                                                                                                                           ¦
                                                                                                                                                                                                                                                                                                           ¨80

                               ratio of healthy food retailers to total food retailers.   the neighborhoods and areas where we believe
                               It attempts to show “food swamps” on a map.                policymakers should focus their attention and
                                     Even with this level of analysis, the Modified       engage local residents, community institutions and
                               Retail Food Environment Index can only paint               retailers.
                               a partial picture. Measuring the quality of a
                                                                                                                                                                                                                                                 £
                                                                                                                                                                                                                                                 ¤101

                               neighborhood’s food retail options is difficult
                               because the data on retail outlets is imprecise.
                               The index doesn’t include farmers’ markets, nor
                               does it reveal the mix of products available in
                                                                                                                                                                                                  V
                                                                                                                                                                                                  U1

                                                                                                                                                                                                                                                                        §
                                                                                                                                                                                                                                                                        ¦
                                                                                                                                                                                                                                                                        ¨280

                                                                                                                                                                                            V
                                                                                                                                                                                            U1
                                                                                                                                                                                                                                                                 £
                                                                                                                                                                                                                                                                 ¤101

                                                                                                                                                                 0         0.5          1               2           3
                                                                                                                                                                                                                        Miles
                                                                                                                                                                                                            San Francisco County

                                                                                                                                                                     V
                                                                                                                                                                     U35
                                                                                                                                                                                                  §
                                                                                                                                                                                                  ¦
                                                                                                                                                                                                  ¨
                                                                                                                                                                                                  280                                       San Mateo County

                                                                                                                                                           Percent of Food Retail Options Classified as
                                                                                                                                                           Legend
                                                                                                                                                          “Healthy” in Census Tracts With High Poverty
                                                                                                                                                                                                                          The modified Retail Food Environment Index (mRFEI) measures the
                                                                                                                                                                                                                          number of healthy and less-healthy food retailers within a census
                                                                                                                                                                                                                                                                                                    Sources: Centers for Disease
                                                                                                                                                                                                                                                                                                    Control and Prevention,
                                                                                                                                                                                                                          tract using this formula:                                                 Census Tract Level State Maps
                                                                                                                                                           mRFEI    Index
                                                                                                                                                                0–1.5%                                                                                                                              of the Modified Retail Food
                                                                                                                                                                                                                                                                                                    Environment Index (2011);
                                                                                          30For the full description of the Centers for Disease Control                                                                                     # Healthy Food Retailers
                                                                                          and Prevention’s methodology in creating the Modified Food
                                                                                                                                                           (tracts  > 15% poverty)
                                                                                                                                                                1.5–5%
                                                                                                                                                                                                                            # Healthy Food Retailers + # Less Healthy Food Retailers
                                                                                                                                                                                                                                                                                          x 100
                                                                                                                                                                                                                                                                                                    SPUR analysis determined the
                                                                                                                                                                                                                                                                                                    census tracts with 15 percent
                                                                                                                                                                   5–37.5%                                                                                                                          of households below the
                                                                                          Retail Environment Index, see: Centers for Disease Control                     0-      1 .5                                                                                                               California Poverty Measure. See
                                                                                          and Prevention, Census Tract Level State Maps of the Modified      Tracts < 15% of families in poverty                          For this indicator, healthy food retailers include supermarkets, larger   Appendix 3 for details on this
                                                                                                                                                                                                                          grocery stores, supercenters, and produce stores. Less healthy food       methodology.
                                                                                          Retail Food Environment Index (2011), 1–2, ftp://ftp.cdc.gov/                 1 .5 - 5
                                                                                                                                                             Parks and open space                                         retailers include convenience stores, fast food restaurants, and small
                                                                                          pub/Publications/dnpao/census-tract-level-state-maps-                                                                           grocery stores with 3 or fewer employees.
                                                                                          mrfei_TAG508.pdf                                                                  5 - 10
                                                                                                                                                                            1 0 - 37.5
14 SPUR REPORT FEBRUARY 2015                                                                                            HEALTHY FOOD WITHIN REACH         WHY FOOD ACCESS MATTERS                                                                                                                   SPUR REPORT FEBRUARY 2015 15
                                                                                                                                                                      Tracts < 1 5% of families in poverty
Healthy Food Within Reach - Helping Bay Area residents find, afford and choose healthy food - SPUR
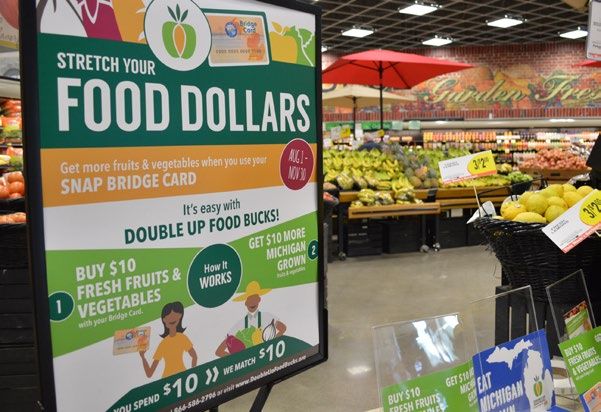
FIGURE 8 (CONTINUED)                                                                                                                                                            FIGURE 8 (CONTINUED)

   Neighborhoods With High Poverty and a Lack of Healthy Food Retail Options                                                                                                       Neighborhoods With High Poverty and a Lack of Healthy Food Retail Options
   Focusing on San Francisco, San Jose and Oakland, SPUR used CDC data to highlight unhealthy food environments in neighborhoods where                                             Focusing on San Francisco, San Jose and Oakland, SPUR used CDC data to highlight unhealthy food environments in neighborhoods where
   more than 15 percent of families live in poverty. These areas are where we recommend that policymakers focus food access efforts.                                               more than 15 percent of families live in poverty. These areas are where we recommend that policymakers focus food access efforts.

                                      Fremont
                                                                §
                                                                ¦
                                                                ¨
                                                                880                      unt
                                                                                             y                                                                                                                                                                                           V
                                                                                                                                                                                                                                                                                         U 24

         San Jose                                                         Ala
                                                                              m e da

                                                                                  C
                                                                                      Co

                                                                                    lara
                                                                                         Co
                                                                                            unt
                                                                                                y
                                                                                                                                                                                        Oakland                   Berkeley

                                                                              ta
                                                                                                                                                                                                                §
                                                                                                                                                                                                                ¦ U
                                                                                                                                                                                                                ¨

                                                                                                                                                                                                                                                                                                    Co
                                                                          San
                                                                                                                                                                                                                  V                                    V
                                                                                                                                                                                                                                                       U

                                                                                                                                                                                                                                                                                                      nt
                                                                                                                                                                                                                 580

                                                                                                                                                                                                                                                                                                       ra
                                                                                                                                                                                                                             123                        24

                                                                                                                                                                                                                                                                                                         Co
                                                                                                                                                                                                                                                                                                            st
                                                                                                                                                                                                                                                                                                              a
                                                                                                                                                                                                         Emeryville

                                                                                                                                                                                                                                                                                                              Co
                                                                                                                                                                                                                                                                                                                                                              Moraga

                                                                                                                                                                                                                                                                                                                  un
                                                                                                                                                                                                                                                                                                                     ty
                                                                                  Milpitas

                                                                                                                                                                                                                  §
                                                                                                                                                                                                                  ¦
                                                                                                                                                                                                                  ¨   80                                                             V
                                                                                                                                                                                                                                                                                     U13

                                       V
                                       U
                                       237
                                                                                                                                                                                                                                                                 Piedmont

                                                                                                    §
                                                                                                    ¦
                                                                                                    ¨                                                                                                                              §
                                                                                                                                                                                                                                   ¦
                                                                                                                                                                                                                                   ¨

                                                                                                                                                                                                                                                                                                                                              Al
                                                                             §
                                                                             ¦
                                                                             ¨
                                                                                                    680

                                                                                                                                                                                                                                                                                                                                               am
                                                                                                                                                                                                                                   980
                                                                              880

                                                                                                                                                                                                                                                                                                                                                 ed
                                                                                                                                                                                                                                                                                                                                                    a
                                        £
                                        ¤

                                                                                                                                                                                                                                                                                                                                                    Co
                  Sunnyvale             101

                                                                                                                                                                                                                                                                                                                                                        un
                                                                                                                                                                                                                                                                                                                                                        ty
                                       Santa Clara
                                                                o                                                   §
                                                                                                                    ¦
                                                                                                                    ¨680

                                                                                                                                                                                                                                                                                                    Oakland
                              V
                              U 82
                                                                                                          £
                                                                                                          ¤
                                                                                                          101
                                                                                                                                                                                                                                                                                                              §
                                                                                                                                                                                                                                                                                                              ¦
                                                                                                                                                                                                                                                                                                              ¨
                                                                                                                                                                                                                                                                                                              580

                                                                                                                                                                                                                                                                 §
                                                                                                                                                                                                                                                                 ¦
                                                                                                                                                                                                                                                                 ¨880

                                                                                                                               o                                                                                                               V
                                                                                                                                                                                                                                               U
                                                                                                                                                                                                                                               61

           Cupertino
                                                 §
                                                 ¦
                                                 ¨
                                                 280                                    V
                                                                                        U 87                        San Jose

                                                                                                                                                                                                                                     Alameda

                                                Campbell                                                                                                                                                                                                                                                                          V
                                                                                                                                                                                                                                                                                                                                  U
                                                                                                                                                                                                                                                                                                                                  185

             Saratoga
                                                     U
                                                     V 17

                                                     V
                                                     U
                                                     85                                                                                                                                                                                                                       o
                                                                                                                                                                                                                                                                                                                                  San Leandro

                                                            Los Gatos                                 0         1          2              4                  6                                                                                                               0     0.5          1                2                3
                                                                                                                                                                 Miles                                                                                                                                                                Miles

   Percent of Food Retail Options Classified as                                                                                                                                     Percent of Food Retail Options Classified as
    Legend
  “Healthy” in Census Tracts With High Poverty
                                                                      The modified Retail Food Environment Index (mRFEI) measures the
                                                                      number of healthy and less-healthy food retailers within a census
                                                                                                                                                 Sources: Centers for Disease
                                                                                                                                                 Control and Prevention,
                                                                                                                                                                                    Legend
                                                                                                                                                                                   “Healthy” in Census Tracts With High Poverty
                                                                                                                                                                                                                                                    The modified Retail Food Environment Index (mRFEI) measures the
                                                                                                                                                                                                                                                    number of healthy and less-healthy food retailers within a census
                                                                                                                                                                                                                                                                                                                                        Sources: Centers for Disease
                                                                                                                                                                                                                                                                                                                                        Control and Prevention,
                                                                      tract using this formula:                                                  Census Tract Level State Maps                                                                      tract using this formula:                                                           Census Tract Level State Maps
    mRFEI    Index
         0–1.5%                                                                                                                                  of the Modified Retail Food
                                                                                                                                                 Environment Index (2011);          mRFEI0–1.5%
                                                                                                                                                                                             Index
                                                                                                                                                                                                                                                                                                                                        of the Modified Retail Food
                                                                                                                                                                                                                                                                                                                                        Environment Index (2011);
                                                                                           # Healthy Food Retailers                                                                                                                                                     # Healthy Food Retailers
    (tracts  > 15% poverty)
         1.5–5%
                                                                        # Healthy Food Retailers + # Less Healthy Food Retailers
                                                                                                                                      x 100
                                                                                                                                                 SPUR analysis determined the
                                                                                                                                                 census tracts with 15 percent
                                                                                                                                                                                         1.5–5%
                                                                                                                                                                                    (tracts > 15% poverty)                                           # Healthy Food Retailers + # Less Healthy Food Retailers
                                                                                                                                                                                                                                                                                                                          x 100
                                                                                                                                                                                                                                                                                                                                        SPUR analysis determined the
                                                                                                                                                                                                                                                                                                                                        census tracts with 15 percent
            5–37.5%                                                                                                                              of households below the                    5–37.5%                                                                                                                                     of households below the
                   0 - 1 .5                                                                                                                      California Poverty Measure. See
                                                                                                                                                                                                   0 - 1 .5
                                                                                                                                                                                                                                                                                                                                        California Poverty Measure. See
       Tracts < 15% of families in poverty                            For this indicator, healthy food retailers include supermarkets, larger    Appendix 3 for details on this        Tracts < 15% of families in poverty                          For this indicator, healthy food retailers include supermarkets, larger             Appendix 3 for details on this
                                                                      grocery stores, supercenters, and produce stores. Less healthy food        methodology.                                                                                       grocery stores, supercenters, and produce stores. Less healthy food                 methodology.
                  1 .5 -space
       Parks and open    5                                            retailers include convenience stores, fast food restaurants, and small
                                                                                                                                                                                                  1 .5 -space
                                                                                                                                                                                       Parks and open    5                                          retailers include convenience stores, fast food restaurants, and small
                                                                      grocery stores with 3 or fewer employees.                                                                                                                                     grocery stores with 3 or fewer employees.
   o   Airports    5 -10                                                                                                                                                           o   Airports
                                                                                                                                                                                                   5 -10
                   1 0 - 37.5                                                                                                                                                                      1 0 - 37.5
16 SPUR REPORT FEBRUARY 2015                                                                                                                    HEALTHY FOOD WITHIN REACH          WHY FOOD ACCESS MATTERS                                                                                                                            SPUR REPORT FEBRUARY 2015 17
               Tracts < 1 5% of families in poverty                                                                                                                                            Tracts < 1 5% of families in poverty
Healthy Food Within Reach - Helping Bay Area residents find, afford and choose healthy food - SPUR
Recommendations
                                                                                                                                                                                                                                           STRATEGY 2
                                                                                                                                                                                                                                           Increase the purchasing
                                                                                                                                                                                                                                           power of low-income
                                                                                                                                                                                                                                           residents to improve their
                                                                                                                                                                                                                                           economic access to healthy
                                                                                                                                                                                                                                           food
                               City and county agencies can use a variety of            STRATEGY 1                                                                                                                                         While all four barriers to food access pose
                               strategies to address the four barriers to healthy                                                                                                                                                          obstacles to healthier eating, one of the biggest
                               food access. To evaluate the effectiveness of
                                                                                        Understand the local                                                                                                                               issues is economic access. In many cities, food
                               different strategies, SPUR’s Food Access Task Force      context when developing                                                                                                                            access efforts have focused on food retail and
                               analyzed policy tools that have been used both                                                                                                                                                              increasing the availability of healthy options. But
                               inside and outside the Bay Area. One overarching
                                                                                        food access strategies                                                                                                                             without consumer demand, healthy food retail isn’t
                               theme of our analysis is that a one-size-fits-all                                                                                                                                                           economically viable and retailers are less likely
                               approach rarely works. A retail strategy for a dense     Recommendation 1: Conduct an assessment                                                                                                            to move into new neighborhoods or change their
                               urban neighborhood is unlikely to work as well in a      or use existing data to develop a targeted                                                                                                         product mix. Increasing residents’ purchasing power
                               suburban neighborhood. A social service outreach         set of food access programs and initiatives.                Eli Zigas
                                                                                                                                                                                                                                           makes healthy food relatively more affordable and
                               program based on one language or culture may                                                                                                                                                                can increase demand for those products, which
                                                                                        Who: Public health departments
                               not translate well to a different community. To                                                                                                                                                             helps businesses see value in stocking a greater
                                                                                                                                                    At the Heart of the City       Food Security Task Force’s Assessment of Food
                               make progress on food access, policymakers must                                                                                                                                                             supply of healthier options.
                                                                                        Statistics in the earlier section of this report clearly    Farmers’ Market in San         Security in San Francisco is an excellent example
                               examine the barriers at a neighborhood scale.
                                                                                        show that food access varies dramatically within            Francisco, customers can       of the way a city agency can compile existing data
                                     We have developed six broad strategies, listed                                                                                                                                                        Recommendation 2: Maximize enrollment in
                                                                                        each city and county by income and by geography.            buy produce with their         into a strategy to address food security for the
                               below. Within each strategy, we provide specific                                                                                                                                                            federally funded food assistance programs.
                                                                                        Some neighborhoods and some communities are                 CalFresh benefits via an       city’s most vulnerable residents. 32 Another local
                               recommendations, along with an analysis of various
                                                                                        struggling with high levels of diet-related disease,        electronic benefits transfer   model that uses data to target future initiatives is    Who: Boards of supervisors, city councils, county
                               policy tools used to address food access.
                                                                                        food insecurity or poor retail food environments.           (EBT) card.                    the 2007 Neighborhood Food Preference Survey,           social service agencies, school districts, public health
                                     City and county agencies should not try to
                                                                                        Others are not. And even among places that face                                            conducted by San Francisco’s Southeast Food             departments
                               address food access by themselves, nor do they
                                                                                        challenges when it comes to food access, such                                              Access Working Group, in partnership with the
                               necessarily need to lead all the initiatives described
                                                                                        as West Oakland and San Francisco’s Tenderloin                                             local health department. 33 This survey, which          Local governments have a few tools at their disposal
                               here. While we have targeted our recommendations
                                                                                        neighborhood, important differences in each place                                          included questions about shopping habits, cultural      to help low-income residents obtain more money
                               to city and county governments, all of the actions
                                                                                        require city agencies to consider neighborhood-                                            preferences and dietary behavior, helped guide the      for food. From a local budget perspective, the
                               we propose should involve other community
                                                                                        level variables when developing their initiatives and                                      group’s work on food retail for numerous years and      most cost-effective are those that are funded
                               stakeholders. Local merchant associations, food
                                                                                        programs.                                                                                  helped ensure that the programs it supported were       primarily by the federal government. County social
                               banks, nonprofit educators, food policy councils
                                                                                             County public health departments are often                                            tailored to the neighborhood’s specific challenges.     service agencies, school districts and public health
                               and similar groups are important partners. The
                                                                                        in the best position to lead overall food access                                                 Categories of data that can be especially         departments, along with nonprofit social service
                               government may be the best leader in some
                                                                                        strategy. These departments have access to                                                 helpful in developing a food access initiative at the   organizations, should work to enroll the thousands
                               cases, but in others nongovernmental groups may
                                                                                        pre-existing data on neighborhood income and                                               neighborhood level include:                             of families who are eligible but not participating
                               be in the best position to spearhead an effort in
                                                                                        health. And they can work with local planning                                                                                                      in the food stamp program and should strive to
                               partnership with local government agencies.
                                                                                        departments, economic development agencies and                                                • Existing food retailers and the types and          increase student enrollment in free and reduced-
                                     Many of the strategies we studied are
                                                                                        community groups to combine that information with                                               quality of food available in those stores          cost school meals programs.
                               relatively new; therefore, metrics on their
                                                                                        local data on the food retail environment. When
                               effectiveness, especially in regard to their public                                                                                                    • Income data (including the percentage of
                                                                                        collecting information to develop a food access                                                                                                    CalFresh
                               health impacts, are not yet available. This created                                                                                                      residents participating in food assistance
                                                                                        strategy, it is important that agency staff review                                                                                                 The largest of the federal food assistance programs
                               a challenge in drafting detailed recommendations                                                                                                         programs)
                                                                                        all barriers to food access, not just the physical                                                                                                 is the Supplemental Nutrition Assistance Program,
                               for some strategies, and it is why we include
                                                                                        ones. The California Department of Public Health                                              • Food shopping behavior: Where do residents         known as CalFresh in California and formerly known
                               Recommendation 12, which encourages
                                                                                        has created a helpful model framework called the                                                currently shop for food and groceries?             as the Food Stamp Program. CalFresh provides
                               government agencies to partner with academics
                                                                                        Communities of Excellence in Nutrition, Physical
                               to rigorously evaluate food access programs. We                                                                                                        • Residents’ perspective on food access
                                                                                        Activity and Obesity Prevention, which has been
                               expect that future policy work, both by SPUR and                                                                                                         barriers: Why do residents say they don’t
                                                                                        used by numerous counties. 31 The San Francisco                                                                                                    32 San Francisco Food Security Task Force, Assessment of
                               other organizations, will provide more specific                                                                                                          purchase or consume healthier food?                Food Security in San Francisco (2013), https://www.sfdph.org/
                               recommendations based on these evaluations.                                                                                                                                                                 dph/files/mtgsGrps/FoodSecTaskFrc/docs/FSTF-Assessment
                                                                                                                                                                                                                                           OfFoodSecurityInSF-2013.pdf
                                                                                        31 California Department of Public Health, “Communities                                                                                            33 Southeast Food Access Working Group, Food Preferences

                                                                                        of Excellence in Nutrition, Physical Activity and Obesity                                                                                          in San Francisco’s Southeast Sector (2007), http://
                                                                                        Prevention,” http://www.cdph.ca.gov/programs/cpns/Pages/                                                                                           southeastfoodaccess.org/wp-content/uploads/2011/11/SEFA_
                                                                                        CX3_Main_Navgation.aspx                                                                                                                            Survey_Report_FINAL.pdf

18 SPUR REPORT FEBRUARY 2015                                                                                        HEALTHY FOOD WITHIN REACH       RECOMMENDATIONS                                                                                                       SPUR REPORT FEBRUARY 2015 19
eligible individuals and households with money to buy food via an
  electronic benefit transfer card that functions like a debit card. To
                                                                                    Agency, Alameda County Public Health Department, Alameda
                                                                                    County Community Food Bank and the Oakland Unified School
                                                                                                                                                                          The federal government, and to a smaller degree the state
                                                                                                                                                                    government, reimburses school districts a set amount of money
                                                                                                                                                                                                                                                        Improving Food
  qualify for CalFresh, residents must have a net income no higher
   than 100 percent of the federal poverty level, which amounts
                                                                                    District — is developing a single application that individuals and
                                                                                    families can use to apply for CalFresh, free or reduced school
                                                                                                                                                                    for each free and reduced meal they serve. The cost to local school
                                                                                                                                                                    districts to operate the school meals program varies by district.
                                                                                                                                                                                                                                                        Assistance for the Elderly,
   to $973 per month for an individual and $1,650 per month for a
   family of three in 2014–15. 34 Undocumented residents and those
                                                                                    meals, emergency food assistance and the Special Supplemental
                                                                                    Nutrition Program for Women, Infants and Children. The
                                                                                                                                                                    Generally, because of the federal and state reimbursements, the
                                                                                                                                                                    per-meal cost to local districts is very low. Recently, the USDA
                                                                                                                                                                                                                                                        Blind and Disabled
   receiving Supplemental Security Income are not eligible. The                     information is shared among the relevant agencies, with the aim                 updated its nutritional guidelines for reimbursable meals in an
  average CalFresh benefit per person in California in 2013 was                     of reducing the number of office visits residents must make to                  attempt to better align the nutritional content of school meals
                                                                                                                                                                                                                                                        California is the only state in the country that excludes
  $151.44 per month, or roughly $5 per day. 35                                      obtain food assistance. Similarly, San Francisco’s Human Services               with the agency’s general dietary guidelines.
                                                                                                                                                                                                                                                        Supplemental Security Income (SSI) recipients from the CalFresh
        In the nine-county Bay Area, nearly 441,000 people, or 6                    Agency has recently piloted a text-messaging reminder service,                        School meals give communities an opportunity to provide a
                                                                                                                                                                                                                                                        program. In California, around 1.3 million low-income people
   percent of all residents, received CalFresh benefits in 2013. 36                 called Promptly, to reduce the turnover of CalFresh applicants.                 nutritious meal at low or no cost to the student and relatively low
                                                                                                                                                                                                                                                        receive SSI either because they are over 65 or because they are
  Strikingly, only 56 percent of those who are estimated to be                      CalFresh participants receive a message on their phone                          cost to the school district’s general fund. However, unlike with
                                                                                                                                                                                                                                                        blind or disabled. 47 When the SSI program was established in
  eligible for the program are enrolled, which means that an                        reminding them to submit certain re-enrollment paperwork                        CalFresh, students have limited choices when it comes to the food
                                                                                                                                                                                                                                                        1974, states were given the option to “cash out” the food stamp
  additional 350,000 Bay Area residents could be receiving                          before they lose their benefits. This low-cost method of outreach               that is available, which makes enticing students to eat the meals
                                                                                                                                                                                                                                                        benefits to SSI recipients; under this option, states could give SSI
  assistance through the program. 37 If county social service                       has increased the response rates for these types of notifications               a key factor in how well these programs address food access and
                                                                                                                                                                                                                                                        recipients an additional cash allowance for food in lieu of food
  agencies were able to enroll all those nonparticipants and they                   and reduced the number of people who lose their benefits and                    how economically viable they are for the school district.
                                                                                                                                                                                                                                                        stamps. The cash-out was set at $10 per month, and in effect it
   received average levels of benefits, the federal government would                then have to re-enroll. 41 Both the single application and the text-                  School districts throughout the Bay Area have reformed, and
                                                                                                                                                                                                                                                        meant that $10 was added to an individual’s SSI income so that he
   provide low-income residents in the Bay Area with an additional                  messaging service are examples of how local agencies can reduce                 should continue to reform, their school meal programs to improve
                                                                                                                                                                                                                                                        or she wouldn’t have to apply for CalFresh. As the program has
  $53 million per month to spend at local food retailers.                           their overhead costs while also increasing the number of eligible               the quality of the food while increasing the number of students
                                                                                                                                                                                                                                                        evolved, the cash-out benefit has not increased along with the
        The CalFresh program is very cost-effective for local                       residents consistently receiving food assistance benefits.                      who choose to eat what is offered. As many school nutrition
                                                                                                                                                                                                                                                        changes in costs of living. 48
  governments. The federal government provides 100 percent of                                                                                                       directors will attest, that is easier said than done.
                                                                                                                                                                                                                                                             In the 1970s, California had generous welfare programs
   the benefits and, along with support from the state government,                  School Meals                                                                          Even so, there are promising models in the Bay Area.
                                                                                                                                                                                                                                                        in place, and it seemed that the cash-out option would give
  covers 85 percent of a county’s administrative costs. 38 In San                   School meals allow local school districts to provide nutritious                 Oakland Unified School District is using voter-approved bond
                                                                                                                                                                                                                                                        recipients more money than they’d receive if they applied for
   Francisco, for example, this means that the city’s General Fund                  food to students at low or no cost to them and their families.                  funding to build a new central kitchen that will allow it to
                                                                                                                                                                                                                                                        CalFresh. State leaders and advocates also thought that the
  only pays for $3.6 million of the city’s $121 million CalFresh budget             While school lunch is the largest component, a school’s meals                   incorporate fresher ingredients into its meals and lower overhead
                                                                                                                                                                                                                                                        cash-out would be more cost-effective to administrate, because
  — nearly $100 million of which is used by residents to purchase                   program can also include breakfast, snack and supper during                     costs. 43 In January 2012, San Francisco Unified School District
                                                                                                                                                                                                                                                        people on SSI wouldn’t have to apply for two separate programs.
   food. 39 Additionally, the USDA has estimated that as much as                    the school year, as well as lunch during the summer. Most school                changed its school meals contract, shifting away from frozen
                                                                                                                                                                                                                                                        Today, however, the minimum CalFresh benefit is $15 per month,
  $9 of economic activity is directly and indirectly generated from                 districts in the Bay Area charge less than $3 for a lunch. Even                 meals to fresher meals with higher-quality food produced by
                                                                                                                                                                                                                                                        which is 50 percent greater than the food benefit in the SSI
  every $5 of CalFresh benefit spent, which means that CalFresh                     so, the vast majority of students eating school meals have family               Revolution Foods. 44 Meal participation rates in the district
                                                                                                                                                                                                                                                        program. Preventing SSI recipients from participating in CalFresh
  also suports economic development. 40                                             incomes below 185 percent of the federal poverty line, which                    increased modestly after the change, though costs did as well. 45
                                                                                                                                                                                                                                                        is now limiting the amount of dollars SSI recipients can receive to
        Local social service agencies are improving CalFresh                        qualifies them for free or reduced price lunches. For these
                                                                                                                                                                                                                                                        supplement their food budget.
  enrollment levels by linking other social safety net programs with                students, a school meal provides critical food security and                     Special Supplemental Nutrition Program for Women, Infants
                                                                                                                                                                                                                                                             Currently, analysts and advocates are evaluating two
  CalFresh and by using technology to make it easier for residents                  allows their families to stretch their food budgets further. In the             and Children
                                                                                                                                                                                                                                                        possible options for addressing this issue. One is to eliminate
   to enroll and stay enrolled. Both are administrative changes                     nine Bay Area counties, an average of 42 percent of students                    The Special Supplemental Nutrition Program for Women, Infants
                                                                                                                                                                                                                                                        the cash-out option and allow SSI recipients to enroll in CalFresh.
   that increase efficiency for the agencies and the applicants. For                (375,000 total) receive lunch through their schools each day, with              and Children (commonly known by its acronym, WIC) provides
                                                                                                                                                                                                                                                        Another option is to keep the cash-out benefit that SSI recipients
  example, the Alameda County Nutrition Action Partners — a                         three out of four of those students receiving the meal for free or              money for food to pregnant women, new mothers, infants and
                                                                                                                                                                                                                                                        receive, increase it to match or exceed the minimum CalFresh
   partnership that includes the Alameda County Social Services                     at a reduced price. 42                                                          children under five in households with incomes at or below 185
                                                                                                                                                                                                                                                        benefits and adjust its value based on inflation going forward.
                                                                                                                                                                    percent of the federal poverty level. Participants can only use
                                                                                                                                                                                                                                                             Regardless of the specific mechanism, the state legislature
                                                                                                                                                                    the money, distributed in the form of checks, for specific types of
                                                                                                                                                                                                                                                        should change state regulations to ensure that low-income
                                                                                                                                                                    products, such as grains, bread, milk and produce that meet certain
   34 Starting in late 2014, CalFresh applicants with a gross income of 200         Advocates, February 2013). See also county-by-county data at http://cfpa.net/                                                                                       and disabled Californians can receive a level of food assistance
                                                                                                                                                                    nutritional guidelines. The average value of the food checks that
   percent of the federal poverty level can receive benefits as long as their net   county-profiles (accessed June 30, 2014).                                                                                                                           benefits that reflects the increased costs of food in the past four
   income — which is calculated by subtracting a variety of deductions and                                                                                          the 1.4 million program participants receive in California is $60 per
                                                                                    38 California Department of Social Services, “Program Overview,” Local                                                                                              decades and future price increases as well.
   certain expenses, such as child care and utilities from earnings — is below      Assistance 2013 November Estimate, http://www.cdss.ca.gov/cdssweb/entres/       month per participant.46 Unlike CalFresh and school meals, WIC is
   100 percent of the federal poverty level. See: California Department of Social   localassistanceest/jan14/Overviews.pdf                                          not an entitlement program but is instead funded by federal block
   Services, “Eligibility and Insurance Requirements,” accessed October 13, 2014,
                                                                                    39 San Francisco Food Security Task Force and Tenderloin Hunger Task Force,     grants distributed to the states. By providing money to low-income
   http://www.calfresh.ca.gov/PG841.htm. For net income thresholds, see:
   U.S. Department of Agriculture, Food and Nutrition Service, “Supplemental        Food Security in San Francisco — The Opportunity, presentation to the Board
   Nutrition Assistance Program (SNAP),” accessed on October 13, 2014, http://      of Supervisors (April 10, 2014), slide 11, http://www.sfdph.org/dph/files/
   www.fns.usda.gov/snap/eligibility                                                mtgsGrps/FoodSecTaskFrc/docs/FSTF-Hearing04102014.pdf
   35U.S. Department of Agriculture, Food and Nutrition Service,
                                                                                    40 USDA Economic Research Service, The Food Assistance National Input-          43Luke Tsai, “Measure J and the Future of OUSD’s School Lunch Program,”
  “Supplemental Nutrition Assistance Program: Average Monthly                       Output Multiplier (FANIOM) Model and Stimulus Effects of SNAP (2010), http://   East Bay Express, October 31, 2012.
   Benefit Per Person” (July 11, 2014), http://www.fns.usda.gov/pd/                 www.ers.usda.gov/publications/err-economic-research-report/err103.aspx#.        44 Mike Billings, “San Francisco Schools’ New Food Provider Off to Healthy
   supplemental-nutrition-assistance-program-snap                                   U3hPqlhdVrY                                                                     Start,” San Francisco Examiner, January 9, 2013.
   36California Department of Social Services, “CalFresh County Data Dashboard,
                                                                                    41The San Francisco CalFresh Office developed Promptly in conjunction with      45 SFUSD’s meal participation rate increased 5 percent for lunch and 10 percent
   FFY 2014, Oct–Dec 2013,” http://www.cdss.ca.gov/research/PG3575.htm              Code for America (http://codeforamerica.org/apps/promptly). Anecdotal           for breakfast between the 2011-12 and 2013-14 school years. Correspondence          47 California Department of Social Services, “Program Overview,” Local
                                                                                    evidence of the program’s impact is from correspondence with Leo O’Farrell,     with Zetta Reicker, Director of Student Nutrition Services, San Francisco Unified   Assistance 2013 November Estimate, 27–28.
   37Background, recommendations, and the estimate of eligible individuals          San Francisco CalFresh Program Director and Andy Hull, Postcode, August 2014.
   not participating in CalFresh by county is calculated by California Food                                                                                         School District, December 2014.                                                     48For background on the interaction between CalFresh and the state’s SSI
   Policy Advocates. See: Tia Shimada, Lost Dollars, Empty Plates: The Impact of
                                                                                    42California Department of Education, “2012–2013 School Nutrition Program       46California Department of Public Health, Special Supplemental Nutrition            program, see: Kerry Birnbach, “California’s Cashout Policy” (California Food
   CalFresh Participation on State and Local Economies (California Food Policy      County Profile Report,” http://www.cde.ca.gov/ds/sh/sn                          Program for Women, Infants and Children: May 2014 Estimate, 6 and 11.               Policy Advocates, March 5, 2013), http://cfpa.net/calfresh/calfresh-cashout-101

20 SPUR REPORT FEBRUARY 2015                                                                                                      HEALTHY FOOD WITHIN REACH         RECOMMENDATIONS                                                                                                                     SPUR REPORT FEBRUARY 2015 21
You can also read