ENERGY SAFETY NETS INDONESIA CASE STUDY - SEforALL
←
→
Page content transcription
If your browser does not render page correctly, please read the page content below
ENERGY SAFETY NETS INDONESIA CASE STUDY
ACKNOWLEDGEMENTS

The Energy Safety Nets: Indonesia Case Study              Marlistya Citraningrum, Melina Gabriella), J-PAL
was researched and written by partners at the De-         SEA (Poppy Widyasari), Kemenko PMK (Aghniya
partment of Economics, Faculty of Economics and           Halim, Juliyanto), Ministry of Social Affairs (Atin P),
Business Universitas Indonesia (https://www.feb.          Ministry of Social Affairs - Direktorat Jenderal Per-
ui.ac.id/en/department-of-economics/) in Depok.           lindungan dan Jaminan Sosial (Nurpujiyanto), Co-
The lead researcher was Teguh Dartanto (teguh.            ordinating Ministry for Human Development and
dartanto@ui.ac.id), with support from a team that         Cultural Affairs (Nur Budi Handayani), LPEM (C.
included Qisha Quarina, Rus’an Nasrudin, Fajar N.         Hanum Siregar), Indonesian Institute of Sciences -
Putra and Khaira Abdillah.                                P2E LIPI (Maxensius Tri Sambodo, Felix Wisnu Han-
                                                          doyo), Pertamina (Gunawan Wibisono, R Choernia-
We acknowledge with gratitude the financial               di Tomo, Witdoyo Warsito, Zibali), PGN (Houstina
support provided by the Wallace Global Fund.              Dewi A, Saphan Sopian), PWYP Indonesia (Andri
                                                          Prasetyo), The SMERU Research Institute (Asep
The research team acknowledges the contributions          Suryahadi, Widjajanti Isdijoso), TNP2K - National
to this work of the following workshop attendees          Team for the Acceleration of Poverty Reduction
and key interviewees: Bappenas - Ministry of Na-          (Ruddy Gobel), Universitas Indonesia – Department
tional Development Planning (Vivi Yulaswati), BKF         of Economics (Adi Permana, Ambarsari Dwi Cahya-
- Fiscal Policy Agency, Ministry of Finance (M. Y. Ni-    ni, Aslamia Anwar, Canyon Keanu, Faizal R. Moeis,
kho), BPPT - Agency for the Assessment and Appli-         Fandy Rahardi, Rinayanti, Rini Budiastuti), Universi-
cation of Technology (Agus Sugiyono), CERAH               tas Indonesia - Faculty of Economics and Business
(Adhityani Putri), Dewan Energi Nasional - National       (Dr. Djoni Hartono, Prof. Dr. Mohamad Ikhsan S.E,
Energy Council (A Sonny Keraf), IBEKA (Adhimas A.         M.A), USAID ICED II (Diah Karsiwulan), YLKI (Tulus
P., Petrus L. A., Tri Mumpuni), International Institute   Abadi), as well as user households interviewed from
for Sustainable Development (Lucky Lontoh), Insti-        among the LPG Subsidy Pilot Project Beneficiaries
tute for Essential Services Reform (Erina Mursanti,       in Rancagong village.

   This report is based on research jointly implemented by researchers at the Department of
   Economics, Faculty of Economics and Business at Universitas Indonesia, the Overseas Develop-
   ment Institute (ODI) and Catholic Agency for Overseas Development (CAFOD). The research in
   Indonesia is part of a broader program of energy safety nets research also carried out in Brazil,
   Ghana, India, Kenya and Mexico funded by Sustainable Energy for All (SEforALL) as part of its
   People-Centered Accelerator work program.

ENERGY SAFETY NETS | INDONESIA CASE STUDY                                                                           2
TABLE OF CONTENTS

ACKNOWLEDGEMENTS                                                                                 2
LIST OF FIGURES                                                                                  4
LIST OF TABLES                                                                                   5
ABBREVIATIONS                                                                                    5
MAP OF INDONESIA                                                                                 7
EXECUTIVE SUMMARY                                                                                8
INTRODUCTION                                                                                    10
   ENERGY ACCESS AND INCOME POVERTY                                                             11
   RECENT REFORMS TO AMEND A LONG HISTORY OF UNIVERSALLY SUBSIDIZING ENERGY
   CONSUMPTION                                                                                  12
   RESEARCH QUESTIONS AND SCOPE OF STUDY                                                        16
   STUDY METHODS                                                                                17
ENERGY SAFETY NETS AS PART OF ENERGY REFORMS AND SOCIAL PROTECTION
IN INDONESIA                                                                                    19
   EVOLUTION OF ENERGY SUBSIDY SYSTEM IN INDONESIA                                              20
		    Unified Database System (Basis Data Terpadu or BDT)                                       20
   ENERGY REFORM TOWARDS A TARGETED-SUBSIDY SYSTEM FOR ELECTRICITY                              22
   ENERGY REFORM TOWARDS A TARGETED-SUBSIDY SYSTEM FOR LPG                                      28
		    Subsidies for Cleaner Cooking: From Biomass and Kerosene to LPG                           28
		    Reform of the LPG Subsidy                                                                 30
   ENERGY SAFETY NETS AS PART OF INDONESIA'S SOCIAL WELFARE PROGRAM                             32
EVIDENCE OF THE IMPACT OF REFORMS ON ACCESS TO ENERGY: SECONDARY
DATA ANALYSIS                                                                                   34
ELECTRICITY ACCESS AMONG INDONESIAN HOUSEHOLDS                                                  35
   PRIMARY ENERGY FOR COOKING AMONG INDONESIAN HOUSEHOLDS                                       38
		    Substantial but uneven progress in providing access to LPG                                38
		    A lack of enabling infrastructure is hampering universal access to clean cooking fuels    40
		    Behavior remains a key constraint to universal adoption of cleaner cooking technologies   41
   ENERGY CONSUMPTION                                                                           44
LESSONS LEARNED AND FUTURE DIRECTION OF ENERGY SAFETY NETS IN INDONESIA:
EXPERT INPUTS                                                                                   45

ENERGY SAFETY NETS | INDONESIA CASE STUDY                                                            3
SUMMARY AND CONCLUSION                                                                         49
REFERENCES                                                                                     51
		Endnotes                                                                                     53
GLOSSARY                                                                                       56
COPYRIGHT AND DISCLAIMER                                                                       58

LIST OF FIGURES

Figure 1: Electrification Rate in Indonesia                                                    11
Figure 2: Electrification Rate by Province in 2017                                             12
Figure 3: Access to LPG (Bluegas 5.5 kg, LPG 3 kg and LPG 12 kg) by Province in 2017           13
Figure 4: Distribution of Poor People in Indonesia by Province                                 14
Figure 5: Budget Allocation for Energy Subsidies                                               16
Figure 6: Timeline History of Energy Reforms in Indonesia                                      18
Figure 7: Government Expenditure on Energy and Non-Energy Subsidies during Different
Administrations                                                                                21
Figure 8: BDT Data Collection Method 2015                                                      23
Figure 9: Simplified Economic Analysis of Supply Shortage of Electricity                       26
Figure 10: Budget Allocation for Electricity Subsidies                                         26
Figure 11: Number of Households in BDT Database by Electricity Connection (Millions)           27
Figure 12: The Number of Households with 450 VA and 900 VA Connection in 2016 (in Millions)    28
Figure 13: Social Welfare Programs in Indonesia                                                31
Figure 14: BDT Database Utilization for Social Assistance Programs                             32
Figure 15: Type of Electricity Used among Households in Indonesia, 2007                        36
Figure 16: Percentage of Households with Electricity as a Source of Lightning (including PLN
and Non-PLN)                                                                                   37
Figure 17: Correlation between Percentage of Q1 Households with an Electricity Connection
in a Province and its Remoteness (Number of Islands) with Electricity and Remoteness           38
Figure 18: Primary Energy Source for Cooking among Households in Indonesia, by Income
quintile in 2007 and 2017                                                                      39
Figure 19: Percentage of Households with Access to Modern Sources of Cooking Energy (including
LPG, piped gas, Electricity and Biogas) by Province and Income Group in 2007 and 2017          40
Figure 20: Relationship Between Households with Access to Electricity and to Modern Sources
of Cooking Energy, by Province and by Income Group                                             42
Figure 21: Intra-Province Share of Electricity Spending, by Quintile in 2007 and 2017          43

ENERGY SAFETY NETS | INDONESIA CASE STUDY                                                           4
LIST OF TABLES

Table 1: Summary of Social Assistance Programs and Energy Reforms                            15

Table 2: Comparison of Monthly Electricity Charges for Different Levels of Consumption and
Different Modes of Payment                                                                   24

Table 3: Electricity Tariffs in Indonesia as of 2017 (after reform)                          25

ABBREVIATIONS

ASLUT         Asistensi Sosial Usia Lanjut (Social Assistance for Older Persons)

BBPT          Badan Pengkajian Dan Penerapan Teknologi (Agency for the Assessment and
		            Application of Technology)

BDT		         Basis Data Terpadu (Unified Database System)

BLT		         Bantuan Langsung Tunai (Unconditional Cash Transfer)

BOS		         Bantuan Operasional Sekolah (School Operational Assistance)

BPNT		        Bantuan Pangan Non-Tunai (Non-Cash Food Assistance)

BPS		         Badan Pusat Statistik (Statistics Indonesia)

ESN		         Energy Safety Net

FGD		         Focus Group Discussion

FKP		         Forum Konsultasi Publik (Public Consultation Forum)

FPL		         Food Poverty Line

GK		          Garis Kemiskinan (Poverty Line)

JKN		         Jaminan Kesehatan Nasional (National Health Insurance)

LIPI		        Lembaga Ilmu Pengetahuan Indonesia (Indonesian Institute of Sciences)

LPG		         Liquefied Petroleum Gas

MEMR          Ministry of Energy and Mineral Resources

ENERGY SAFETY NETS | INDONESIA CASE STUDY                                                         5
NFPL		        Non-Food Poverty Line

PIP		         Program Indonesia Pintar (Educational Assistance Program)

PKH		         Program Keluarga Harapan (Conditional Cash Transfer Program)

PLN		         Perusahaan Listrik Negara (State Electricity Company)

PMT		         Proxy Means Test

Podes         Potensi Desa (Village Potential)

PPLS		        Pendataan Program Perlindungan Sosial (Social Protection Program Database)

PSE		         Pendataan Sosial Ekonomi (Socio Economic Data Collection)

SDG		         Sustainable Development Goal

Susenas       Survei Sosial Ekonomi National (National Socioeconomic Surveys)

TNP2K         Tim Nasional Percepatan Penanggulangan Kemiskinan (National Team for the
		            Acceleration of Poverty Reduction)

A note on currency

The conversion from the Indonesian rupiah (IDR) to the US dollar (USD) follows the yearly average
exchange rate value for each corresponding year that is obtained from Indonesia’s Central Bank.

ENERGY SAFETY NETS | INDONESIA CASE STUDY                                                           6
MAP OF INDONESIA

                                                                                                                         North
 Aceh                                                                                                                    Sulawesi
                                                                   North
                                                                   Kalimantan

                                     Riau Islands
                                                                                                 Gorontalo                    North
                                                                                                                              Maluku
North               Riau                                                        East
Sumatra                                               West                      Kalimantan
                                                      Kalimantan
                                          Bangka-                                                                                      West
                       Jambi              Belitung               Central              West                                             Papua
        West                              Istands                Kalimantan           Sulawesi       Central
        Sumatra                                                                                      Sulawesi
                               South
                               Sumatra
                                                                                                                                               Papua
                                                                                      South                  Southeast
                  Bengkulu                                                 South      Sulawesi               Sulawesi
                                          Jakarta                          Kalimantan
                                                                                                                          Maluku
                           Lampung                   Central
                                             West    Java
                                 Banten      Java                                  West Nusa
                                                                                   Tenggara
                                                Yogyakarta
                                                               East Java
                                                                           Bali
                                                                                                 East Nusa
                                                                                                 Tenggara

            ENERGY SAFETY NETS | INDONESIA CASE STUDY                                                                                            7
EXECUTIVE SUMMARY
This case study was conducted to investigate how ity of electricity has also improved for most house-
the Government of Indonesia supports access to holds, although some areas remain under- or un-
affordable, reliable, sustainable and modern ener- served and many households in geographically
gy for its poor and vulnerable citizens. Specifically, isolated areas in eastern regions lack access to
it identifies Energy Safety Nets (ESNs), the pro- electricity. Access to clean cooking technologies
grams available to poor and vulnerable households is less universal than access to electricity, although
that support access to electricity and LPG for cook- the cross-government kerosene-to-LPG program
ing, analyzes evidence on the impacts of these pro- that saw the free distribution of 54 million LPG kits
grams, and discusses the lessons learned from In- between 2007 and 2012 and the withdrawal of
donesia’s experiences. The results of the case study kerosene subsidies significantly boosted the rate
are informed by a detailed review of the literature, of access to clean cooking technologies to 62 per-
an analysis of the Susenas (National Socioeconom- cent in 2017. However, many poorer and remote
ic Survey) and Podes (Village Potential) datasets, areas of the country continue to lack the enabling
and expert interviews and focus group discussions infrastructure to adopt cleaner cooking solutions.
(FGDs) with representatives of policymakers, aca-
demics, NGOs and recipient communities. These Related to support for the consumption of mod-
qualitative analyses have improved understanding ern energy services, much work has been carried
of the context surrounding ESNs, including why out that documents Indonesia’s experience with
some policies were introduced, the challenges sur- reforming universal energy subsidies. The energy
rounding implementation, and who or what was re- reform process has been ongoing for many years
sponsible for driving the policy agenda. The case and delivery of subsidies that support consump-
study assesses the effectiveness of existing pro- tion of electricity and LPG for cooking continues
grams and policies and yields valuable inputs for to evolve. While improving energy access has fea-
conducting reforms that ensure poor and vulnera- tured prominently in the reform process, the key
ble groups have access to modern energy services. driver has always been reducing the fiscal pres-
Further, it details progress made in the provision of sure that subsidies exert and the most significant
the infrastructure needed to access modern ener- change brought about by these reforms has been
gy services (electricity connections and LPG cook- a shift from commodity-based subsidies to those
stoves) and focuses on the support necessary for targeted at specific households. Reforms have
their consumption. been particularly instrumental in the case of elec-
tricity tariffs and in the kerosene-to-LPG program.
The Government of Indonesia and Perusahaan This case study discusses the implications of these
Listrik Negara (PLN), the state-run electricity com- reforms in terms of their impact on access to en-
pany, have made substantial gains in providing ac- ergy for poor and vulnerable groups and the link-
cess to electricity over recent decades, with the ages between ESNs and other social assistance
goal of near-universal access by 2020. The reliabil- programs in Indonesia.
ENERGY SAFETY NETS | INDONESIA CASE STUDY 8Reforms both to electricity tariffs and in the ker- to provide other (non-energy) pro-poor social as-
osene-to-LPG program involve cross-governmen- sistance programs. Nonetheless, although rates of
tal cooperation and the sharing of resources. Key access to electricity increased for poorer Indone-
to their impact on energy access has been the sian households between 2007 and 2017, and de-
work of the National Team for the Acceleration spite the electricity tariff reform being enacted to
of Poverty Reduction (Tim Nasional Percepatan make the wealthier parts of society pay more for
Penanggulangan Kemiskinan, TNP2K). Led by the electricity than the poorer segments, consump-
Vice President, TNP2K was created in 2010 to pro- tion by wealthy households in the same period
mote coordination across government bodies to grew much faster than that of poor households.
improve the implementation of poverty reduction
programs and the living standards of the poor and More recently TNP2K began piloting active tar-
vulnerable, and reduce inequality among income geting of LPG subsidies in a similar way to that
groups. One result of this coordination has been carried out previously in the electricity sector (i.e.
to utilize the Unified Database System (Basis Data using the BDT database to determine the eligible
Terpadu (BDT)), launched in 2005. The BDT is ad- beneficiaries). In 2018 a pilot program involving
ministered by the Ministry of Social Welfare but 4,000 households was initiated across four prov-
draws on expertise from several different minis- inces. This entailed providing a fixed benefit level
tries. This micro-level electronic database is built for three 3 kg LPG cylinders per month to house-
from census data and contains social, economic holds that were invited to the trial and enrolled
and demographic information that is linked to the with support from village officials. This included
names and addresses of respondents. These data registering beneficiaries’ mobile phone numbers
are used to conduct a proxy means test that clas- and ensuring they had a bank account to which
sifies segments of the population that are eligible the subsidy could be transferred. A second pilot
for various social protection schemes, including program began in 2019 and adopted a more ad-
ESNs. vanced transaction system that involved multiple
ways for beneficiaries to prove their eligibility as
Attempts to more stringently target subsidies be- well as e-vouchers that could be redeemed at ap-
gan in 2013 and were first carried out in the elec- proved LPG merchants, rather than cash transfers.
tricity sector. These involved changes to the tar-
iffs paid by households. Proxy means tests were This study aims to shed light on the issue of access
initially used in an attempt to target only poor to affordable and modern energy for the poor and
and vulnerable households with low-power con- vulnerable people in Indonesia in the context of
nections and low usage. In 2017, reforms shifted ESNs. Key considerations for future ESNs include:
the target of the subsidy by matching the PLN's
customer database with the BDT. This enormous • The extent to which a one-size-fits-all policy can
undertaking involved electricity company workers contribute to truly universal access, especial-
visiting every household that was registered to ly with respect to remote and heterogeneous
receive a subsidy to validate whether they were populations
eligible beneficiaries. This process reduced the • The extent to which subsidies should rely on the
subsidy’s inclusion errors by excluding non-poor BDT given the frequency with which it is updated
households. No direct outcomes contributed to • The need for the subsidy process to be led by a
improving energy access for poor and vulnerable key political actor
households, but households may have indirectly • The need to recognize the willingness of house-
benefited from the reform because it freed up holds to change behavior as a key determinant of
government revenue that was subsequently used whether they will shift to cleaner cooking fuels.
ENERGY SAFETY NETS | INDONESIA CASE STUDY 9INTRODUCTION ENERGY SAFETY NETS | INDONESIA CASE STUDY 10
Energy is an essential element of people’s dai-          Indonesia, as the fourth most populous country in
ly lives and closely related to many develop-            the world, and the largest economy in Southeast
ment issues, such as productivity, health, gender        Asia, has been actively engaging with the Sustain-
equality and poverty alleviation. Accessibility          able Development Goals (SDGs) to eliminate pover-
to energy represents a major challenge as well           ty, promote gender equality, and increase access to
as opportunities for many, if not all, countries in      modern energy. Under a UN evaluation in 2018, In-
the world. The importance of access to energy            donesia’s overall achievement for SDG7 is still classi-
is addressed in Sustainable Development Goal 7           fied as ‘insufficient’; its lowest achievement is in CO2
(SDG7) which has three targets: universal access         emissions, followed by access to clean fuels and
to affordable, reliable, sustainable and modern          technology for cooking. The best achievement for
energy; increasing the share of renewable ener-          Indonesia by far is in terms of access to electricity.
gy in the global energy mix; and doubling the
global rate of improvement in energy efficiency.i        ENERGY ACCESS AND INCOME
The issue of affordable and clean energy remains         POVERTY
an important policy agenda around the world. As
of 2017, around 3 billion people still lacked ac-        2019 data from the Ministry of Energy and Mineral
cess to clean cooking and were exposed to high           Resources (MEMR) show that the household electri-
levels of air pollution, while slightly less than 1      fication rate in Indonesia had reached 98.3 percent
billion people were still without electricity (IEA       by 2018 and 98.81 percent by the beginning of 2019
et.al. 2019). Elsewhere, progress has been made          (Figure 1). The government’s aim is for the electrifi-
in terms of the use of renewable energy and the          cation rate to have reached 99.99 percent by the
declining ratio of energy used per unit of GDP,          end of 2019 (Ismoyo 2019).ii Although Indonesia has
which demonstrate opportunities in achieving             achieved a great deal in terms of electrification in
SDG7 by 2030 (Sachs et al. 2018).                        most parts of the country, it remains an issue in the
  FIGURE 1: ELECTRIFICATION RATE IN INDONESIA

Figure 1
Electrification Rate in Indonesia
100%                                                                                            98%         99%

                                                                                     95%
95%
                                                                         91%

90%                                                          88%

                                                   84%
85%

                                           80%
80%
                                  76%

75%
                  73%

70%
       67%

65%

60%

       2010        2011           2012     2013   2014      2015        2016       2017        2018        2019

Note: 2019 data is a projection
Source: MEMR 2019 (processed by authors)

ENERGY SAFETY NETS | INDONESIA CASE STUDY                                                                           11
east, which includes some of the poorest provinces ed for about 25.67 million people (nearly 10 percent
in the country, and thus the challenge for universal of the population), and as of 2016 almost 7 percent
access in electrification remains on the national agen- of the population were living on less than USD 1.90
da (ADB 2016). The electrification rate for provinc- per day, the international poverty line.
es in the eastern part of Indonesia is only about 54
percent, while it has reached more than 95 percent As of September 2018, the absolute number of poor
in other parts of the country (Figure 2). In addition, people (based on the national poverty line) in the
outside of Java, the nation’s wealthiest and most pop- Java Island provinces (such as Central Java, DKI Ja-
ulous island, rolling blackouts caused by insufficient karta and East Java) was higher than in other prov-
supply capacity continue to hamper universal elec- inces in Indonesia (Figure 4). However, the provinc-
tricity access and usage (Burke and Kurniawati 2018).iii es with the highest percentage of poor people are
in the eastern part of Indonesia, areas such as East
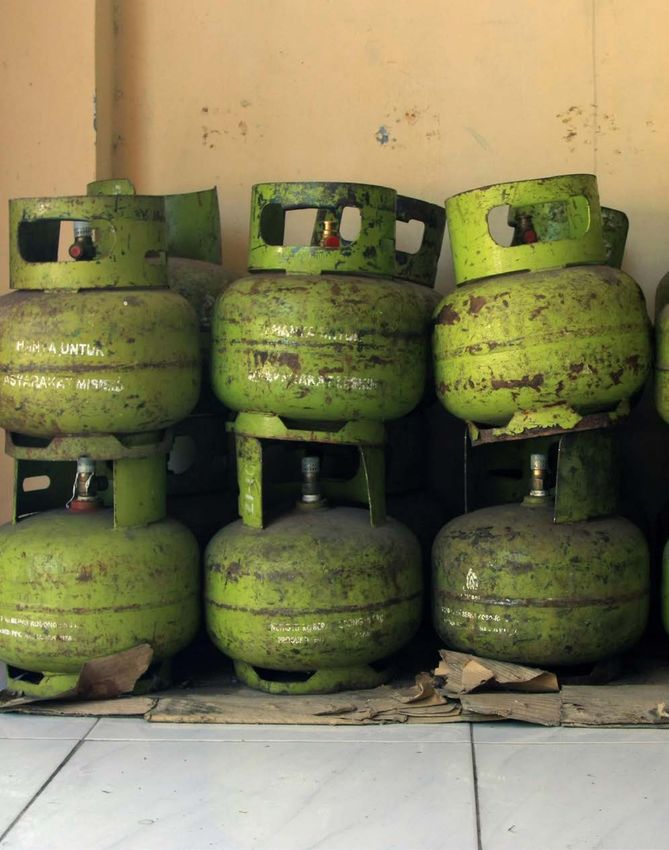
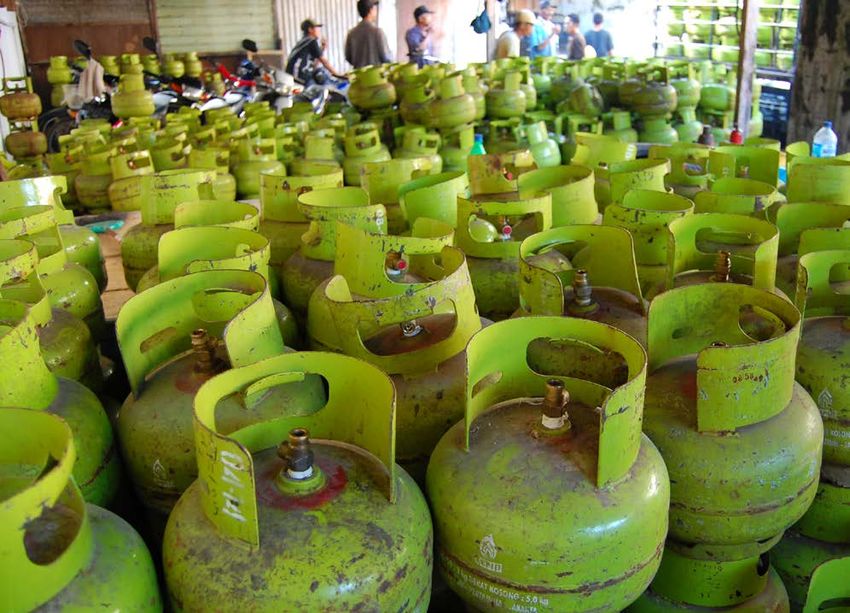
A similar picture is also seen in access to liquefied Nusa Tenggara, Maluku and West Papua. Of 25.67
petroleum gas (LPG), which is considered a modern million poor people, 10.13 million (39.5 percent) live
and clean form of cooking energy. Access to LPG in urban areas while 60.5 percent (15.54 million) live
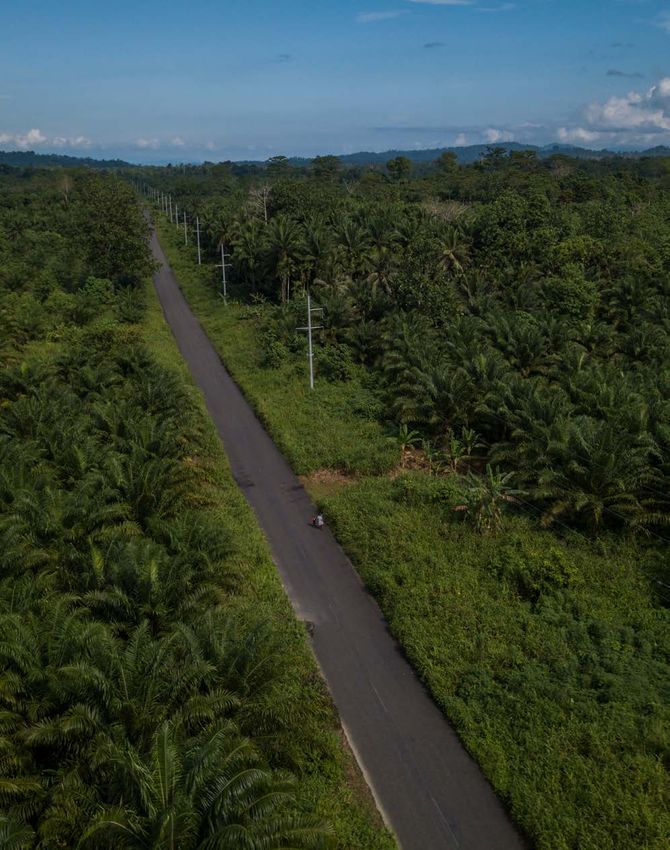
in the eastern provinces of Indonesia is extremely in rural areas. To provide universal access to afford-
limited compared to that in other provinces (Figure able and modern energy across Indonesia, poor
3). This issue is a key focus of this study and will be and other vulnerable groups within society must
discussed further in the following sections. have equal opportunities to access modern energy.
Despite the country being Southeast Asia’s largest RECENT REFORMS TO AMEND A
economy, many Indonesians still live in poverty or LONG HISTORY OF UNIVERSALLY
just above the poverty line. Data from Statistics In- SUBSIDIZING ENERGY CONSUMPTION
donesia (Badan Pusat Statistik (BPS)) show that as of
September 2018, the number of poor people, those Indonesia has a long history of providing universal
who live below the national poverty line,iv account- commodity-based subsidies for energy products.
Figure 2
Electrification Rate by Province in 2017
North
Aceh Sulawesi
North
Kalimantan
Riau Islands
Gorontalo North
Maluku
North Riau East
Sumatra West Kalimantan
Kalimantan
Bangka- West
Jambi Belitung Central West Papua
West Istands Kalimantan Sulawesi Central
Sumatra Sulawesi
South
Sumatra
Papua
South Southeast
Bengkulu South Sulawesi Sulawesi
Jakarta Kalimantan
Maluku
Lampung Central
West Java
Banten Java West Nusa
Tenggara
Yogyakarta
East Java
Bali
East Nusa
Tenggara
HOUSEHOLDS WITH ACCESS TO ELECTRICITY
100% – 99.4% 99.4% – 98.2% 98.2% – 95.5% 95.5% – 54.4%
Source: Susenas 2017 (processed by authors)
ENERGY SAFETY NETS | INDONESIA CASE STUDY 12Figure 3
Access to LPG (Bluegas 5.5 kg, LPG 3 kg and LPG 12 kg) by Province in 2017
North
Aceh Sulawesi
North
Kalimantan
Riau Islands
Gorontalo North
Maluku
North Riau East
Kalimantan
Sumatra West
Kalimantan
Bangka- West
Jambi Belitung Central West Papua
West Istands Kalimantan Sulawesi Central
Sumatra Sulawesi
South
Sumatra
Papua
South Southeast
Bengkulu South Sulawesi Sulawesi
Jakarta Kalimantan
Maluku
Lampung Central
West Java
Banten Java West Nusa
Tenggara
Yogyakarta
East Java
Bali
East Nusa
Tenggara
HOUSEHOLDS WITH ACCESS TO LPG
94.3% – 83.5% 83.5% – 75.7% 75.7% – 61.9% 61.9% – 0.4%
Source: Susenas 2017 (processed by authors)
These subsidies, however, have encouraged exces- Government spending on energy subsidies was
sive use of energy, hampered the implementation reduced from about USD 27.5 billionvi (about
of energy saving technologies, and limited the gov- IDR 342 trillion) in 2014 to about USD 8.6 billion
ernment’s budget allocation for other pro-poor so- (about IDR 120 trillion) in 2015, a decrease in the
cial assistance programs (Dartanto 2017). Moreover, fraction of the total government budget used
the benefits from such subsidies are mainly enjoyed for energy subsidies from 18 percent to 6 per-
by high-income groups who tend to consume more cent. On the one hand, these reforms increased
energy (meaning that the subsidies are an inefficient energy prices in Indonesia, driving up the price
mechanism of supporting poor households). This is of electricity and gasoline. Alone, these changes
the case for some fuels more than others. Dartan- would have negatively impacted poor and vul-
to (2013), for instance, shows that in 2008 nearly 72 nerable households. However, at the same time,
percent of gasoline subsidies were enjoyed by the these reforms have freed up some of the pub-
richest 30 percent, by income.v These issues posed lic budget to be allocated for social assistance
a major constraint for the country both to achieve programs, such as the Conditional Cash Transfer
universal energy access and ensure affordable, Program (Program Keluarga Harapan (PKH)) and
modern energy for the poor, since the subsidy re- Educational Assistance Program (Program Indo-
gime alone consumed most of the fiscal capacity nesia Pintar (PIP)), and for subsidized rice (Beras
needed to meet these two goals. Despite subsidies Sejahtera or Rastra), all of which better target the
reducing the price of energy, the poor continue to poor (see Table 1).
face difficulties in accessing energy due to slow ex-
pansion of the supply in remote areas. Enabled by Many studies and reports have conveyed the types
recent developments in the availability of benefi- and impacts of energy reforms in Indonesia, partic-
ciaries’ data, major adverse macroeconomic shocks ularly in relation to health, welfare, and poverty re-
triggered the government to introduce a series of duction (see for example Ikhsan et al. 2005; Dartan-
reforms to energy subsidies for electricity, LPG and to 2013; Dartanto 2017; World Bank 2012; Perdana
other fossil fuels. 2014; and OECD 2019).
ENERGY SAFETY NETS | INDONESIA CASE STUDY 13Figure 4
FIGURE 1.4: DISTRIBUTION OF POOR POPULATION IN INDONESIA BY PROVINCE
Distribution of Poor People in Indonesia by Province
NUMBER OF POOR PERCENTAGE OF POOR
% POPULATION OF EACH PROVINCE
0% 5% 10% 15% 20% 25% 30%
PAPUA 926.36 27.53%
WEST IRIAN JAYA 211.5
22.17%
6.77%
MALUKU UTARA 84.6
MALUKU 317.69 17.69%
11.02%
SULAWESI BARAT 151.4
GORONTALO 186.03 15.52%
SULAWESI TENGGARA 302.58
11.24%
8.69%
SOUTH SULAWESI 767.8
SULAWESI TENGAH 410.36 13.48%
7.66%
NORTH SULAWESI 191.7
KALIMANTAN UTARA 48.78 6.63%
EAST KALIMANTAN 219.92 5.94%
KALIMANTAN SELATAN 192.48 4.55%
CENTRAL KALIMANTAN 134.59 4.98%
KALIMANTAN BARAT 378.41 7.49%
EAST NUSA TENGGARA 1,146.32
21.09%
NUSA TENGGARA BARAT 735.96
14.56%
BALI 163.85
3.79%
BANTEN 654.46 5.09%
EAST JAVA 10.37% 4,112.25
DI YOGYAKARTA 448.47 11.7%
CENTRAL JAVA
10.8% 3,743.23
JAWA BARAT 3,399.16
6.91%
DKI JAKARTA 365.55
3.47%
KEP. RIAU 128.46 5.9%
BANGKA BELITUNG 68.38
4.62%
LAMPUNG 1,063.66 12.62%
BENGKULU 302.3
15.23%
SUMATERA SELATAN 1,073.74
12.71%
JAMBI 274.32 7.6%
RIAU 490.72 7.08%
WEST SUMATERA 348.22 6.42%
SUMATERA UTARA 1,282.04
8.83%
NANGROE ACEH DARUSSALAM 819.44
15.32%
0 1000 2000 3000 4000 5000
PEOPLE (THOUSANDS)
Source: BPS 2019
ENERGY SAFETY NETS | INDONESIA CASE STUDY 14Figure 5 demonstrates that expenditure for energy and 2019, was still much lower than it was in 2014.
subsidies increased in two years. Subsidies for LPG Moreover, very recent energy subsidy reforms (2019),
(cooking) increased from USD 3.0 billion in 2017 to particularly in electricity and LPG, have shifted from
USD 4.5 billion in 2018 and to USD 4.8 billion in 2019. a commodity-based subsidy system to a targeted
Nevertheless, energy subsidy spending in propor- (person-based) subsidy (see Figure 6 for a timeline
tion to the total government budget, in both 2018 of the history of energy reforms in Indonesia).
Table 1
TABLE 1: SUMMARY OF SOCIAL ASSISTANCE PROGRAMS AND ENERGY REFORMS
Summary of Social Assistance Programs and Energy Reforms
YEAR CAUSE OF REFORM SOCIAL ASSISTANCE RESPONSE
Scale-up of the IDT program
Launch of the social safety net programs (Jaring Pengaman Social/JPS) in 1998,
that consist of:
Increase in fuel price
1. A safety net for food security (sale of subsidized rice – RASKIN)
1997 by 70 percent due to
2. A safety net for employment creation (Padat Karya)
Asia Financial Crisis
3. A safety net for education (Scholarship and Block Grants)
4. A safety net for health (JPS-BK and Block Grants)
5. Regional development (PDM-DKE)
Compensation for energy subsidy reduction
1. Increased budget allocation for OPK Program – RASKIN
2. Education sholarships such as:
a. Bantuan Khusus Murid (BKM) for students
b. Bantuan Khusus Sekolah (BKS) for schools
2000 – Reduced budget allocation c. Bantuan Pendidikan Luar Sekolah for public learning centers.
2002 for energy subsidy 3. Health-care for poor households
4. Unconditional cash transfers (UCT)
5. Provision of clean water infrastructure
6. Revolving Fund
7. Direct financial assistance for community empowerment
8. Providing transportation subsidies
Compensation for the increase in fuel price:
1. Temporary unconditional cash transfer called Direct Cash Assistance Program
Increased world (Bantuan Langsung Tunai, or BLT)
2005 oil prices 2. Health Insurance for the Poor (Asuransi Kesehatan Masyarakat Miskin,
(fuel price hikes) abbreviated as Askeskin)
3. School Operational Assistance (Bantuan Operasional Sekolah, or BOS)
4. The Rural Infrastructure Program (Infrastrukture Pedesaan, or IP)
Launched two Conditional Cash Transfer (CCTs)
Kerosene-to-LPG reform
2007 1. Program Keluarga Harapan or PKH (Hopeful Families Program), and
initiation
2. PNPM Generasi Sehat dan Cerdas (PNPM Generasi)
Compensation for the increase in fuel price:
1. Re-introduction of temporary unconditional Cash Transfer for one year (BLT)
Increased world 2. Health Insurance for the Poor
2008 oil prices 3. School Operational Assistance
(fuel price hikes) 4. Assitance for poor students – Bantuan Siswa Miskin (BSM)
5. Micro Credits Program (Kredit Usaha Rakyat, or KUR), and
6. Other social expenditures
To compensate for the increase in fuel prices, GoI introduced a fuel subsidy compensation
package for the poor consisting of short-term programs and long-term programs.
Short-term programs:
1. Unconditional cash transfer (Bantuan Langsung Sementara Manyarakat/BLSM)
2. Rice for the Poor (Beras Miskin)
2013 Fuel price increased 3. Short-term infrastructure programs: P4-IP, P4-SPAM, P4-ISPA
Long-term programs:
1. Education subsidy for students called Bantuan untuk Siswa Miskin (BSM)
2. The Hopeful Family Program (Program Keluarga Harapan, PKH)
3. Social Assitance Program for Neglected Elderly (Asistensi Social Lanjut Usia
Terlantar or ASLUT)
To compensate for several energy subsidy reforms, the GoI introduced several
Gasoline subsidy was social assistance programs:
entirely removed; 1. Assistance for poor students – Programme Indonesia Pintar (PIP)
2015 –
adjustment in electricity 2. Scholarship for university students – BIDIK MISI
2017
tariffs; extension of LPG 3. Subsidized rice – the name changed to RASTRA
conversion 4. Introduction of electronic food vouchers (Bantuan pangan Non Tunai or
BPNT) in 2017 to be integrated with RASTRA program
Source: Authors' compilation
ENERGY SAFETY NETS | INDONESIA CASE STUDY 15This study was conducted to give detailed insight ergy for poor and vulnerable groups. In addition,
and shed light on how the Government of Indonesia it takes a deeper dive into two aspects: access to
supports access to affordable and modern energy electricity and access to LPG as a cleaner cooking
for the poor and vulnerable people in the context fuel. These two energy goals are quite distinct from
of Energy Safety Nets (ESNs). More specifically, it others since they are characterized by a shift from a
identifies the programs available for the poor and commodity-based subsidy toward a targeted subsi-
vulnerable people in Indonesia to access modern dy, which is relevant for the aim of this study.
technology, provides evidence based on the ben-
efits of energy policies for this group, and discusses This country case study—like the other five, cover-
the lessons learned for the ESN issue in Indonesia. ing Brazil, Ghana, India, Kenya and Mexico— seeks
This study is also complemented with direct infor- to answer four research questions:
mation on how policymaking processes have oc-
curred by drawing on expert interviews and focus • What policy measures have been used in Indo-
group discussions (FGDs) with the stakeholders nesia to enable poor and marginalized people to
involved, i.e. policymakers and experts who are di- access and use modern energy services?
rectly in charge of or involved in the study of energy • What links have there been/are there between
reforms in Indonesia. these measures and wider/other social assistance
programs?
RESEARCH QUESTIONS AND SCOPE • How effective have these measures been in en-
OF STUDY abling the poorest social groups to access and
use modern energy services?
Indonesia has experienced several energy reforms • What changes could be made to enhance the
for fuel subsidies, electrification, and LPG conver- effectiveness of existing policy measures in en-
sion. This study discusses the implications of these abling very poor people to access modern ener-
reforms in terms of ESNs, particularly access to en- gy services?
Figure 5
Budget Allocation for Energy Subsidies
FIGURE 1.5: GOVERNMENT OF INDONESIA BUDGET ALLOCATION ON ENERGY SUBSIDIES
FUEL ELECTRICITY LPG ENERGY SUBSIDIES (% SPENDING)
35 25%
23%
3.39
% OF GOVERNMENT SPENDING
30 21%
20%
19% 20%
18% 9.78 3.94
2.49 18%
18%
25 9.97 2.54
17% 8.18
8.20
BILLION USD
0.36 15%
16%
20
7.66
14% 12%
18.51
15 12% 10% 1.66 15.73 15.35
14.69 10%
9% 6.41
9% 3.51 12.35 7% 7%
10 0.91 3.37 0.84
9.73 6% 4.81
0.25 8.90 5.27 5% 5% 3.99
0.41 1.22 5%
7.43 7.12 7.51 4.23 1.85
6.58 2.99 3.99 4.13
5 0.46 0.40 4.41
0.41 3.95 3.73
3.49 3.54 3.18
2.33 2.33 2.21
0 1.39 0.78 0%
2000 2001 2002 2003 2004 2005 2006 2007 2008 2009 2010 2011 2012 2013 2014 2015 2016 2017 2018 2019
Source: The Ministry of Finance, Indonesia, State Budget Information (APBN), 2000−2019 (processed by authors)
ENERGY SAFETY NETS | INDONESIA CASE STUDY 16Energy Safety Net (ESN) is an umbrella term ESNs can make physical access (i.e. connec-
for government-led approaches to support tions) to electricity or clean fuels affordable for
very poor and vulnerable people to access poor and vulnerable people, or they can make
essential modern energy services, defined as the unit price of electricity or fuel affordable
electricity and clean fuels and technologies to consume. ESNs include some form of tar-
for cooking, by closing the affordability gap geting or eligibility criteria to direct benefits
between market prices and what poor cus- to those who need them.
tomers can afford to pay.
STUDY METHODS Susenas and Podes datasets. This part aims to
give a descriptive analysis of whether past and
Several approaches were used in order to address existing ESN programs, particularly for access
the above research questions: a literature review, to electricity and LPG for cooking, are effec-
quantitative analysis, in-depth interviews and FGDs. tive. The benefit incidence analysis deter-
These approaches afford a comprehensive analysis of mines whether poor and marginalized groups
ESNs in Indonesia that can be used for analyzing the have better access to modern energy sourc-
effectiveness of existing energy programs or policies, es than other groups. The benefit incidence
and also for providing valuable input for conducting analysis focuses not only on variations in in-
reforms. The remaining sections of this report will ad- come group but also on regional differences.
dress the above research questions as follows:
Qualitative Study of Past, Present and Future Di-
Evolution and Targeting of ESNs and Complemen- rection of ESNs in Indonesia: In-Depth Interviews
tarities with Other Social Assistance Programs in In- and FGDs with Key Stakeholders
donesia: A Literature Review
To complement the above analyses, the case
This section evaluates the history and evolution of study also gathered valuable information re-
ESNs in Indonesia based on the existing literature, garding ESNs in Indonesia from key stake-
reports and official documents. The aim is to iden- holders including various government min-
tify what energy reforms have been implemented istries, energy providers, commentators and
in Indonesia, how these reforms have increased academia. In-depth interviews were carried
energy access among the poor and among mar- out to better understand the context of ESNs,
ginalized groups, and to determine any other im- including why some policies were introduced,
pacts of these reforms. Moreover, as ESNs form the challenges that they face(d) and who was
part of the country’s socail protection program, responsible for driving the policy agenda.
this section will also explain the linkage between Two FGDs were also conducted in May and
ESNs and other social assistance programs. June 2019. The first served to validate re-
search questions and gather information and
Benefit incidence analysis of ESNs: Exploration of suggestions as to how the work should be car-
Susenas (National Socioeconomic Survey) and Po- ried out, while the second provided a forum
des (Village Potential) Datasets to discuss and refine the preliminary results of
the case study. Key stakeholders were invited
The case study also provides evidence-based to present their views to the groups at both
analysis by exploring secondary data from the events.
ENERGY SAFETY NETS | INDONESIA CASE STUDY 17Figure 6
Timeline History of Energy Reforms in Indonesia
2005 2014
1. Fuel price increased by an average of 29 percent in March 1. Electricity base tariff increased for industrial customers with
(Presidential Regulation No.22/2005) a connection > 200 kVA (MEMR Ministerial Regulation No.09/2014)
2. Fuel price increased by an average of 114 percent in October 2. Electricity base tariff adjustment for 12 non-subsidized PLN
(Presidential Regulation No.55/2005) customer groups (MEMR Ministerial Regulation No.31/2014)
3. Price increased by 31 percent for gasoline and 26 percent for diesel
(MEMR Ministerial Regulation No.34/2014)
2007 4. Price decreased by 12 percent for gasoline and 3.5 percent for diesel
(MEMR Ministerial Regulation No.39/2014)
1. Introduction of kerosene-to-LPG conversion program 5. The start of gradual increase of non-subsidized 12 Kg LPG price
in Indonesia (Presidential Regulation No.104/2007)
2. Start of distribution of subsidized 3 kg LPG in most developed
regions (MEMR Ministerial Decree 3175 K/10/MEM/2007)
2015
1. Subsidies for gasoline entirely removed and diesel
2008 subsidies reduced to IDR 1,000/liter
2. Price decreased by 13 percent for gasoline and 12 percent for diesel
1. Price increased by 33 percent for gasoline, 28 percent for diesel
(MEMR Ministerial Regulation No.04/2015)
25 percent for kerosene in May (MEMR Ministerial Regulation
No.16/2008)
2. Gasoline prices were lowered by 9 percent (MEMR Ministerial
Regulation No.38/2008) 2016
3. Gasoline and diesel prices were lowered by 9 percent and
1. Electricity base tariff adjustment for 12 non-subsidized PLN
13 percent respectively (MEMR Ministerial Regulation No.41/2008)
customer groups starting from 1 January 2017 and for
900 VA non-subsidized group starting from 1 July 2017
(MEMR Ministerial Regulation No.28/2016)
2009
1. Prices lowered by 11 percent for gasoline and 7 percent for diesel
in January (MEMR Ministerial Regulation No.01/2009) 2017
2. Start of distribution of subsidized 3 kg LPG in less-developed
regions 1. Electricity base tariff adjustment for 900 VA non-subsidized
group was delayed until 1 January 2018
(MEMR Ministerial Regulation No.41/2017)
2012 2. Revocation of the electricity subsidy for 900 VA non-poor
customers (about 4.1 million customers)
1. Electricity base tariff increased by 15 percent overall in 2013
households with a 450 or 900 VA connection
(MEMR Ministerial Regulation No.30/2012) 2018
1. Maximum diesel subsidy become IDR 2,000/liter
2013 (MEMR Ministerial Regulation No.40/2018)
1. One-off fuel price increase, an average of 40 percent
(MEMR Ministerial Regulation No.18/2013) 2019
1. Subsidized 3 Kg LPG distributed in East Nusa Tenggara
as part of LPG-to-kerosene-conversion. Subsized LPG has not
been distributed in Maluku and Papua
Pilot testing of targeted subsidy distribution mechanism of 13 Kg
Source: Authors’ compilation LPG for subsidy recipient using biometrics by TNP2K
ENERGY SAFETY NETS | INDONESIA CASE STUDY 18ENERGY SAFETY NETS AS PART OF ENERGY REFORMS AND SOCIAL PROTECTION IN INDONESIA ENERGY SAFETY NETS | INDONESIA CASE STUDY 19
EVOLUTION OF ENERGY SUBSIDY                                Historically, fuel price adjustments have been im-
SYSTEM IN INDONESIA                                        plemented under every government administra-
                                                           tion (see Figure 6 and 7). Moreover, since the Asian
The Government of Indonesia has a long history             Financial Crisis in 1997 (also referred to as the IMF
of subsidizing energy—including gasoline, diesel,          crisis) the government has made several attempts
kerosene, LPG and electricity—as an instrument to          to cut fuel subsidy expenditures (see Dartanto 2013;
stabilize prices and as a social welfare policy (Per-      Dartanto 2017; Perdana 2014; and Tumiwa et al.
dana 2014). The provision of energy subsidies and          2012 for a detailed explanation of the evolution of
increasing access to energy for the poor are both          fuel subsidies in Indonesia). Reducing the amount
mandated under the 2007 Energy Law (30/2007).              of expenditure for energy subsidies has enabled the
                                                           government to allocate the freed-up fiscal space for
Historically, Indonesia’s subsidy policies focused on      other social welfare programs. As discussed below,
universal price support for energy commodities, i.e.       they have also attempted to protect poor house-
per liter of gasoline or per kilowatt hour (kWh) for       holds from the adverse impacts of reducing ener-
electricity. The aim was to increase energy accessi-       gy subsidies (Pradiptyo et al. 2016). Since 2005, the
bility for the poor through lower energy prices. The       government has launched several social assistance
outcome of this policy was that much of the subsidy        programs, which better target poor people than the
was misdirected to richer households who could af-         universal commodity-based fuel subsidies.
ford to purchase (and utilize) more of the subsidized
fuels. This was compounded by the fact that there          The revolution in Indonesia’s energy subsidy reform
was no mechanism to control or filter the consum-          has been to shift the type of subsidy system from
ers who could or could not purchase the subsidized         a commodity-based subsidy to a person-based
products at the supplier or retailer level. As a result,   (targeted) subsidy. These reforms have been par-
the energy subsidies benefited the poorer part of          ticularly instrumental in the case of reforms to elec-
society far less than the richer part (Agustina et al.     tricity tariffs and in the kerosene-to-LPG program.
2012; Dartanto 2013; Savatic 2016; Widodo et al.           Although driven by a motivation to ease fiscal pres-
2012). Dartanto (2013) and Agustina et al. (2012) re-      sure, this new subsidy policy system has also im-
vealed that under these policies nearly 30 percent of      proved access to modern energy (better electricity
the government fuel subsidy distribution went to the       and cleaner cooking fuel) for poor people in Indo-
richest 10 percent of the population and more than         nesia. A key element of this reform implementation
half of the subsidy went to the richest 30 percent.        was Indonesia’s new unified beneficiary database.

Increasing consumption, price, and price volatility of        “… To conduct a reform we need three things;
fossil fuels created an enormous fiscal burden that           the availability of data, the mechanism, and
drove the government to institute several reforms to          monitoring system. And right now we already
its energy subsidy program.vi While improving en-             have the first one [the 2015 BDT]…” (expert
ergy access has featured prominently in the reform            interviewee).
process, the key driver has always been reducing
the fiscal pressure that energy subsidies put on gov-      Unified Database System (Basis Data
ernment balance sheets.                                    Terpadu or BDT)

   “… The main trigger for energy reform is sub-           The program of developing the Unified Database
   sidy burden, while aiming to widen the access           System (Basis Data Terpadu (BDT)) was initiated in
   of energy for people is just secondary impact…”         2005 under President Yudhoyono’s administration.
   (expert interviewee)                                    It was initially called Pendataan Sosial Ekonomi or

ENERGY SAFETY NETS | INDONESIA CASE STUDY                                                                           20
Figure 7
FIGURE 2.1: GOI’S EXPENDITURE ON ENERGY AND NON-ENERGY SUBSIDIES
Government Expenditure on Energy and Non-Energy Subsidies during Different
Administrations
NON-ENERGY SUBSIDIES (FOOD, SEED, FERTILIZER, LPG SUBSIDIES ELECTRICITY SUBSIDIES FUEL SUBSIDIES
INTEREST, PSO, TAX, OTHERS)
20 18.51
SUBSIDY BUDGET ALLOCATION
15.35
15 15.73
14.69
(USD BILLION)
12.35
9.73 9.97 9.78
10
8.20 8.18
8.9 7.66 7.51
6.58 6.21 6.10 4.81
7.43 5.27 6.41 5.64 4.52
7.12 4.85 4.48
5 6.36 4.13 4.04 4.41 4.35
3.49 3.37 3.51 4.62 3.70 3.73
2.33 4.77 4.23 4.13
3.54 3.95 3.94 2.85 3.99
1.66 3.54 3.39 3.18 2.99
0.46 0.86 0.79 0.92 0.82 2.49 2.54 2.33 2.21
1.42 1.66 1.22 1.39
0 0.91 0.36 0.84 0.78
0.41 0.41 0.46 0.4 0.25
2000 2001 2002 2003 2004 2005 2006 2007 2008 2009 2010 2011 2012 2013 2014 2015 2016 2017 2018 2019
Source: The Ministry of Finance, Indonesia, 2000−2019 (processed by authors)
PSE, which translates to Socio Economic Data Col- including in 2008 (when the name was changed to
lection. However, the data were initially only used Pendataan Program Perlindungan Sosial or PPLS,
to identify eligible beneficiaries for (non-energy) so- which translates to Social Protection Program Data-
cial assistance programs. The BDT is a micro-level base), in 2011, and most recently in 2015. The 2015
electronic database that is built from census data round of updates included upgrading the system
(from Statistics Indonesia (BPS)) and contains so- and methodology and changing the name to BDT.
cial, economic and demographic information that is
linked to the names and addresses of respondents Figure 8 shows the data collection method for the
(TNP2K 2018a). These data are used to conduct the 2015 BDT. The process started by making use of the
proxy means test (PMT) that classifies the poorest initial PPLS 2011 data that combined several other
40 percent of the population (25.7 million house- sources of information such as village-level data
holds as per the latest round). The PMT itself con- from 2013−2014, data from other social protection
siders household characteristics and demographic programs, the unconditional cash transfer (UCT) da-
indicators including employment, housing, asset tabase that had previously not been included in the
ownership, education, health and social assistance BDT, validation and verification results from the Min-
membership information. istry of Social Welfare, and suggestions for inclusion
from local governments. These data were then pre-
The BDT is administered by the Ministry of Social sented at a Public Consultation Forum (Forum Kon-
Welfare but involves a technical team that draws on sultasi Publik or FKP)vii as a temporary household
expertise from several ministries, including the Min- database. This database was then used by Statis-
istry of Social Welfare, the Coordinating Ministry for tics Indonesia to identify which households should
Human Development and Cultural Affairs, the Na- be included in a census questionnaire to create the
tional Team for the Acceleration of Poverty Reduc- 2015 BDT update. Once these updated data were
tion (TNP2K), Statistics Indonesia (BPS), the Ministry collected, TNP2K carried out data analysis and de-
of National Development Planning (Bappenas) and veloped the PMT model that yielded the 2015 BDT
the Ministry of Home Affairs. The data have been database. The various stages of the process are de-
updated several times since the BDT was launched, signed to address the inclusion and exclusion errors
ENERGY SAFETY NETS | INDONESIA CASE STUDY 21BOX 1: TNP2K – The National Team for the Acceleration of Poverty Reduction
The National Team for the Acceleration of Poverty sponsibility of the President of Indonesia. TNP2K is
Reduction (Tim Nasional Percepatan Penanggulan- chaired by Indonesia’s Vice President, and reports
gan Kemiskinan (TNP2K)) was created to promote to the President. Its specific mandates are to: es-
coordination across ministries and agencies to im- tablish a national targeting system that contains a
prove the implementation of poverty reduction list of the names and addresses of social assistance
programs, improve the living standards of the poor beneficiaries, hereinafter referred to as BDT, and
and vulnerable, and reduce inequality between in- improve the efficiency and effectiveness of various
come groups. It was established with Presidential poverty alleviation programs to reach beneficiaries.
Regulation Number 15 of 2010 and coordinates Evidence from research as well as data from the
across sectors and stakeholders to reduce poverty field makes coordination more efficient and based
at the national level, efforts that fall under the re- on common understanding.
in the BDT data. The next update to the BDT will ity-based subsidies via below cost electricity tariffs.
involve local governments in the registration and Generally, the electricity price in Indonesia, which is
verification of new and existing poor households in set by the government, varies by consumer group
their respective regions. and sub-group (i.e. industry, business, residential
and public services). Consumers are billed every
The BDT database has made the targeted subsidy month based on their usage. Regular consumers
system possible. However, it has not been updated receive bills for their usage while prepaid users pur-
since 2015 and the absence of current data could chase electricity tokens upfront. Indonesia does not
mean that some eligible poor households might charge fixed costs, but regular consumers must pay
not be included in the BDT dataset (Type I error: ex- a minimum tariff (see the following paragraph for
clusion error), while others who are part of the BDT an example). There is no minimum tariff for prepaid
database might actually no longer be classified as users. For both groups, the tariffs are typically high-
poor (Type II error: inclusion error). In an attempt to er for consumers with higher power connections,
overcome exclusion errors, one expert interviewee measured in volt-ampere (VA) (Burke & Kurniawati
noted that a reporting system has been implement- 2018). Usage is charged via increasing block tariff
ed that allows households to report their situationviii structures, in which consumers pay a higher mar-
if they believe themselves to be eligible. The task ginal per-kilowatt hour (kWh) tariff at higher usage
forceix will then verify the reported cases and de- levels (see Table 3). Low-power consumers pay a
termine whether or not the household is eligible to lower tariff and the series of increasing block tariffs
receive the subsidy. is set to make the lower levels of consumption more
affordable. It is implicitly assumed that lower-pow-
ENERGY REFORM TOWARDS A er, lower-consumption households are more likely
TARGETED-SUBSIDY SYSTEM FOR to be poor. However, other consumers may face a
ELECTRICITY minimum monthly electricity bill, and this minimum
price (standing monthly charge), in contrast to in-
Besides subsidizing petroleum fuels, the govern- creasing block tariff, penalizes those who consume
ment also has a long history of providing commod- the least electricity.
ENERGY SAFETY NETS | INDONESIA CASE STUDY 22FIGURE 8: BDT DATA COLLECTION METHOD 2015
Figure 8
BDT Data Collection Method 2015
Data from other Social
Protection Programs
PPLS Data
UCT (or PKH) Data that are Temporary Household
2011
not yet Registered in BDT Database
Public
+ Consultation Forum
(Forum Konsultasi (Approved by Village/
Village/District Publik or FKP) District and then
Validation and verification
Level Forum approved by
result from the ministry of
2013-2014 Regent/Mayor)
Social Welfare
Suggestions from the
local government
Data Analysis & Proxy Means Households census/enumeration
Basis Data Terpadu (BDT) Testing Model Development of 2015 BDT updating (called PBDT)
(TNP2K) (Statistics Indonesia (BPS))
Source: TNP2K 2018a
Table 2 shows that regular and prepaid users are sidy, since they can afford and utilize more electri-
charged different tariffs, even if they use the same cal devices than the poor. Subsidization also leads
amount of electricity. If, for example, a household to inefficient use of electricity that in turn creates
with a 450 VA connection consumes 100 kWh in unnecessary air pollution from electricity gener-
one month, then the utilization cost charged for that ation. In addition, subsidies reduce the economic
month for a regular user household is [30 kWh × IDR incentive for the state-owned electricity company
169) + (30 kWh × IDR 360) + (40 kWh × IDR 495) = Perusahaan Listrik Negara (PT PLN) to expand its
IDR 35,670, while a prepaid user household will be access to less-serviced areas where it is less likely
charged IDR 41,500 (100 kWh × IDR 415). A regular to recover higher costs from even lower revenues
consumer household that uses only a small amount (Burke et al. 2018). Over the years, national expen-
of electricity, however, say 25 kWh, still needs to pay diture on electricity subsidies exerted an increasing
the minimum utilization cost of IDR 11,000 (instead amount of pressure on the state budget as both the
of 25 kWh × IDR 169 = IDR 4,225), while a prepaid demand and the cost of supplying electricity grew.
consumer household has to pay IDR 10,375 (25 kWh This culminated in supply shortages and rolling
× IDR 415). Thus, using a prepaid option in such cas- blackouts, as illustrated in Figure 9 using a analysis
es of low kWh utilization can give cheaper utilization of supply and demand. The large increase in de-
costs (for the same amount of electricity consumed) mand of electricity due to subsidy provision shifted
compared to the regular option.x the electricity demand curve to the right, while the
increasing marginal cost for PT PLN in providing
General electricity subsidies suffer similar prob- this additional electricity demand shifted the sup-
lems to petroleum fuel subsidies. For example, the ply curve to the left, creating the demand excess/
richer segments of the population are those who supply shortage. To return to equilibrium (point B
benefit from a larger portion of the electricity sub- in the graph) the price would have to increase (to
ENERGY SAFETY NETS | INDONESIA CASE STUDY 23Table 2
Comparison of Monthly Electricity Charges for Different Levels of Consumption and
Different Modes of Payment
IDR 35,670
Utilization Costs for 100 kWh charged by IBT Block = (30 kWh × IDR 169) + (30 kWh × IDR 360)
+ (40 kWh × IDR 495)
IDR 41,500
Utilization Costs for 100 kWh if prepaid
= 100 kWh × IDR 415
IDR 11,000
Utilization Costs for 25 kWh charged by IBT Block
= minimum utilization cost
IDR 10,375
Utilization Costs for 25 kWh if prepaid
= 25 kWh × IDR 415
Source: Authors’ analysis
Pnew). Otherwise, if the price were maintained at the following paragraph) helped to almost half the
initial value (Pinitial), demand (Dnew) would still exceed electricity subsidy from USD 8.2 billion in 2014 to
supply (Snew). Correcting these market failures and USD 4.2 billion in 2015.
investing in the electricity network resulted in the
81 hours without electricity due to rolling blackouts Reform of electricity subsidies started in 2013,
users suffered in 2008, falling to five hours per year during the final years of the Yudhoyono presiden-
by 2015 (Burke et al. 2018). cy and the first years of the Widodo presidency,
and was initiated by MEMR Regulation No. 30–
Figure 10 depicts the trend in government sub- 2012. In 2013, the price of the basic electricity
sidy expenditure for electricity, and its share tariff was increased for both industrial customers
of total energy subsidy spending and the total and households. Other increases in electricity tar-
government budget. The data indicate that gov- iffs were implemented in 2014 and 2015. Not all
ernment expenditure on electricity subsidy in- tariff rates were affected by the electricity subsi-
creased from USD 0.9 billion (IDR 8.9 trillion) in dy reforms; tariffs for consumers with connections
2005 to USD 3.4 billion (IDR 30.4 trillion) in 2006 of up to 900 VA, i.e. most households and small
due to increasing oil prices. In part this increase enterprises, remained unchanged from 2003 until
reflects how dependent Indonesia’s electricity around 2016. In addition, to make the tariffs ac-
generation is on fossil fuels and their prices in commodate changes in global macroeconomic
international markets. The level of electricity sub- factors, the government implemented a tariff ad-
sidy was also high during the period 2011−2014, justment policy, in which the basic electricity price
although the percentage of total expenditure on varies every month depending on three main indi-
energy subsidies was lower. From 2014, along cators: exchange rate (Indonesian Central Bank),
with changes in international fuel prices, the inflation rate (Indonesian Statistics), and Indone-
reforms to electricity tariffs (discussed in the sian crude price (ICP).
ENERGY SAFETY NETS | INDONESIA CASE STUDY 24You can also read