Telecommunications Infrastructure International Comparison - A Report for the Department for Digital, Culture, Media and Sports - Gov.uk
←
→
Page content transcription
If your browser does not render page correctly, please read the page content below
Telecommunications Infrastructure
     International Comparison
A Report for the Department for Digital,
     Culture, Media and Sports

               30 March 2018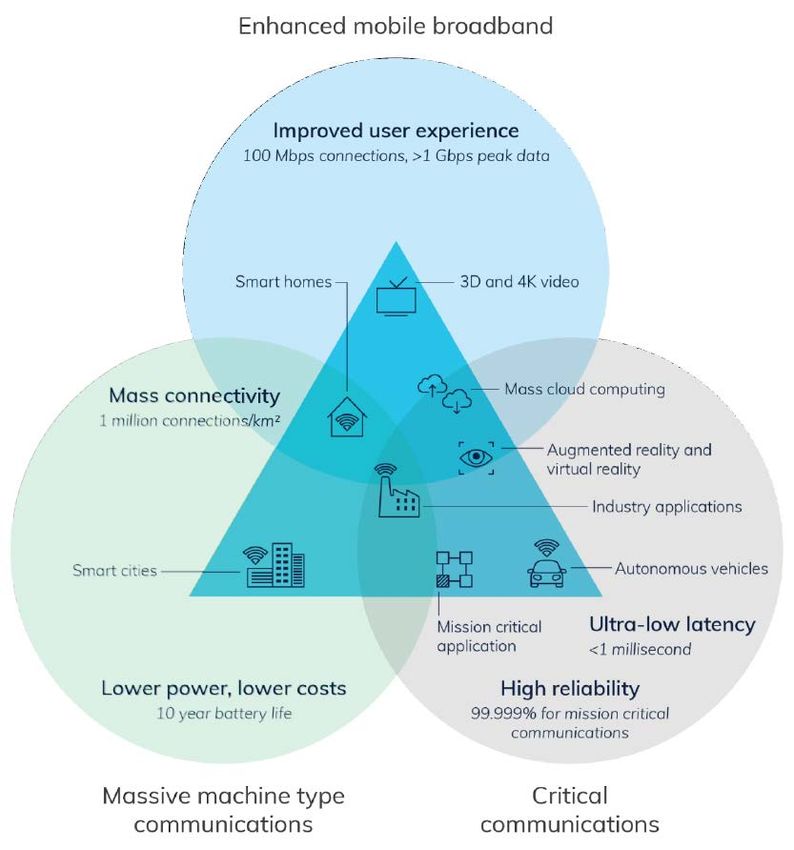
Telecommunications Infrastructure
 International Comparison

Project Team

Bruno Soria, PhD

Jeffrey A. Eisenach, PhD

James Mellsop

William Taylor, PhD

Gabriela Orsini

NERA Economic Consulting
Goya, 24, 6º Planta
28001 Madrid, Spain
Tel: 34 91 212 6400 Fax: 34 91 521 7876
www.nera.com

NERA Economic Consulting
Telecommunications Infrastructure
 International Comparison

CONFIDENTIALITY

We understand that the maintenance of confidentiality with respect to our clients’ plans and
data is critical to their interests. NERA Economic Consulting rigorously applies internal
confidentiality practices to protect the confidentiality of all client information.

Similarly, our approaches and insights are proprietary and so we look to our clients to protect
our interests in our proposals, presentations, methodologies, and analytical techniques. Under
no circumstances should this material be shared with any third party without the prior written
consent of NERA Economic Consulting.

© NERA Economic Consulting

NERA Economic Consulting
Telecommunications Infrastructure
 International Comparison

                                                  Table of Contents
EXECUTIVE SUMMARY .............................................................................................................. IV
1.        INTRODUCTION ...............................................................................................................1
          1.1. Development of Ultrafast Broadband Networks ..................................................1
          1.2. Policy models ........................................................................................................2
          1.3. The Challenge of FTTP and 5G Deployment .......................................................4
2.        URBAN FTTP DEVELOPMENT..........................................................................................5
          2.1. Case Study: Spain .................................................................................................7
          2.2. Case Study: New Zealand ...................................................................................14
          2.3. Case Study: Sweden............................................................................................20
          2.4. Case Study: France .............................................................................................24
          2.5. Case Study: Germany .........................................................................................28
          2.6. Case Study: Australia..........................................................................................32
          2.7. Cross Country Comparisons of Relevant Issues .................................................39
3.        RURAL ULTRAFAST BROADBAND .................................................................................50
          3.1. Overview and Policy Models ..............................................................................51
          3.2. Country Case Studies ..........................................................................................51
          3.3. Cross-Country Analysis ......................................................................................56
4.        CORPORATE AND MOBILE BACKHAUL FIBRE SERVICES ...............................................60
          4.1. Spain .................................................................................................................61
          4.2. New Zealand .......................................................................................................61
          4.3. Sweden ................................................................................................................61
          4.4. France .................................................................................................................61
          4.5. Germany..............................................................................................................62
          4.6. Australia ..............................................................................................................62
5.        5G READINESS ..............................................................................................................63
          5.1. Overview .............................................................................................................63
          5.2. Country Case Studies ..........................................................................................65
          5.3. Cross-Country Analysis ......................................................................................74
6.        CONCLUSIONS AND RELEVANCE TO THE UK ................................................................77
          6.1.    Urban FTTP Development..................................................................................77
          6.2.    Rural Ultrafast Broadband ..................................................................................80
          6.3.    Corporate and Backhaul Fibre Services..............................................................81
          6.4.    5G Readiness ......................................................................................................81

NERA Economic Consulting                                                                                                                i
Telecommunications Infrastructure
 International Comparison

                                                  List of Tables

Table 1. Evolution of Network Competition across Countries ................................................39
Table 2. Passive infrastructure Used by FTTP Operators........................................................41
Table 3. Fibre Operators’ Techniques to Gain Access to Passive infrastructure.....................42
Table 4. Fixed Broadband Market Share of Converged Fixed-mobile Operators ...................46
Table 5. Stokab Operating Cash Flow (million SEK) .............................................................46
Table 6. Administrative Processes for FTTP Deployment ......................................................48
Table 7. European Commission decisions on State aid to broadband (2009-2017) ................57
Table 8. Fixed-Wireless Networks ..........................................................................................59
Table 9. Mobile and Corporate Customers’ Transmission Services........................................60
Table 10. Planned Dates for Frequency Releases ....................................................................75
Table 11. Use cases mentioned in National 5G Plans .............................................................76

                                                 List of Figures
Figure 1 Policy models applied to urban and rural areas ...........................................................v
Figure 2. Evolution of Broadband Networks .............................................................................2
Figure 3. Clusters for Ultrafast Broadband Solutions ................................................................2
Figure 4 Policy models applied to urban and rural areas ...........................................................3
Figure 5. GDP/Capita (2005, GBP) ...........................................................................................5
Figure 6. Internet Users/100 pop, (2005) ...................................................................................5
Figure 7. Network Coverage 2016 (% premises).......................................................................6
Figure 8. FTTP Development 2016 (% households) .................................................................6
Figure 9. FTTP Coverage in Spain (% households) ..................................................................8
Figure 10. Industry Structure in Spain 2009 ............................................................................10
Figure 11. In-building cabling technique in Telefónica's FTTP network (% premises) .......12
Figure 12. FTTP Coverage in Spain (% households) ..............................................................12
Figure 13. Industry Structure in Spain 2016 ............................................................................13
Figure 14. FTTP Coverage in New Zealand (% households) ..................................................14
Figure 15. Challenges to FTTP deployment identified in New Zealand .................................17
Figure 16. New Zealand regulatory framework post-2020 ......................................................18
Figure 17. Industry Structure in New Zealand 2005................................................................19
Figure 18. Industry Structure in New Zealand 2017................................................................20
Figure 19. FTTP Coverage in Sweden (% households)...........................................................20
Figure 20. Industry Structure in Sweden 2005 ........................................................................22
Figure 21. FTTP Coverage in Sweden (% households)...........................................................23
Figure 22. Industry Structure in Sweden 2017 ........................................................................23
Figure 23. FTTP Coverage in France (% households) ............................................................24
Figure 24. Industry Structure in France 2005 ..........................................................................26
Figure 25. FTTP Coverage in France (% households) ............................................................27
Figure 26. Industry Structure in France 2017 ..........................................................................27
Figure 27. FTTP Coverage in Germany (% households) ........................................................28
Figure 28. Industry Structure in Germany 2005 ......................................................................29
Figure 29. FTTP Coverage in Germany (% households) ........................................................30
Figure 30. Average prices for 100 Mbps services in Germany (September 2017)..................31
Figure 31. Industry Structure in Germany 2017 ......................................................................32
Figure 32. FTTP Coverage in Australia (% households).........................................................33

NERA Economic Consulting                                                                                                    ii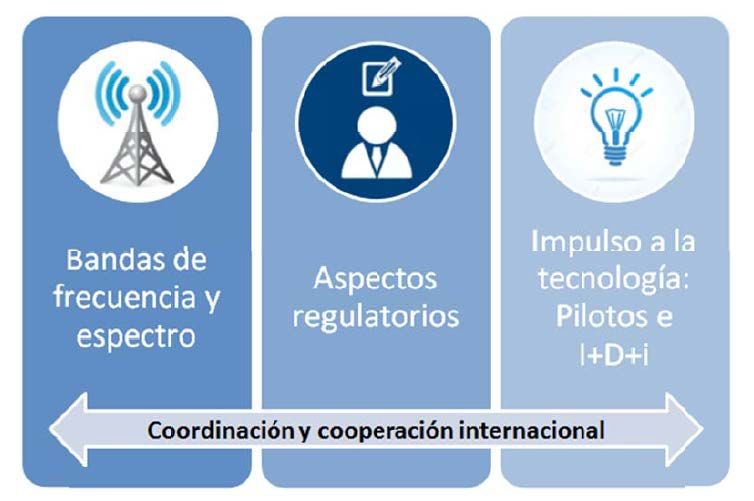
Telecommunications Infrastructure
International Comparison
Figure 33. Industry Structure in Australia 2005 ......................................................................35
Figure 34. Technology mix in Australia's NBN under the MTM model (% premises
passed) .................................................................................................................37
Figure 35. Industry Structure in Australia 2017 ......................................................................38
Figure 36. FTTP coverage and building size 2016 (% Households) .......................................40
Figure 37. Evolution of FTTP Coverage in France and Spain ................................................48
Figure 38. FTTP Coverage (% households) and Urban Population (% total population) -
2016 .................................................................................................................50
Figure 39. Rural Population Density 2016 (pop/km²) .............................................................50
Figure 40. 5G Frequencies for Different Application Scenarios .............................................63
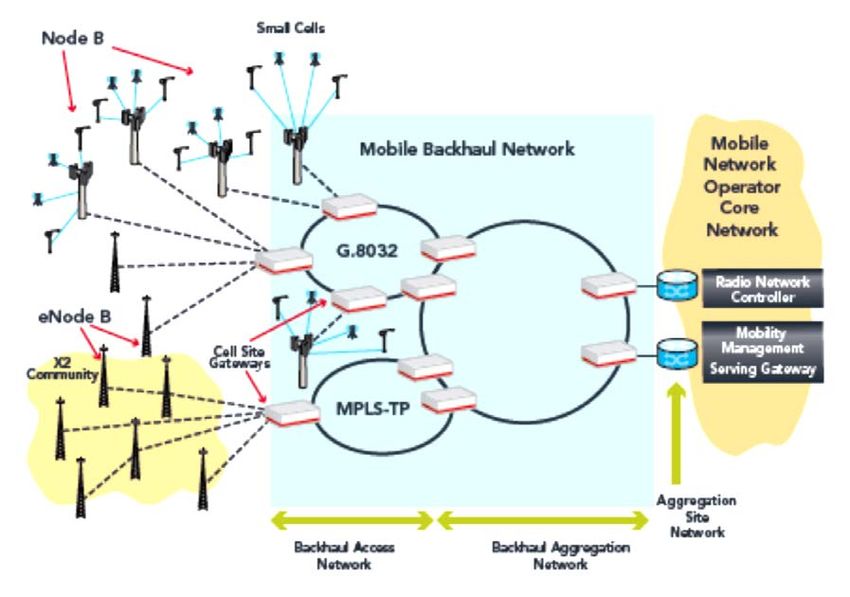
Figure 41. Conventional Mobile Backhaul Architecture .........................................................64
Figure 42. Fronthaul Reference Architecture ..........................................................................65
Figure 43. Action lines of the Spanish 5G National Plan ........................................................66
Figure 44. New Zealand Planned Spectrum Release Schedule ...............................................69
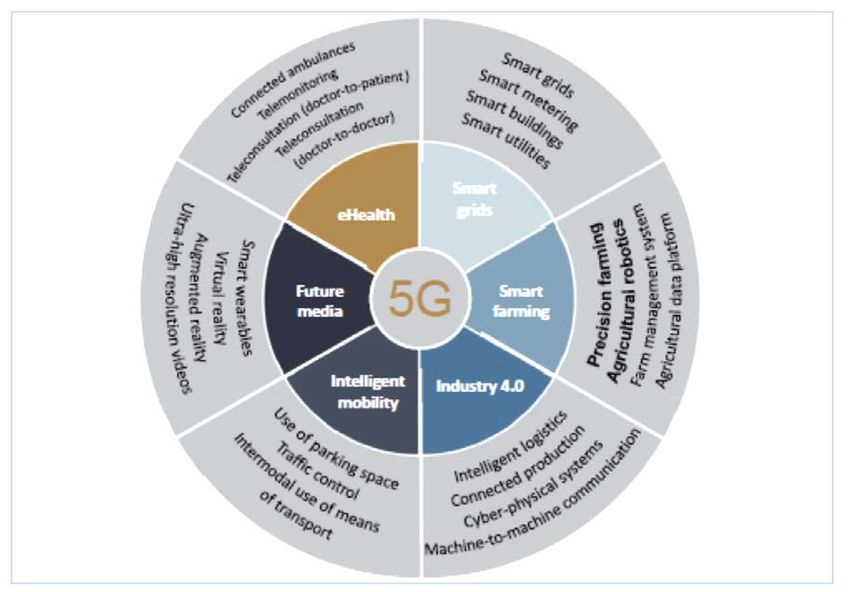
Figure 45. Application Domains of 5G Networks ...................................................................72
Figure 46. 5G Application Examples for Municipalities .........................................................72
Figure 47. 5G use cases identified by Australian Government ...............................................73
NERA Economic Consulting iii
Telecommunications Infrastructure
 International Comparison

EXECUTIVE SUMMARY
The Department for Digital, Culture, Media and Sports (DCMS) has asked NERA Economic
Consulting (NERA) to conduct an international comparison how the deployment of ultrafast
telecommunications infrastructure has worked in six countries: Australia, France, Germany,
New Zealand, Spain and Sweden. DCMS instructed NERA to focus on the deployment of
fibre-to-the-premises (FTTP) networks; fibre backhaul for mobile networks; and how those
countries were preparing for the deployment of fifth-generation (5G) mobile networks and
services. DCMS also asked NERA to identify which of those experiences could be relevant
inputs to policy making in the United Kingdom.

We have identified those countries to follow five different policy models to foster FTTP
deployment:

(1) Unregulated infrastructure competition between private operators. No asymmetric
    ex ante regulation is imposed on fibre connections. This is the case in urban areas in
    Spain and France.
(2) Regulated infrastructure competition between private operators. The incumbent
    operator’s fibre services are subject to asymmetric ex ante regulation. This is the case in
    Germany.
(3) Nominated regional networks with public funding. This is the case in urban areas in
    New Zealand, where the government tendered public subsidies to private operators who
    committed to deploy wholesale-only FTTP networks in an area on a non-exclusive basis.
(4) State-owned regional networks that compete with other networks. This is the case in
    Sweden, where municipalities deployed wholesale-only networks to compete with
    incumbent telecommunications and cable operators.
(5) State-owned monopoly national network. This is the case in Australia, where the
    government set up a national network operator who acquired all other networks to build a
    monopoly.
Because of the different economics and market dynamics of different customer segments and
different geographies, we have organised our analysis in four sections: urban FTTP
development; rural ultrafast broadband deployment; corporate and mobile backhaul services;
and 5G readiness.

This division is consistent with the fact that most countries have applied different policies in
different geographic areas (Figure 1).

NERA Economic Consulting                                                                          iv
Telecommunications Infrastructure
International Comparison
Figure 1
Policy models applied to urban and rural areas
Urban FTTP development
All countries in the sample have extensive next-generation access (NGA) deployments. The
three countries with the most extensive FTTP deployments are New Zealand, Spain and
Sweden. In contrast with them, some of the others have relied on VDSL or cable instead of
FTTP for all or part of their territory (Germany and partially Australia).
Best practices have followed different policy approaches:
Spain implemented unregulated infrastructure competition between private
operators, using regulated access to the incumbent’s ducts. This model has also been
successfully implement in very dense areas in France, and in countries outside our sample
such as Portugal, the US, Brazil and Chile.
Sweden implemented state-owned regional networks that compete with other
networks (municipal networks and an incumbent telecommunications operator partially
owned by the central government).
New Zealand implemented competition for the market through tenders that granted
public funding to nominated wholesale-only regional networks with public
partnership, in exchange for their commitment to deploy an FTTP network in specific
geographic areas. Services are delivered at negotiated prices and operators are not granted
exclusivity in their areas.
We have identified some factors that are present in most or all of best practices, and less
frequently or never in countries with lower FTTP development.
Deregulation or flexible regulation of fibre services;
Access to passive infrastructure;
Active measures to decrease the cost and time required to deploy fibre cables in the final
drop of the local loop (from the street cabinet to customer premises);
NERA Economic Consulting v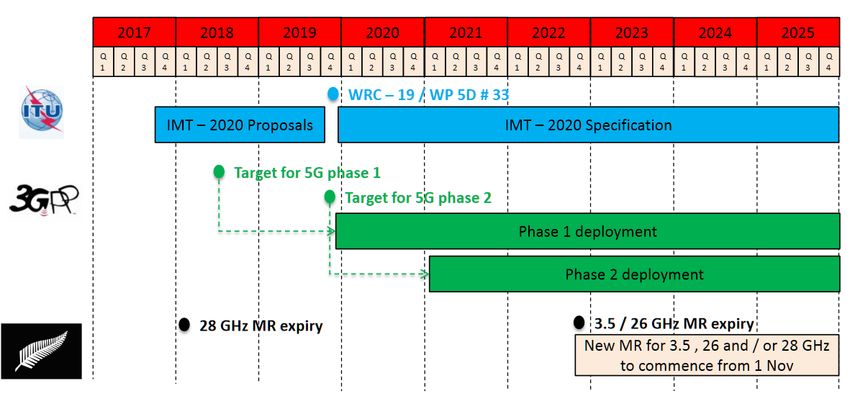
Telecommunications Infrastructure
International Comparison
Infrastructure competition is fostered, or at least permitted;
Administrative processes are lean.
We have also identified other common trends:
Large FTTP deployments have resulted in increased infrastructure competition;
Countries with vertically integrated and wholesale-only operators have similar outcomes;
In countries with vertically integrated operators, consolidation and fixed-mobile
convergence at the retail level are associated with larger FTTP deployments;
Wholesale-only networks require public funding in all cases in the sample, because they
have been unable to make a profit that covers private investors’ cost of capital.
Rural ultrafast broadband
Rural ultrafast broadband policies in all of the analysed countries have relied on public
support and the partial use of wireless technologies.
Public subsidies are usually offered to nominated operators to deploy regional networks in
tenders that foster competition for the market in a given geographic area.
The franchise model (legal exclusivity in a given area) is untested in the countries that we
analysed.
State-owned operators are not deploying FTTP in rural areas, except municipal networks
in some parts of France and a few places in Germany.
In addition to financial support, operators sometimes receive other help that contributes to
lower their costs, such as privileged access to existing passive infrastructure or
streamlined permits.
Wireless networks play an important role in rural NGA deployment.
Rural coverage obligations were attached to 4G spectrum licences and are likely to be
attached to 5G licences.
Satellite and fixed wireless access solutions have been included in some rural broadband
plans.
Technologically neutral tenders have sometimes resulted in wireless solutions being
chosen.
Corporate and mobile backhaul fibre services
Business customers and mobile operators demand different services to residential customers.
Corporate networks often require fibre links. Mobile backhaul is more reliant on fibre with
each generation (quite reliant for 4G and critically reliant for 5G).
Larger business customers generally have few problems with access services. They lease
competitive services in many areas with network competition and regulated leased lines or
active broadband services in less competitive zones. Fibre connections are usually available
on-demand even in areas where there is no FTTP deployment, usually at a higher price than
in metropolitan areas.
NERA Economic Consulting vi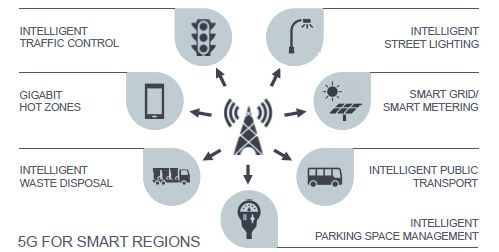
Telecommunications Infrastructure
International Comparison
Mobile operators that do not own a fixed network have to build their own fibre links or rely
on fibre backhaul supplied by third parties. Some countries have implemented policies to ease
mobile operators’ access to fibre backhaul.
Wholesale-only network operators sell fibre for backhaul as one of their services.
Mobile operators have the right to lease ducts to deploy mobile backhaul in Spain and
France. In Spain, they have the right to lease dark fibre when there is no free space in
ducts.
5G readiness
The analysed countries are launching 5G national plans to make their digital sector ready for
5G. All 5G plans analysed take a comprehensive perspective. That is, they look at spectrum
planning and at other issues beyond radio expected to be critical to 5G deployment:
Timely allocation and release of spectrum in 5G bands;
Test beds of 5G equipment and services; and R&D in applications and equipment related
to high priority use cases; and
Removal of barriers to 5G deployment: streamlining building permit processes, reviewing
competitive conditions to relax competition law barriers to active network sharing, etc.
In Sweden, there is not a separate 5G plan. All types of ultrafast technologies are considered
together in the Completely Connected Sweden plan.
NERA Economic Consulting viiTelecommunications Infrastructure International Comparison 1. INTRODUCTION Broadband communications networks are key to social and economic development in the 21st century. The most developed countries in the world are implementing policies to ensure that they have best-in-class connectivity for business and residential subscribers so they remain competitive in a global world. The Department for Digital, Culture, Media and Sports (‘DCMS’) has asked NERA to look at international policies meant to foster the deployment of Gigabit Next Generation Access Networks (‘NGANs’), specifically Fibre to the Premise (‘FTTP’) and Fifth Generation (‘5G’) networks. This report covers the experiences of six countries with profiles in many aspects similar to the UK: France, Germany, Spain, Sweden, Australia, and New Zealand. In addition to our own research, we have relied on the answers received to a questionnaire we sent to authorities, operators, academics and trade associations from those countries. We examine policies and outcomes associated with different geographies (urban versus rural) and customer segments (residential, business, backhaul), and present findings regarding the types of policies that have proven most effective in these six countries. Specifically, the first three sections examine FTTP developments for residential urban broadband services (section 2), rural broadband services (section 3), and business services, including backhaul (section 4). Section 5 reviews these countries’ 5G strategies and plans. Section 6 presents our conclusions. First, however, the remainder of this introduction presents a brief history of the development of broadband technologies and networks (Section 1.1.) and explains why the deployment of FTTP and 5G technologies presents unique challenges compared with prior technological transitions (Section 1.2). 1.1. Development of Ultrafast Broadband Networks Broadband development has occurred in three consecutive waves of network technology and investment. Mass data communications were introduced in the mid-1990s with the opening of the Internet and the introduction of narrowband fixed and mobile data services over the existing voice networks at speeds below 100 kbps. Broadband services followed in the late 1990s using packet switching network technologies specifically devoted to data communications. These technologies were asymmetric digital subscriber line (‘ADSL’), cable modems, fibre optics, 3G mobile, Wi-Fi, and digital satellite – services with speeds in the range of 200 kbps to 25 Mbps. As user requirements for speed grew, superfast and ultrafast technologies were devised to deliver connectivity at speeds faster than 30 Mbps; technologies called NGANs. NERA Economic Consulting 1
Telecommunications Infrastructure
 International Comparison

                            Figure 2. Evolution of Broadband Networks

NGAN technologies include FTTP, cable modems using DOCSIS 3.0 and 3.1 standards,
very-high-bit-rate digital subscriber line (‘VDSL’) in wired networks, and WiMAX, 4G, and
5G in wireless networks. Of them, FTTP, cable modems, and 5G have the potential to deliver
services at gigabit speeds. VDSL modems using G-Fast technology are also expected to
deliver speeds close to 1 Gbps in the right environment. 1

Different customer segments and diverse geographic settings require unique solutions.
Because of differences in demand, service offerings often are different for individual
consumers as opposed to businesses (especially large corporates) as are the supporting
networks for telecommunications operators (especially mobile backhaul). In addition,
because of strong differences in network economics, solutions in rural areas tend to be
different from in urban ones. Therefore, we separately consider each of those settings.

                      Figure 3. Clusters for Ultrafast Broadband Solutions

1.2.         Policy models

The countries in our sample follow different policies to foster FTTP deployment. We have
summarized them in the following five policy models:

         1
            The International Telecommunications Union (ITU) reports that recent trials of G.Fast have delivered
speeds faster than 1 Gbit/s at distances between 35-70 meters using good quality cabling and vectoring. It quotes
Nokia stating that G.Fast would “eventually support 2Gbit/s or more at 100 meters.” ITU News, ‘New G.fast
trials bring new deployment scenarios of the ITU technology’, March 27, 2017, http://news.itu.int/615-2/

NERA Economic Consulting                                                                                       2
Telecommunications Infrastructure
International Comparison
(1) Unregulated 2 infrastructure competition between private operators. This is the case
of urban areas in Spain and France, where no asymmetric ex ante regulation was imposed.
(2) Regulated infrastructure competition between private operators. This is the case of
Germany, where the incumbent operator’s fibre services are subject to ex ante regulation.
(3) Nominated regional networks with public funding. This is the case of urban areas in
New Zealand, where the government tendered public subsidies to private operators who
committed to deploy wholesale-only FTTP networks in an area on a non-exclusive basis.
(4) State-owned regional networks that compete with other networks. This is the case of
Sweden, where municipalities deployed wholesale-only networks to compete with
incumbent telecommunications and cable operators.
(5) State-owned monopoly national network. This is the case of Australia, where the
government set up a national network operator who acquired all other networks to build a
monopoly.
Because of the different economics and competitive dynamics in urban and rural areas, most
countries have applied different policies in different geographic settings (Figure 4).
Figure 4
Policy models applied to urban and rural areas
The number of case studies available for each model is small. Because of this, we cannot
perform a statistical analysis linking policy model and performance. To overcome this
limitation, we perform a more granular analysis by reviewing the influence on performance
of specific drivers.
2
We use the term “unregulated” in this report to describe operators that had no asymmetric obligations
imposed on their wholesale fibre services, nor were they forced to functional or structural separation of network
and retail activities. They are usually subject to other regulatory obligations, including asymmetric, such as duct
and pole access.
NERA Economic Consulting 3Telecommunications Infrastructure International Comparison 1.3. The Challenge of FTTP and 5G Deployment Deployment of some ultrafast broadband networks technologies occurred mainly through incremental investment in existing networks. For example, broadband cable networks only require the replacement of electronic equipment and some densification of cabinets to upgrade to DOCSIS 3.0. VDSL requires the deployment of active equipment and fibre links to existing street cabinets but reuses the final (and more expensive) drop of the copper local loop. 4G mobile can reuse the base station grid of existing 2G and 3G networks at similar frequency bands; it requires backhaul at higher speeds than 2G and 3G, but there is fibre available in most places and microwave radio links can sustain the backhaul speeds needed. However, FTTP and 5G architectures require a full upgrade of the network. FTTP fibres have to be deployed all the way to customers’ premises, and their much longer loop lengths allow for a significant reduction of central offices. 5G networks have a much denser antennae grid than 4G with backhaul at much higher speeds that in most cases would require a dense fibre network to support 5G backhaul. Therefore, it makes sense to look at FTTP and 5G deployments in a holistic way, that is, to examine the implications of these technologies for the architecture of the entire network. NERA Economic Consulting 4
Telecommunications Infrastructure
 International Comparison

2.            URBAN FTTP DEVELOPMENT
The starting point of the six countries that we surveyed was very similar. All six had well
developed copper networks with universal coverage and populations with high incomes and
high usage of the Internet. Further, they all had potential demand for high-speed Internet, the
financial resources to fund new investments, and their telecommunications operators had the
technical and passive infrastructure resources to deploy fibre networks.

Moreover, all six had competitive telecommunications markets, where the presence of
competing cable networks and unbundled local loop (‘ULL’)-based Internet service providers
could put the incumbents’ legacy ADSL service at risk if those competitors decided to deploy
superior technology. The threat was especially high from cable operators, which after 2006
only needed minor investments to upgrade their networks to DOCSIS 3.0 technologies to
provide ultrafast services at speeds higher than 100 Mbps. 3

A look at structural factors suggests that the countries best placed for massive FTTP
deployment were Sweden, the UK, Australia, and Germany. All four had high income and
Internet usage levels by 2005, when fibre deployments began to be considered by
telecommunications operators.

     Figure 5. GDP/Capita (2005, GBP)                                              Figure 6. Internet Users/100 pop, (2005)
30,000                                                                           100
25,000                                                                             80
20,000
                                                                                   60
15,000
10,000                                                                             40

  5,000                                                                            20
      0                                                                             0
                            France

                                                           New Zealand
                                                                         Spain
              Sweden

                                                 Germany
                       UK

                                     Australia

                                                                                                                             New Zealand

                                                                                                                                           Spain

                                                                                                                                                   France
                                                                                         Sweden

                                                                                                       Germany

                                                                                                                 Australia
                                                                                                  UK

Source: TeleGeography
                                                                                 Source: World Bank

Actual deployment of NGANs followed the expected pattern. As Figure 7 shows, most
countries have achieved almost full coverage by some sort of NGAN. As expected, the UK,
Germany, and Sweden are among the leaders.

However, FTTP deployment was not the universal solution chosen by operators to deploy
NGAN. Incumbent operators in the UK and Germany invested almost exclusively in VDSL
solutions. There are large differences in network deployment between the countries that
chose FTTP as their preferred technology. As regulation and public policies were different in

          3
           See Brady Volpe, DOCSIS 3.0 Tutorial – Downstream Channel Bonding, 18 July 2010.
https://volpefirm.com/downstream-channel-bonding/

NERA Economic Consulting                                                                                                                                    5
Telecommunications Infrastructure
International Comparison
all seven countries, our hypothesis is that differences in regulation heavily influenced
outcomes.
Figure 7. Network Coverage 2016 (% premises)
100%
92.3%
90%
80.0% 80.8% 79.4% 81.8%
80%
70% 64.8% 62.8% 63.0%
60.8%
60%
50% 47.0%
40%
30%
20.8%
20% 15.0%
10% 7.1%
1.8%
0%
New Spain Sweden France Australia Germany UK
Zealand
FTTP All NGA
Source: European Commission, NBN, Australian Bureau of Statistics, MBIE, 5 New Zealand dwelling
4
statistics.
In this section, we analyse the regulation and performance of the six target countries for
urban residential FTTP networks and services. Figure 8 shows their relative performance,
both in terms of network coverage and actual take-up. Three countries show a very good
performance in both dimensions: New Zealand, Spain, and Sweden. On the other side, France,
Australia, and Germany show only incipient fibre development.
Figure 8. FTTP Development 2016 (% households)
70%
64.8% 62.8% 60.8%
60%
50% 45.6%
40%
34.2%
30% 24.8%
20.8%
20% 15.0%
13.9%
10.0%
10% 7.1%
1.8% 1.8% 0.9%
0%
New Spain Sweden France Australia Germany UK
Zealand
Coverage Penetration
Source: European Commission, NBN, Australian Bureau of Statistics, MBIE, 6 New Zealand dwelling
statistics.
4
See European Commission, Broadband Coverage in Europe 2016 - Mapping progress towards the
coverage objectives of the Digital Agenda, https://ec.europa.eu/digital-single-market/en/connectivity
5
See MBIE Broadband Deployment Update.
6
See MBIE Broadband Deployment Update.
NERA Economic Consulting 6Telecommunications Infrastructure
International Comparison
It is interesting to note that the three best performing countries have applied different
regulatory approaches:
(1) Unregulated infrastructure competition between private operators in Spain.
(3) Nominated regional networks with public funding in New Zealand.
(4) State-owned regional networks that compete with other networks in Sweden.
Despite the fact that Spain, Sweden, France, and Germany are member states of the European
Union and are therefore constrained to enforce the European Regulatory Framework for
Electronic Communications, they have adapted it to their national circumstances so that they
have different implementations.
European Union membership imposes an additional constraint to ultrafast broadband policies
in Member States. When setting the targets of their policies, they have to comply at a
minimum with the objectives set in the Digital Agenda policy initiatives. 7 In the time period
between 2005 and 2017 that we analyse, the most important policy in the EU was the
EUROPE 2020 Strategy that set the following targets for ultrafast broadband:
The aim is to deliver sustainable economic and social benefits from a Digital
Single Market based on fast and ultra fast internet and interoperable
applications, with broadband access for all by 2013, access for all to much
higher internet speeds (30 Mbps or above) by 2020, and 50% or more of
European households subscribing to internet connections above 100 Mbps. 8
In the remainder of this section, we analyse in-depth each country and how the regulatory
model has interacted with the country’s market conditions to produce the observable
outcomes.
2.1. Case Study: Spain
Spain has one of the most highly developed FTTP deployments in Europe. It also has a very
high level of network competition, with 58% of households having access to two ultrafast
networks, 9 35% having access to three, and some having access to four networks.
7
See European Commission, Implementation of the EU regulatory framework for electronic
communication, 2015
8
European Commission, EUROPE 2020 A strategy for smart, sustainable and inclusive growth,
Communication from the Commission (Flagship Initiative: “A Digital Agenda for Europe”), COM(2010) 2020,
Brussels, 3.3.2010.
9
In most cases, access consists of FTTP and cable networks and in others two FTTP networks.
NERA Economic Consulting 7Telecommunications Infrastructure
International Comparison
Figure 9. FTTP Coverage in Spain (% households)
62.8%
9.7%
2011 2016
Source: European Commission
2.1.1. Targets
Spanish authorities confirmed their commitment to the EU policy targets of having full
coverage of broadband at a minimum of 10 Mbps by 2017 and of 30 Mbps to all citizens by
2020. 10 In 2014, they set the additional target of all schools, libraries, and health centres to
have connections at 30 Mbps by 2016 and to 100 Mbps by 2020. 11
2.1.2. Regulation and other policy measures
As Telefónica announced its intention to conduct test fibre deployments, alternative
broadband operators asked the regulator (by then, the Comisión del Mercado de las
Telecomunicaciones or CMT) to extend Telefónica’s regulated wholesale access obligations
for copper local loops to its new fibre infrastructure. As the broadband market review was
very recent, CMT issued an interim provision in 2008, thereby placing superfast services
(above 30 Mbps) in the same market as conventional broadband over copper cables. That
way, the access regulation of the copper network was only extended to bitstream services
below 30 Mbps provided over fibre connections, but not to dark fibre or bitstream services
above 30 Mbps. Potential virtual unbundled local access (‘VULA’) obligations for ultrafast
speeds were deferred until the results of the next full market analysis were available.
The regulatory approach adopted in 2008 was based on the following three key regulatory
elements:
(1) regulated Telefónica’s ducts offer (MARCo);
(2) symmetric in-building wiring access obligations applicable to all operators; and
(3) restricted access to traditional access remedies, i.e. bitstream access service on fibre
(NEBA) with speed limitation up to 30 Mbps. 12
An additional point was that the Spanish Building Code mandates that all buildings
constructed after 2000 must have a duct network and collocation space that allows several
10
See Telegeography, GlobalComms Database – Spain.
11
Ibid.
12
See Telegeography, Questionnaire for external experts, Telefónica’s answer regarding Spain.
NERA Economic Consulting 8Telecommunications Infrastructure
International Comparison
telecommunications operators to collocate equipment and blow cables to each flat. 13 As Spain
underwent a construction boom from 2000 to 2008, operators found fibre-ready in-building
ducts in a sizeable portion of the residential buildings. In addition, all licensed
telecommunications operators are entitled to occupy public and private land to deploy their
networks, subject to the general provisions for expropriation because of public interest. 14
As a significant market power (‘SMP’) operator, Telefónica provides a wholesale-regulated
offer for ducts, poles, and cabinets, allowing operators to deploy their own networks by using
infrastructures and ducts from Telefónica in a cost-effective and flexible way.
A 2014 telecommunications law has withdrawn most of the administrative barriers for
network deployment, putting in place a lean procedure for getting the necessary permits from
local authorities and premises’ owners. 15 In addition, since 2016, operators in Spain wanting
to roll out a high-speed telecommunication infrastructure are entitled to use any existing
suitable duct: lighting system, traffic lights, road, railway, port, or airport infrastructures,
etc. 16 However, according to Telefónica, the role of non-telco passive infrastructure has been
marginal for fibre roll out to date. 17
In 2016, the National Regulatory Authority (‘NRA’) finally conducted the broadband access
market analysis. As a result, it deregulated fibre services in competitive areas with three or
more NGANs, which covered 66 cities and 35% of the population. In the rest, it imposed
access obligations on Telefónica’s fibre-to-the-home (‘FTTH’) network. In the most
competitive region (comprising 692 cities, 23% of the population), there was another network
and only VULA was mandated. In areas where Telefónica faced no competition from another
NGA (42% of the country), bitstream access to FTTH was also mandated with no speed cap.
Access regulation of services running on the copper network was maintained. 18
Public funding for NGA deployment in white areas (where no provider of broadband access
services currently is operating) has been a complementary measure that has allowed
deployment earlier than initially planned. However, barely 20% of the NGA footprint has
been partially financed by public funds. 19
2.1.3. Market dynamics and results
FTTP development happened after 2008 in a relatively challenging environment. By that date,
Spain had no meaningful FTTP deployments other than some corporate-focused metropolitan
networks in major cities. Its GDP/capita, population density, and Internet penetration rates
were the lowest of the five largest EU Member States.
Despite its structural disadvantages, Spain could tap into the expertise and financial resources
of three of the largest and most efficient operators worldwide (Telefónica, Vodafone, and
13
See Real Decreto-ley 1/1998, de 27 de febrero, sobre infraestructuras comunes en los edificios para
el acceso a los servicios de telecomunicación, BOE núm. 51, 28 February 1998.
14
See Ley 9/2014, de 9 de mayo, General de Telecomunicaciones, BOE núm. 114, 10 May 2014.
15
Ibid.
16
See Royal Decree 330/2016 of 9 September (a transposition into Spanish Legislation of Directive
2014/61/UE of the European Parliament and the Council of 15 May 2014 on measures to reduce the cost of
deploying high-speed electronic communication networks).
17
See Questionnaire for external experts, Telefónica’s answer regarding Spain
18
See Telegeography, GlobalComms Database – Spain.
19
See Questionnaire for external experts, Telefónica’s answer regarding Spain
NERA Economic Consulting 9Telecommunications Infrastructure
International Comparison
Orange) and a number of Spanish start-ups that had built competitive and efficient broadband
networks (Ono, Jazztel, Euskaltel, R, and Telecable). Forty-eight percent of households
enjoyed infrastructure competition from cable operators (Ono, Euskaltel, R, and Telecable),
most of them in urban areas. 20 There were also strong competitors that used Telefónica’s
copper loop to deliver ADSL, the largest being Orange, Jazztel, and Vodafone.
Figure 10. Industry Structure in Spain 2009
Source: TeleGeography and CNMC
Retail competition has been a clear incentive for NGA rollout, as a way for competitive
differentiation in terms of value proposition to end-clients. xDSL competition was based
exclusively in price competition, whereas NGA competition addresses other aspects of the
offer, such as bandwidth, resilience, service portfolio, and so on. In response to the NERA
survey, Telefonica reported that NGA network rollout has been used as a competitive tool for
operators to gain a competitive differentiation from alternative service providers.
Competitive pressure exerted by both LLU and particularly cable operators
can be considered as one of the key drivers for investment in FTTH in Spain.
Indeed, competition from cable operators has stimulated Telefónica to invest
in NGA in order to provide equivalent services in terms of quality, download
speed, availability of PayTV services that couldn’t be provided on the cooper
legacy network. 21
A smart pricing policy also played an important role:
Telefónica doesn’t apply a premium price for FTHH services, so that the price
of the NGA entry level offer is equal to the equivalent xDSL product. As a
result of it, the upgrade of connections to high speed products has been very
intense. However, this is more due to successful policies in the supply side
than in factors intrinsic to the demand. Moreover, the possibilities offered by
the network development are way above the current demand. Despite having a
penetration of 45% of fibre customers in FBB, there is only 24% with speeds
20
See European Commission, Broadband Coverage in Europe 2016 - Mapping progress towards the
coverage objectives of the Digital Agenda, https://ec.europa.eu/digital-single-market/en/connectivity
21
See Questionnaire for external experts, Telefónica’s answer regarding Spain.
NERA Economic Consulting 10Telecommunications Infrastructure
International Comparison
above 100 Mbps, that is, almost 50% of the fibre customers have speeds of 50
Mbps. 22
Telefonica also asserts that its FTTH deployment, combined with regulated duct access
further enhanced the attractiveness of investment by alternative operators, since it helped to
increase the quality of ducting and duct access processes.
When Telefonica Spain, as the incumbent, began its FTTH deployment, it
industrialised a duct access remedy, clearing, replacing and accurately
mapping the street infrastructure – both for its own benefit and for other users
of the duct infrastructure under a Duct Access remedy imposed by CNMC, the
Spanish regulator. 23
Network deployment also benefited from the consolidation of operators and the launch of
converged offers. Consolidation allowed operators to grow in scale and convergence to
spread the cost of fibre investments across a revenue pool much bigger than pure wholesale
connectivity revenues. Thus, Vodafone acquired cable operator Ono, Orange acquired Jazztel,
Euskaltel bought regional cable operators R and Telecable, and MásMóvil acquired mobile
operator Yoigo, Orange’s legacy fibre assets, and reseller Pepephone.
Another driver of network rollout was the large proportion of the population concentrated in
very dense areas. This allowed operators to start their rollouts in areas with relatively low
deployment costs and to gain experience and increase efficiency. Still, as deployment
expanded into less densely populated areas, the low average density of the country posed
significant challenges.
An additional factor was the cost of installing the final drop to customer premises was
cheaper than in other European countries because of the general availability of ducts to
buildings and favourable regulation of in-building cabling. As Figure 11 shows, the most
expensive way of connecting customer premises (constructing in-building cabling without
pre-existing ducts) affected less than a quarter of the premises connected by Telefónica.
22
Ibid.
23
Ibid.
NERA Economic Consulting 11Telecommunications Infrastructure
International Comparison
Figure 11. In-building cabling technique in Telefónica's FTTP network (%
premises)
Source: interviews with Telefónica executives.
The combination of unregulated fibre services, regulated access to passive infrastructure,
shared access for in-building, cheap building cabling, retail competition, and convergence
resulted in rapid growth in the proportion of households covered by FTTP networks.
Figure 12. FTTP Coverage in Spain (% households)
100%
90%
80%
70%
60%
50%
40%
30%
20%
10%
0%
2011 2012 2013 2014 2015 2016
Source: European Commission
Additionally, one of the outcomes of infrastructure competition is that wholesale commercial
offers are naturally developing in Spain, e.g. Telefónica struck a co-investment agreement
with Jazztel and Orange did the same with Vodafone, Orange provides wholesale service to
MásMóvil, and Telefónica provides commercial wholesale services to Vodafone. 24
24
See Telegeography, GlobalComms Database – Spain.
NERA Economic Consulting 12Telecommunications Infrastructure
International Comparison
Because of those market dynamics, by 2017, four convergent operators competed for most of
the Spanish markets. Market shares of pure fixed retailers (regional cable without mobile and
resellers) have dropped below 10% as shown in Figure 13.
Figure 13. Industry Structure in Spain 2016
Source: TeleGeography and CNMC
Despite changes in regulation and the fact that deployments happen in less dense areas, fibre
rollout continues in Spain. However, it is likely that state aid will play a greater role in the
future than in the recent past.
2.1.4. Conclusions
The key elements behind the success of FTTP in Spain are:
Favourable economics of final drop installation that in the first stage of the process
allowed an efficient start to the rollout, leading to gains in experience and efficiency in
later stages: availability of ducts to the buildings, in-building ducts in many cases, and
relaxed installation standards, as well as a large proportion of the population concentrated
in very dense areas;
Very strong competition from cable operators and local loop unbundlers in earlier stages,
and FTTP operators later on;
Favourable regulatory regime for incumbent deployments; and
Very high take up by customers of convergent offers at high speeds that cannot be
delivered over ADSL.
In subsequent stages, as the deployment expands beyond the dense areas, the low average
density of the country poses significant challenges.
NERA Economic Consulting 13Telecommunications Infrastructure
International Comparison
However, the main operators (Telefónica and Orange) have confirmed their intentions to
continue their deployments so that coverage is expected to rise to 92% by 2020, most of it
under competition by at least two networks. 25
2.2. Case Study: New Zealand
New Zealand has achieved very high coverage of FTTP networks using Public Private
Partnership (‘PPP’) programmes with substantial funding. However, network competition is
limited to a third of the country.
Figure 14. FTTP Coverage in New Zealand (% households)
Source: Statistics New Zealand dwelling statistics and MBIE Broadband Deployment update
Fibre development in New Zealand has been based on the Ultra-Fast Broadband (‘UFB’)
programme. ‘Crown Fibre Holdings’ (CFH) was formed as a Crown-owned company to
manage the Government's investment in Ultra-Fast Broadband infrastructure. CFH completed
its initial task of selecting partners to participate in the UFB initiative in 2011. 26
2.2.1. Targets
The initial goal of the UFB programme was to build an FTTP network that reached 75% of
the population by 2019. The UFB programme was extended in 2017 so that the rollout would
25
See ADSLZONE, ‘The Government wants more fiber and will make it easier for operators’, 9
September 2016. https://www.adslzone.net/2016/09/09/el-gobierno-quiere-mas-fibra-y-se-lo-pondra-mas-facil-
a-los-operadores/.
26
The telecommunications industry has recently sought clarification of the subsequent role of CFH
over the period during which the Ultra-Fast Broadband (UFB) network is being built, and around the setting of
prices on the UFB network.’ (Ministry of Business, Industry & Employment, ‘Policy and Regulation’,
http://www.mbie.govt.nz/info-services/sectors-industries/technology-communications/fast-broadband/policy-
and-regulation. )
NERA Economic Consulting 14Telecommunications Infrastructure
International Comparison
be accelerated by two years and reach 87% of the population by 2022 (the extension is known
as UFB2). 27
2.2.2. Policy measures
The UFB programme was developed in the context of four issues:
(1) economic concerns about New Zealand’s international competitiveness and the global
financial crisis;
(2) confidence in UFB’s potential to transform New Zealand;
(3) scepticism that the private sector would, without government involvement and funding,
undertake the necessary investment itself; and
(4) governmental belt-tightening and the need to ensure public funding was targeted and
designed to secure value for money. 28
The genesis of the UFB programme was competing political proposals for government fibre
investment from the incumbent Labour government and the opposition National party in the
lead up to the 2008 election, which the National party won.
Prior to the 2008 general election, the incumbent Labour government initiated a grant
programme known as the Broadband Investment Fund (‘BIF’). This programme was to
provide operational grants (totalling $325 million dollars over five years) and was aimed at
‘facilitating high speed connections to businesses and key public users in urban centres
through the deployment and wholesaling of open access passive broadband infrastructure’. 29
The opposition National party campaigned on a promise of direct investment by the
government in partnership with the private sector that would result in FTTP to 75% of the
population over a 10-year period. The Labour proposal therefore was more targeted to high-
value users (businesses/schools), whereas the National proposal was much broader in its
scope. As the National party won the 2008 election, no grants were paid under the BIF, and
the UFB proposal was more fully designed and implemented. The UFB programme is in
effect a Public-Private Partnership (‘PPP’), whereby the government co-invests (up to 1.35b
NZD for UFB1) with private partners (the ‘Partners’) in companies called ‘Local Fibre
Companies’ (‘LFC’) to build and operate an open-access wholesale-only FTTP network in a
designated area. The country was divided in several regions, and separate tenders were held
to select a partner for the LFC in each region.
LFCs are prohibited from providing retail services. Therefore, to participate in the UFB
programme, the former vertically integrated Telecom New Zealand voluntarily demerged into
a wholesale-fixed-network business (Chorus) and a retail-fixed-line business that also owns a
mobile network (Spark). The other partners are electricity companies (Northpower and WNL)
and an existing broadband network owned by the Christchurch City Council.
27
See Crown Infrastructure Partners, ‘Ultra Fast Broadband Extension (UFB2)’, 30 August 2017,
https://www.crowninfrastructure.govt.nz/ufb-initiative/ultra-fast-broadband-extension/.
28
See M. Webb, M. Toner, and J. Cox, ‘Taking the initiative: lessons from New Zealand’s experience
with the ultra-fast broadband initiative’, Int. J. Technology Policy and Law, Vol. 1, No. 4, 2014, pp. 317–334.
29
See MED (2008), Broadband Investment Fund: Draft Criteria and Proposed Process for
Consultation.
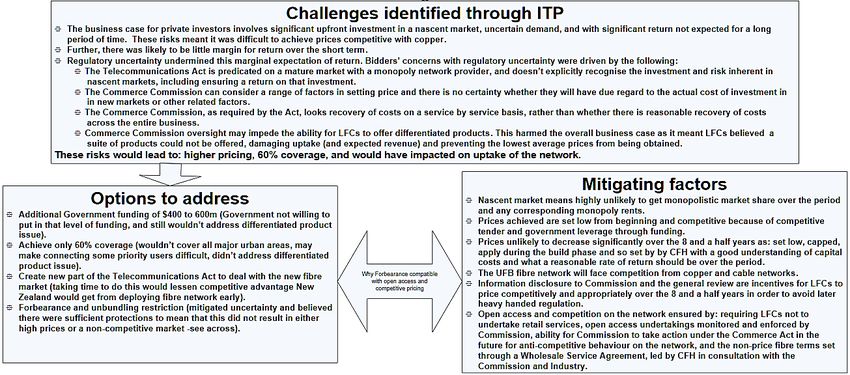
NERA Economic Consulting 15Telecommunications Infrastructure International Comparison Specific funding mechanisms for the government’s investment vary for each of the LFCs. The general rule is that Crown Fibre Holdings (‘CFH’) is to fund the cost of ‘passing’ the premise, and the Partner is to fund the costs of ‘connecting’ the premise, i.e. the connection from the premise to the fibre in the street as each customer hooks up. Each time a LFC other than Chorus connects a premise, the LFC pays back CFH the cost of passing that premise. This means that the other LFCs do not bear much demand risk and that CFH effectively gets its capital returned each time a premise connects, allowing that money to be ‘recycled’. A different arrangement was concluded with Chorus, by which CFH acquired a stake in Chorus’ capital. Since they are wholesale-only companies LFCs and Chorus sell wholesale services to retail service providers (‘RSPs’) that in turn sell services to final customers. The wholesale prices LFCs/Chorus can charge RSPs are set by the contract between each LFC and CFH. These prices apply across each entire UFB area (i.e. are geographically averaged). The products included in the contract with CFH are an entry level 30 Mbps and an advanced 100 Mbps bitstream product. Fibre operators are free to offer other commercial products in addition to those products. 2.2.3. Regulation Prior to the introduction of UFB, Chorus (then the vertically integrated Telecom New Zealand) was required to provide both ULL and bitstream access to its copper network on regulated prices set by reference to total service long-run incremental cost (‘TSLRIC’). Regarding UFB, it is in some ways a form of regulation by contract, as the wholesale access prices are set via a contract between the LFCs and the Government. During the initial negotiations for the UFB contracts, the government did not receive satisfactory bids (only 60% coverage would have been achieved, rather than the targeted 75%). This was largely due to perceived regulatory uncertainty, as set out in the diagram below from the Ministry of Business, Innovation & Employment (‘MBIE’) advice to the Government. NERA Economic Consulting 16
Telecommunications Infrastructure
 International Comparison

             Figure 15. Challenges to FTTP deployment identified in New Zealand

Source: MBIE 30

The initial government proposal for regulatory forbearance (i.e. preventing the UFB network
from having regulation applied to it during the initial contract term) was controversial and
eventually abandoned. It was replaced with a contractual compensation mechanism, whereby
the Government would compensate the LFCs if regulation was introduced that reduced prices
below the contractual cap. 31 Dark fibre unbundling was deferred until 2020. The combined
effect of these two measures reduced the risk to LFCs, and the Government received
satisfactory bids in subsequent negotiations. While this provided certainty for the initial term
of the contract through to 2020, after that point, pricing and the regulatory regime are
uncertain.

MBIE has recently completed its consultation on what the ‘Post 2020’ regime will be. For
Chorus, its fibre assets will transition to a hybrid building blocks regulatory model with an
overall revenue cap and price-capped anchor products. 32 The copper network will be
deregulated inside UFB areas and remain regulated outside UFB areas. 33 This is summarised
in the diagram below from MBIE’s decisions paper.

        30
             See 49SCFE-ADV-00DBHOH-BILL 10470-1-A181779, https://www.parliament.nz/resource/en-
NZ/49SCFE_ADV_00DBHOH_BILL10470_1_A181779/95cfc977b071b536e9e094728040600bf73c7eed.
          31
             See Beehive.gov.nz, ‘Regulatory forbearance to be replaced’, 18 May 2011,
https://beehive.govt.nz/release/regulatory-forbearance-be-replaced.
          32
             The other LFCs will only be subject to information disclosure regulation.
          33
             See Ministry of Business, Innovation & Employment, ‘Final decisions (June 2017)’,
http://www.mbie.govt.nz/info-services/sectors-industries/technology-
communications/communications/regulating-the-telecommunications-sector/review-of-the-telecommunications-
act-2001/final-decisions-june-2017.

NERA Economic Consulting                                                                             17
You can also read