EQUITY WATCH - Zimbabwe Assessing Progress towards Equity in Health - Equinet Africa
←
→
Page content transcription
If your browser does not render page correctly, please read the page content below
EQUITY
2014
   WATCH

   Assessing Progress towards Equity in Health
                    Zimbabwe
   Training and Research
   Support Centre

   Ministry of Health
   and Child Care
                                                       E
               in the Regional Network for Equity in    Q
                                                         U
                  Health in East and Southern Africa         I
                                                              N
                                          (EQUINET)            E
                                                                   T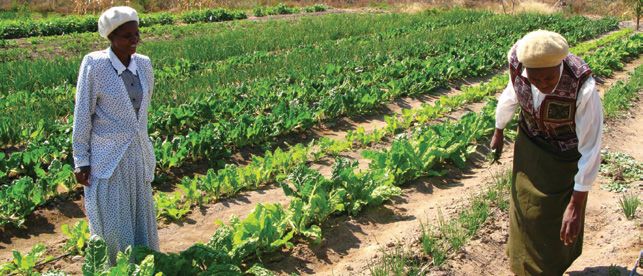
Map of Zimbabwe showing provinces
     N
                                                                           Mozambique
                                                   zi river
                                             Zambe
                   Zambia            a
                                 arib                                  Mashonaland
                               eK                Mashonaland
                            Lak                                          Central
                                                    West

                                                                                t
                                                              Harare

                                                                             Eas
                                                                             nd
                                                                        n ala
                    Matabeleland

                                                                     sho
                                                                   Ma
                       North                           Midlands
                                                                             Manicaland
                                    Bulawayo

                                        Matabeleland                    Masvingo
                                           South
         Botswana

   0 45 90        180 kms                        South Africa

Source: Zimstat, UNICEF 2009

Produced by Training and Research Support Centre and Ministry of Health and Child Care, Zimbabwe, in
the Regional Network for Equity in Health in East and Southern Africa (EQUINET).

Authors: Rene Loewenson, Marie Masotya TARSC
Gibson Mhlanga, Portia Manangazira MoHCC

With gratitude for peer review by Dr D Dhlakama and Dr L Mbengeranwa, Zimbabwe

Cover photo: © F Machingura 2011, Zimbabwe.
Photos on inside pages under creative commons license or used with permission
and credited to photographers as shown.
Editorial and layout work by TARSC and Blue Apple Projects.
Funding support from Liverpool School of Tropical Medicine in the Rebuild project is
gratefully acknowledged

Training and Research Support Centre (www.tarsc.org) and EQUINET
Box CY2720, Causeway, Harare, Zimbabwe
admin@equinetafrica.org; www.equinetafrica.org;

Ministry of Health and Child Care
P O Box CY1122. Causeway, Harare, Zimbabwe
www.mohcc.gov.zw

Cite as: Training and Research Support Centre and Ministry of Health and Child Care, Zimbabwe (2014)
Zimbabwe Equity Watch 2014, TARSC, MoHCC, EQUINET Harare

© TARSC, MoHCC, EQUINET, 2014
ISBN : 978-0-7974-6288-5
The Zimbabwe National Health Strategy (2009-2015) raised universality, equity and quality as central

Foreword   principles. Whilst the Zimbabwe Constitution for the first time guarantees the right to health care, the
           government of Zimbabwe has had a consistent commitment to health equity since 1980.

           An Equity Watch is a country report that monitors progress in health equity, more specifically, the health
           system’s progress and responsiveness in promoting and achieving equity in health and healthcare. The
           Equity Watch framework was developed by EQUINET and implements a resolution of the East, Central
           and Southern African Health Community to monitor progress in health equity. lt assesses progress
           against commitments and goals in four major areas, namely: equity in health, household access to the
           resources for health, equitable health systems and global justice.

           It is with pleasure that the Ministry of Health and Child Care presents the third Equity Watch report for
           Zimbabwe. This report updates the 2008 and 2011 Zimbabwe Equity Watch. We are happy that we are
           now able to release this third report to track the changes between 2011 and 2014.

           Prior Equity Watch reports highlighted the need for investments in primary health care. This was meant
           to revitalise the health system closer to communities, to close gaps in access to services, to engage
           all sectors to address the causes of ill health, and to strengthen domestic health financing and co-
           ordination of all actors for universal health coverage. lt is positive, therefore, that this 2014 Equity
           Watch indicates progress by Zimbabwe on many fronts including the inclusion of the right to health
           care and to health determinants in the 20’13 Constitution; in the fall in overall inequality and closing of
           gaps in wealth between rural and urban areas; in sustained high primary enrolment and gender parity
           in education; (in line with Millennium Development Goal (MDG) targets ); in widening access to land;
           overall improvements in child survival and nutrition, HIV prevalence, immunisation coverage, maternal
           health, HlV, sexual and reproductive health service coverage; with a fall in inequalities for services such as
           immunisation and antenatal care that are closer to reaching universal levels. The improvements in health
           services came from our investments over the years in such areas as , education, health infrastructure
           and in human resources for health. lt has also come from our efforts to improve medicines availability as
           well as personnel retention at primary care and district level, supported by various innovative financing
           mechanisms such as the Health Transition Fund, performance based financing among others.

           However we know that there are still many challenges to address unfair disparities in health and access
           to care. Our infant and child mortality rates are far from MDG targets, especially for poorer households.
           There are also still wide gaps between current levels of child malnutrition and maternal mortality in
           relation to our MDG targets. There are persistent disparities by wealth and mother’s education in
           the uptake of many services; and chronic conditions present a rising challenge. Our level of domestic
           health financing from government has fallen below the Abuja commitment and below the percapita levels
           recommended by WHO and is inadequate to finance the attainment of our health related MDG targets,
           as well as being below the level needed to finance the essential health benefit which has been identified
           by Ministry of Health and Child Care. The resource limitations have also limited our ability to reach and
           widen coverage for underserved groups or to provide new services or act early to prevent and manage
           chronic conditions.

           As many of the determinants of improved health equity lie outside the health sector, this report
           raises areas where we seek to advance ‘health in all policies’, to address ‘the causes of the causes’ or
           underlying determinants of poor health outcomes, such as improving gender equity in employment and
           income security, controlling the marketing of unhealthy products, encouraging nutritious weaning foods,
           rehabilitation of public urban water supplies and promotion of the one household one toilet campaign
           in all areas. We hope this report will inform and stimulate discussion across a range of sectors, including
           with development partners, civil society and the legislature on the specific measures we can each take
           to implement our stated policy commitment to improve equity in health.

           Dr P.D. Parirenyatwa
           Minister of Health and Child Care
           Zimbabwe
           April 2015

                                                          i
ii
An Equity Watch gathers, organises, analyses and reports evidence on the progress being made in

About the Equity Watch   advancing equity in health. Equity Watch work is being implemented in countries in East and Southern
                         Africa in line with national and regional policy commitments. In February 2010 the Regional Health
                         Ministers Conference of the East, Central and Southern African Health Community (ECSA¬HC)
                         resolved that countries “Report on evidence on health equity and progress in addressing inequalities in
                         health”.

                         Using available secondary data, the Equity Watch is implemented by country personnel with support
                         and input from EQUINET. It aims to assess the status and trends in a range of priority areas of health
                         equity and to check progress on measures that promote health equity against commitments and goals.

                         Equity Watch reports were produced in Zimbabwe in 2008 and 2011, using a framework developed
                         by EQUINET in cooperation with the ECSA–HC and in consultation with WHO and UNICEF. This
                         2014 Zimbabwe Equity Watch updates the evidence using in the same framework, and including areas
                         identified by stakeholders in Zimbabwe as important for achieving equity in Universal Health Coverage
                         (UHC). The report introduces the context and provides evidence on selected parameters of: equity
                         in health, household access to the resources for health, equitable health systems and global justice. It
                         shows past levels (1980–2008), current levels (most current data publicly available for the past 5 years,
                         2009-2014) and comments on the level of progress made towards health equity. It provides a coloured
                         bar indicating what the situation is, and whether broadly:

                                 Improving 		               Static, mixed or uncertain		        Worsening

                         It uses mixed yellow-green and yellow-red colours where the findings are mixed, but with overall signs
                         of progress or decline respectively.

                         We explore the distribution of health, ill health and particular determinants, including those relating to
                         employment, income, housing, water and sanitation, nutrition and food security, and those within the
                         health system. The Equity Watch examines the fairness of resource generation and allocation, and the
                         benefits derived from consuming the resources for health. The 2014 Equity Watch includes available
                         evidence on the private for profit sector in health. We also explore the governance of the health
                         system, given that the distribution and exercise of power affects how resources are distributed and
                         strategies designed and applied towards ensuring access to the resources for health. This 2014 Equity
                         Watch shows the progress made in achieving equity in the health Millennium Development Goals and in
                         achieving goals of equity in a universal health system.

                                                                     iii
Foreword................................................................................................................................................................ i
Contents   About the Equity Watch.............................................................................................................................iii
           Key messages.......................................................................................................................................................1
           Introduction..........................................................................................................................................................3
           Household access to the national resources for health..............................................................5
                Achieving the Millennium Development Goal of reducing by half the number of people in poverty........... 6
                Reducing the Gini coefficient to at least 0.4................................................................................................................ 9
                Increasing ratio of wages to Gross Domestic Product...........................................................................................10
                Achieving and closing gender differentials in attainment of universal primary and
                secondary education......................................................................................................................................................... 11
                Achieving the MDG goal of halving the proportion of people with no sustainable
                access to safe drinking water by 2015.......................................................................................................................... 14
                Allocating at least 10% of budget resources to agriculture, particularly for smallholder
                and women producers..................................................................................................................................................... 17

           Advancing equity in health........................................................................................................................19
                Formal recognition and social expression of equity and universal rights to health.........................................20
                Eliminating differentials in maternal mortality, child mortality (neonatal, infant and under five)
                 and child under-nutrition............................................................................................................................................... 21
                Eliminating income and urban/rural differentials in immunisation, antenatal care, attendance
                by skilled personnel at birth...........................................................................................................................................25
                Achieving UN and WHO goals of universal access to antiretrovirals, condoms and prevention
                of vertical transmission....................................................................................................................................................30
                Detecting, preventing and managing chronic conditions........................................................................................33

           Resourcing redistributive health systems.........................................................................................35
                Achieving the Abuja commitment of 15% government spending .........................................................................36
                on health..............................................................................................................................................................................36
                Achieving US$60 per capita public sector health expenditure.............................................................................37
                Establishing and ensuring a clear set of comprehensive health care entitlements for the population.......38
                Increasing progressive tax funding to health and reducing out of pocket financing in health.......................39
                Abolishing user fees from health systems backed up by measures to resource services..............................41
                Harmonising the various health financing schemes into one framework for universal coverage................44
                Allocating at least 50 per cent of government spending on health to district health systems
                and 25 per cent to primary health care......................................................................................................................45
                Adequate provision of health workers and of vital and essential medicines in primary
                and district level services................................................................................................................................................46
                Implementing a mix of non–financial incentives for health workers...................................................................50
                Formal recognition of and support for mechanisms for direct public participation in all levels
                of health systems .............................................................................................................................................................. 51
                Overcoming the barriers that disadvantaged communities face in access and utilisation of
                essential health services..................................................................................................................................................52

           A more just return from the global economy..............................................................................55
                Reducing debt as a burden on health...........................................................................................................................56
                Ensuring health goals in trade agreements.................................................................................................................57
                Bilateral and multilateral agreements to fund health worker training and retention.....................................58
                Health officials included in trade negotiations .........................................................................................................59

           Bibliography.......................................................................................................................................................60

                                                                                          iv
This report continues the work done in the 2008 and 2011 Zimbabwe Equity Watch reports to review

Key messages   progress in delivering on policy commitments to promote health equity.

               Progress has been made in improving equity in a number of areas, in:

               •   The inclusion of the right to health care and to health determinants in the 2013 Constitution.
               •   A fall in overall inequality and closing of gaps in wealth between rural and urban areas.
               •   High primary enrolment and gender parity in education, in line with Millennium Development Goal
                   (MDG) targets, and
               •   Widening access to land and food availability.
               There have been overall improvements in child survival and nutrition, more recently in maternal mortality;
               a significant reduction in HIV prevalence, and improved immunisation coverage, maternal health, HIV
               and sexual and reproductive health (SRH) service coverage, with a fall in inequalities for services such as
               immunisation and antenatal care (ANC) that are closer to reaching universal levels.
               However the levels of under five and infant mortality rates are far from MDG targets, especially for poorer
               households and after infancy. There are still wide gaps between current levels of child malnutrition and
               maternal mortality compared to MDG targets. There are persistent disparities by wealth and mothers
               education in the uptake of SRH and HIV prevention and treatment services; and chronic conditions
               (NCDs), present a rising and still relatively unmanaged health challenge.
               Inequalities in health arise largely due to social inequalities in the factors that affect health. There are
               widening inequalities in wealth within urban and rural areas, with increased urban poverty, and with a more
               recent growth in rural wealth without a decline in rural poverty. There is persistent gender inequality.
               Social inequality reflects insecurity of incomes, food poverty in urban areas and gender and wealth
               inequalities in rural agriculture, contributed to by increased reliance on commercial food markets and
               rising food prices. Cost barriers to enrolment exist in entry to education, in early childhood development
               (ECD), and in completing secondary schooling, both of which have implications for improved health.
               Shortfalls in the provision of functional improved water and sanitation are associated with outbreaks and
               high prevalence of preventable disease.

               Within health services, improvements in coverage and equity have been contributed to by:

               •   The presence of a literate population, an active health civil society and revival of the village health
                   worker programme to support health promotion and service uptake.
               •   Significant improvements in medicine availability at primary care and district level, and in the training
                   and retention of nurses, doctors and pharmacy personnel in public services.
               •   Support for HIV and AIDS and for malaria and TB control services, including through an earmarked
                   tax (the AIDS Levy).
               •   Removal or reduction of fees in public and not for profit services for pregnant women and children,
                   with evidence of a reduction in cost burdens to households.
               •   Information and service investments implemented in the results based financing programme
                   contributing to capacities for improved use of funds.
               •   Pooling of external funding in the Health Transition Fund with spending aligned to national goals.
               •   Updating and costing the health care entitlements at primary care and district level, and
               •   International partnerships and negotiations to support health services.
               There are challenges to sustain these gains and to address disparities in health and access to care.
               Most importantly, domestic health financing has fallen below the Abuja commitment and below per
               capita levels set in WHO guidance. Domestic health financing is inadequate to meet the core package
               of services for the health MDGs and below the level needed for the essential health benefit identified
               by Ministry of Health and Child Care. This has made the country highly dependent on external funding
               for key areas of health delivery, particularly for essential medicines and supplies, and for health worker
               retention incentives for the primary health care and district health services that are critical for the
               low income majority. Inadequate financing has been associated with low levels of investment in, and
               inadequacy of, personnel for preventive services, including to prevent the escalation of future costs of
               NCDs, by acting early to prevent them.

                                                             1
The evidence points to other challenges: In the public sector there are gaps in deployment of personnel
to districts with higher levels of poverty; in supplies for chronic conditions and in emergency supplies,
transport and services. There is weak monitoring and social accountability, and weak regulation of cost
escalation, inefficiencies, segmentation and barriers to financial protection in the private health sector.

Closing gaps in coverage and outcomes calls for strengthened investment in PHC, including to:

•   Strengthen nutrition interventions, supporting community health workers to encourage exclusive
    breastfeeding, nutritious weaning foods and uptake of growth monitoring to identify and link children
    in vulnerable urban and rural situations with health and other support.
•   Sustain the availability of medicines and personnel in primary care services.
•   Intervene from adolescence onwards in improving continuity in access to SRH and maternal health
    services, encouraging earlier more frequent uptake of antenatal care on the one hand, and improved
    referral for complications in rural areas and lower income households on the other.
•   Formalise Health Centre Committee (HCC) roles at system level, widen health literacy, support
    VHWs and strengthen public involvement and accountability measures in the private health sector.
•   Improve tools for harmonised budgeting, planning, reporting and purchasing arrangements across
    the various public and external funds.
Universal systems are built over years, organised around a shared vision of a national unified health
system and with deepening social and state awareness, advocacy and capacities to progressively
implement Constitutional rights and pro-equity health policies that are relevant for the next decade.
The evidence indicates that mobilising new domestic resources will be a key and critical task, for health
promotion, detection and management of NCDs, to ensure supplies and personnel at primary care and
district services, and to support outreach for continuity of care, including through schools, communities
and workplaces.

Sustaining and widening efforts to achieve universal coverage of key services based on delivery of universal
entitlements will need to be funded through mandatory pre-payment financing, such as by taking forward
the policy proposals in Zimbabwe Agenda for Sustainable Socio-Economic Transformation (ZimAsset)
to improve progressive tax funding, including from earmarking VAT and excise taxes, with measures to
ensure equity, efficiency, transparency and accountability in their management. Needs based resource
allocation would need to apply to new resources, so that no district receives reduced funds. Measures
need to be applied to strengthen monitoring of service gaps and to build capacities to absorb and use
funds effectively. A dialogue with the private health sector to co-ordinate a partnership aligned with
national goals will need to be based on better information and public domain reporting, including on
costs and performance.

As many of the determinants of improved health equity lie outside the health sector, improving health
equity also depends on intersectoral processes that advance ‘health in all policies’, to address ‘the causes
of the causes’ or underlying determinants of poor health outcomes, including:

•   Identifying specific measures and targets for improving employment and income security, for
    supporting food production and markets and for addressing gender equality in access to land, credit
    and inputs for food production and for encouraging nutritious weaning foods;
•   Exploring options for ensuring ECD enrolment in low income households;
•   Improving quality of, enrolment in and completion of secondary school and supporting costs for the
    poorest children.
•   Investing in rehabilitation of public urban water supplies and active promotion of improved sanitation
    with a one household one toilet campaign in all areas.
•   Identifying risks and implementing measures to raise social awareness and reduce exposure to
    risk factors causing chronic diseases, through environmental measures, road traffic systems and
    regulation of marketing of unhealthy food, tobacco and alcohol, and
•   Pooled medicine procurement and tariff measures aligned to policy support for local medicine
    production, including reduced import costs of inputs for local pharmaceutical production.

                                             2
Introduction
                   EQUITY
                   WATCH
               Z
                       imbabwe has various assets for health and human development, including a highly literate
                       population and significant natural, mineral and agricultural resources. It is believed to hold 25%
                       of the world’s reserves of opencast extractable diamonds with significant potential contribution
               to the country’s economy (Jamasmie 2014). The country benefited from a fall in adult HIV prevalence
               after 2002, and a low average population growth rate of 1.1% since 2002 (ZIMSTAT 2013; ZIMSTAT and
               ICF International 2012). The urban: rural ratio has remained relatively stable between 2002 and 2012
               with one-third of the population residing in urban areas, contrary to trends of rising urbanisation in many
               other countries (ZIMSTAT 2013).

               There have been many challenges in the past decade. These include a falling Gross Domestic Product
               (GDP), hyperinflation, rising debt and falling exports between 1999 and 2008 (ZIMSTAT UNICEF 2009;
               IMF 2014). Land reform post 2000 led to the transfer of around 8 million hectares of land across 4
               500 farms to over 160,000 households, thus raising opportunities for more equitable economic benefit
               from land and challenges to support production in newly settled farms (Scoones et al. 2010). After
               high levels of political contestation, a 2009 ‘inclusive government’ was set up under a Global Political
               Agreement. The adoption of a multicurrency regime was followed by a period of economic recovery,
               with a real annual GDP growth of 4.4% in 2012, improved manufacturing sector output, a rising supply
               of goods and services and a contraction in the debt to export ratio (ZEPARU et al. 2013; IMF 2014).
               The national average household income in April 2013 of US$95 was 12% higher than the same period in
               2012 (ZIMVAC 2013). In March 2013 the country adopted a new constitution that included the rights to
               health care and health determinants, discussed later.

               Elections in July 2013 resulted in a ZANU-PF led government, and the launch in October 2013 of
               the Zimbabwe Agenda for Sustainable Socio-Economic Transformation (ZimAsset). ZimAsset set short
               term interventions to December 2015 and longer term measures to December 2018 within clusters
               of food security and nutrition; social services and poverty eradication; infrastructure and utilities and
               value addition and beneficiation (GoZ 2013). At the same time economic improvements have slowed
               down, with GDP growth estimated at 2.9% in 2013, 3.1% in 2014 and 1% growth forecast in 2015, lower
               than African averages (ZEPARU et al. 2013, GoZ 2014b, World Bank 2014b). The revenue collection
               from key economic activities has been lower than expected, with mining company dividends dropping
               from US$174 million in 2010 to US$ 45 million in 2012 and zero in 2013 (Sibanda and Makore 2013). The
               Zimbabwe Revenue Authority (ZIMRA) reported a revenue much lower than expected from diamond
               production (Mzumara 2014).

               Zimbabwe’s Human Development Index (HDI) fell between 1990 and 2008, at a time when the Sub-
               Saharan African HDI rose (UNDP 2011). It rose after 2009 to 1980 levels and to 0.492 in 2013 (UNDP
               2014). The trends reflect the fall in life expectancy in the 1990s due to AIDS, improving after 2005;
               rising education completion to 2005, plateauing thereafter and falling incomes to 2008, with a small rise
               thereafter. The aggregate HDI masks inequality in the distribution of human development across the
               population. The inequality adjusted HDI for Zimbabwe at 0.358 is 27% lower than the overall HDI, due
               to inequality in the indices that make up the HDI. While this 27% downward adjustment for inequality is
               lower than the sub-Saharan average of 35%, it does point to the extent to which inequality affects human
               development in Zimbabwe.

                                                            3
This report explores this further, in terms of the distribution of health, of both challenges and benefit in
key determinants of health, and in access to health care services.

Figure 1 Human Development indicator trends, 1980-2012 Zimbabwe

0.8

0.7

0.6                                                                                                      HDI - Education
                                                                                                         HDI - Health
0.5

0.4                                                                                                      HDI - All

0.3
                                                                                                         HDI - Income
0.2

0.1

  0
        1980       1990       2000         2005   2006       2007   2008   2009   2010   2011    2012

Source: Authors from data in UNDP (2014)

                                                                                                © F Machingura, Zimbabwe

                                                         4
EQUITY
WAT C H
© UNICEF Zimbabwe
Household access
to the national
resources for health
The unequal distribution of diseases and survival in Zimbabwe’s population can, in most cases,
be explained by the extent to which people, households and social groups are accessing the
resources to be healthy. These include resources such as food, water, sanitation, shelter,
decent work and incomes. Education has been called a social vaccine. In 2011 and 2014,
intersectoral meetings pointed to these social determinants, giving immediate priority
to access to water and sanitation and to regulation of goods and services that may be
harmful to health such as tobacco, alcohol and unhealthy foods (MoHCW and WHO 2011,
MoHCC and WHO 2014). For the health services and for households, it does not make
sense to treat people for preventable diseases and send them back to the conditions that
made them ill. This section explores what progress there has been towards ensuring that
households access these key resources for health.
5Achieving the Millennium Development Goal of reducing by half
the number of people in poverty
PAST LEVELS CURRENT LEVEL
INDICATOR (1980–2008) (2009-2014)
Level Year Level Year
% population living on less than US$1 a day (PPP) 56.0 1990-2008 n.a
% population living under the food poverty line 29 1995 32.7 2011/12
58 2003
% population living under the total consumption 55 1995 76.7 2011/12
poverty line (TCPL) 72 2003
Rural: urban ratio for share below the TCPL 1:1.16 2003 1:0.77 2011/12
Multidimensional poverty index 25.0 2000-2008 17.2 2011/2
18.0 2006
Human Poverty Index 40.3 2005 39.0 2009
Wealth quintiles Rural 29.3 2005 28.8 2011/12
% in lowest quintile 29.1 2009
% in highest quintile 1.2 2005 5.1 2011/12
1.4 2009
Urban
% in lowest quintile 0.0 2005 0.0 2011/12
0.5 2009
% in highest quintile 60.5 2005 53.9 2011/12
59.9 2009
Source: CSO Macro Int 2007; MoPSLSW 2006; GoZ UNICEF 2007, 2010; UNDP 2008, 2011; ZIMSTAT and ICF International 2012, ZIMSTAT 2013; GoZ and UNDP 2012; OPHI 2013
PPP=purchasing power parity; The total consumption poverty line is the minimum expenditure needed to buy a basic basket of items for subsistence. Food poverty
is the income required to sustain a basket of essential foods to meet the minimum recommended family caloric intake.
Past levels: 1980-2008
• Poverty increased between 1995 and 2003,
both in terms of the food poverty line (FPL) and
the total consumption poverty line (TCPL) (see
summary table). Total consumption poverty
was higher in urban than in rural households
and in female than male-headed households
(MPSLSW 2006). State forms of public
assistance to deal with vulnerability all suffered
limited funding, declining coverage and poor
targeting of beneficiaries in the early 2000s
(UNDP Zimbabwe 2008). Many households
relied on remittances from family members
outside the country or in formal employment
to support food, school fee and health care
costs in 2000-2008 (UNDP Zimbabwe 2008).
© SuSanA, 2011
6Current level: 2009-2014
• The summary table indicates that the share of people below food poverty line (FPL) fell between 2003
and 2011/2, while the share of people under the total consumption poverty line (TCPL) rose. The
Multidimensional poverty index fell marginally from 2006 to 2011. The 2011/2012 Poverty Assessment
provides the most recent household survey on poverty (ZIMSTAT 2013b). It found that while the share
of rural people in the poorest quintile (fifth of the population) was constant 2009-2011, the share in the
wealthiest quintile, with wealth based on their assets, grew by 4%, possibly as a result of new ownership
from the land reform programme. While there were more wealthy people in rural areas, this was without
a significant change to existing poor people. While no urban households were in the poorest quintile,
the urban share in the wealthiest quintile fell by 6 percent points. The evidence suggests a shift in the
relative distribution of household wealth from urban to rural areas. Total consumption poverty is also
higher in urban areas, where dependency on commercial markets is higher, including for food (See Table 1)
(ZIMSTAT 2013b). The data confirms concerns raised in the 2011 Equity Watch about rising urban poverty.
It adds a new dimension of rising rural wealth and rural inequality.
• The distribution of poverty by province is shown in Table 1. The 2011/2 poverty assessment found that 77%
of employed people earn less than $351 monthly, with earnings in men higher than in women (ZIMSTAT
2013b). According to community monitoring reports, the share of employment in the informal sector
has grown since 2008, with a larger share of female headed households dependent on employment with
insecure incomes, such as vending and trading (CMP 2012).
Table 1: Share of people living under the food poverty line by province, 2011/2
Province Food poverty by residence Total consumption poverty line
Urban Rural Total Urban Rural Total
Manicaland 31.2 31.6 31.4 81.3 62.2 71.7
Mashonaland Central 32.0 31.5 31.8 83.3 62.0 72.7
Mashonaland East 31.9 31.8 31.9 83.2 62.6 72.9
Mashonaland West 32.2 33.9 33.0 83.9 66.7 75.3
Matabeleland North 35.5 36.6 36.1 92.6 72.0 82.3
Matabeleland South 35.6 35.9 35.7 92.6 70.5 80.6
Midlands 31.9 32.9 32.0 83.0 63.3 73.2
Masvingo 32.1 32.0 32.0 83.6 62.9 73.2
Bulawayo 32.0 - 32.0 83.3 - 83.3
Harare 31.5 - 31.5 82.0 - 82.0
National 32.6 33.2 32.7 84.9 65.3 76.7
Source: ZIMSTAT, 2013b
7• Food poverty was highest in the two Matabeleland provinces, where food cultivation is lower, although
not by a significant amount. The 2013 Zimbabwe Vulnerability Assessment (ZIMVAC) found that food
insecurity increased in all provinces in 2013/4 except for Mashonaland West (Figure 2), projecting that 89%
of households would not be able to meet food needs from their own production in 2013/4 (ZIMVAC 2013).
Food poverty is not related to a province’s potential for food production, possibly as provinces with better
farming potential are growing more non-food crops. Small farmers are reportedly moving into cash crops
such as tobacco, reducing production of maize (WFP and Vam 2014).
Figure 2: Household food insecurity – percent households food insecure by province 2012 and 2014
45
40
2012/3
35
30 2013/4
25
Percent
20
15
10
5
0
Manicaland
Matabeleland
South
Midlands
National
Mashonaland
Central
Mashonaland
East
Mashonaland
West
Masvingo
Matabeleland
North
Source: ZIMVAC 2013
© UNICEF Zimbabwe
The MDG target of halving the proportion of people whose income is less than the TCPL has not yet been
Progress
achieved. Increased rural wealth without a reduction in the share of the poorest households coming from rural
areas is associated with rising inequality within rural areas. Poverty and insecurity of incomes have also grown
in urban areas. Socio-economic inequalities between urban and rural areas have been a key focus for health
and social policy post independence. The evidence suggests that inequality within both urban and rural areas is
becoming more significant, calling for measures that reach disadvantaged groups within both urban and rural
areas. Food poverty has become more strongly influenced by availability and prices of food in commercial
markets, including in rural areas.
8Reducing the Gini coefficient to at least 0.4
PAST LEVELS CURRENT LEVEL
INDICATOR (1980–2005) (2009-2014)
Level Year Level Year
Gini coefficient 0.59 1995/6 0.39 2010/11
0.57-0.61 2003
0.50 2005
0.51 2007
Highest : lowest province Na 7.4:1(i) 2010/11
Urban: Rural Na 1: 4.4 2010/11
Wealth quintiles
Rural % in lowest quintile 29.3 2005 28.8 2011/12
29.1 2009
% in highest quintile 1.2 2005 5.1 2011/12
1.4 2009
Urban % in lowest quintile 0 2005 0.0 2011/12
0.5 2009
% in highest quintile 60.5 2005 53.9 2011/12
59.9 2009
Source: MPSLSW 2006; UNDP 2005; 2008; CSO Macro Int 2007; GoZ UNICEF 2009; ZIMSTAT and ICF International 2012, ZIMSTAT 2013b. na= not available
The closer to zero the gini coefficient value is, the greater the equality in income distribution. (i) (Matabeleland North: Bulawayo)
Past levels: 1980-2008
• The Gini co-efficient remained relatively stable between 1995 and 2003 but fell in 2005-2007 (see summary
table). Provinces with medium levels of poverty saw a reduction in inequality, particularly in Mashonaland
Central and Mashonaland East, for unclear reasons (MPSLSW 2006). In 1999-2005 the richest 10 per cent
of households had 22 times the wealth of the poorest 10 per cent (UNDP 2008). Inequality within rural
and urban areas contributed more to inequality in 1995/1996 and was more than twice the contribution of
inequality between urban and rural areas (World Bank 2011).
Current level: 2009-2014
• The evidence in the summary table suggests that inequality fell in Zimbabwe between 2007 and 2011, although
with sevenfold differences between provinces and fourfold higher rural inequality as urban. As noted earlier,
rural inequality appears to have grown from a rise in rural wealth (measured in terms of household assets)
without a similar fall in rural poverty. Matabeleland North had the highest level of inequality, with a gini
coefficient of 0.59 (ZIMSTAT and ICF International 2012). Gender inequality is also noted to have persisted,
with role stereotypes and a gender division of labour. There is a continuing perception that women’s role in
the family overrides all their other socio-economic roles (Chabaya et al. 2009). A 2013 government report
on gender stated that “women continue to be under-represented in all areas of decision making … and face
significant barriers to their full and equal participation in the structures and institutions which govern their
lives.” (GoZ 2013d: 42). Civil society confirmed this, noting that while the 2013 Constitution outlaws gender
discrimination, the ZimAsset does not adequately operationalise gender equality in the economy (NGO
Human rights Forum 2014).
The Gini co-efficient has fallen steadily since 2003, suggesting a fall in overall inequality to levels more comparable
Progress
with other countries in the region. There is some evidence of falling urban: rural inequality, and also of a rise in
within-area inequality in rural areas. One factor driving inequality within areas appears to be persistent gender
inequality. This suggests that reducing inequalities within urban and rural areas calls for more explicit attention
needs to be given to overcoming gender inequalities in the economy.
9Increasing ratio of wages to Gross Domestic Product
Past level: 1980- 2008
• Growth in formal employment has been at low levels of less than 2% since 1980-1990. Real wages and the
share of wages and salaries in the GDP fell from 1995 to 2003, while the share of profits increased (Chitiga
2004). The increased profit share was not associated with increased job creation and may have contributed
to widening inequality. The share of the adult population employed fell from 70 percent in 1991 to 65
percent in 2008 (UNDP 2010). In 2000-2008, women made up only 38 percent of total employment and 62
percent were in ‘vulnerable employment’ (UNDP 2010).
Figure 3: Distribution of economically active persons aged 15 years+ by sex, 2011/12
Total 50.6% 49.4%
Unemployed 55.7% 44.3% Males
Unpaid family worker 53.6% 46.4% Females
Own account worker other 54.9% 45.1%
Communal/resettlement 39.0% 61.0%
Employer 76.0% 24.0%
Paid casual employee 64.4% 35.6%
Paid permanent employee 67.6% 32.4%
0 20 40 60 80 100
Percent
Source: ZIMSTAT, 2013c
Current level: 2009-2014
• The 2011/12 income and employment household survey reported that 8 percent of economically active
persons were unemployed, 14 times higher in urban than rural areas, and 52 percent own account workers,
largely communal and resettlement area farmers. Figure 3 highlights the gender inequalities, with 46 percent
of those identified as economically inactive being ‘housemakers’ or unpaid domestic labour, and women
more commonly working as farmers, and men as formal sector workers (ZIMSTAT 2013c).
• The increasing level of earnings coming from informal activities makes it difficult to track income trends
from formal data. In 2011, 94% of paid employees were reported to receive an income below the total
consumption poverty line (TCPL) (GoZ and UNDP 2012). There are wide disparities in earnings. In 2011, a
Paterson job evaluation found top executives in Zimbabwe to be earning an annual median total package 100
times higher than that of lowest grade workers, compared to a ratio of 21;1 in Botswana (Chulu 2011). This
is a matter that the Zimbabwe Congress of Trade Unions has protested. A reported monthly salary in 2014
of US$535 000 in one of the leading medical aid society executives triggered announcement by government
of a $6000 monthly cap on chief executive salaries for any state, parastatal or local authority. This is still 17
times higher than the $350 or less earned by 77 percent of employed people (ZIMSTAT 2013c). It has not
been fully implemented for legal reasons.
Data on the share of wages to GDP was not publicly available to interpret trends across the period. However
Progress
the evidence on falling real wages, job insecurity and high income inequalities indicate that employment
is not performing well as a vehicle for access to national income and resources, limiting possibilities of
contributory social protection schemes, discussed later. Efforts have been made to control inequalities in
earnings by reducing executive pay in the formal public sector, but the high level of informal earnings and
lack of evidence on earnings relative to profits make it difficult to assess progress in this indicator.
10Achieving and closing gender differentials in attainment of
universal primary and secondary education
PAST LEVELS CURRENT LEVEL
INDICATOR (1980–2008) (2009-2014)
Level Year Level Year
% net enrolment in primary school of 65.2 1999 91.0 2009
primary school age children 89.9 2001-8 87.0 2010/11
91.4 2005/6 93.7 2014
• Urban: Rural ratio 0.96 1999 0.98 2009
• Male: Female ratio 1.02 2004 1.02 2010/11
1.00 2005/6
% net enrolment in secondary school of 76.6 1999 45.1 2009
secondary school age children 38.0 2001-8 47.8 2010/11
44.5 2005/6 57.5 2014
Male: Female ratio, number:1 1.11 1999 1.01 2009
1.10 2004 0.99 2010/11
0.98 2005/6 0.99 2014
Primary school completion rates % 73 2000 82.4 2009
(overall) (i) 68 2004 87.7 2013
Secondary school completion rates % 78 2000
(overall) 73 2004
Primary school drop out rates
Male: Female ratio 1.04 2003
Secondary school drop out rates
Male: Female ratio 0.89 2003
% adult literacy (overall) 89.0 2003 87.3 2009
91.4 2008 98.0 2010/11
Males +15 years 94.4 2008 94.4 2010/11
Females +15 years 88.8 2008 88.7 2010/11
Rural: urban ratio 0.91:1 2010/11
Source: CSO and Macro Int 1999; GoZ UNICEF 2007; MPSLSW 2006, UNESCO 2009, UNDP 2010, ZIMSTAT UNICEF 2009; ZIMSTAT and ICF Intl 2012; GoZ and UNDP 2012; UNICEF, 2013; ZIMSTAT 2014
(i) primary is lower than secondary as intakes are higher
Past level: 1980-2008
• Asnineshown in the summary table, adult literacy rates in Zimbabwe have been consistently high at about
in ten adults, with high gender parity. There was no available evidence on early child development
and care (ECD) enrolment in the period, but Zimbabwe has since 2004 had a national policy on ECD that
requires primary schools to offer a minimum of two ECD classes for 3 to 5 year olds, noting that late
entry into ECD is associated with increased risk of dropout from school. The salaries of temporary ECD
teachers are paid by parents, imposing financial barriers to child enrolment in poor households (GoZ
and UN 2012). In 2004 the MoESC set a policy to expand the number of primary schools offering ECD
(Munjanganja and Machawira 2014). Education has been the biggest beneficiary of the national budget, most
of this going to teacher salaries. Primary and secondary school completion rates rose from 1990 to 2005
and gender equity improved. Falling real wages, poor conditions and political violence in the 2000s was
associated with teachers leaving their jobs and shortfalls in teacher numbers (MPSLSW 2006; UNICEF
112012). Less than half of children transited from primary to secondary school in the period, even less in girls.
Dropout was reported to be due to financial constraints and girl children playing caring and domestic roles
(MPSLSW 2006). Responding to this, a National Girls’ Education Strategic Plan launched in 2006 mobilised
resources to keep girls, orphans and vulnerable children in school (UNICEF, 2006) and a Government
Basic Education Assistance Module (BEAM) supported payment of school fees for nearly a million children
by 2005 (GoZ/UNICEF 2007).
Current level: 2009-2014
• Adult literacy rates remained high to 2010/11, although without
further increases and lower rates in rural areas (see summary
table). A curriculum for ECD was developed by 2011. By 2012 98%
of primary schools offered ECD classes. While it is planned to
train 5 000 ECD teachers by 2015, there were only 2400 trained
by 2014, with paraprofessionals filling the gap (Munjanganja and
Machawira 2014; VVOB 2014). ECD programmes were attended
by 22 percent of children aged 36-59 months; and 62 percent of
children aged 46-59 months were reported to be developmentally
on track in at least three of four domains of literacy-numeracy,
physical, social-emotional and learning (ZIMSTAT 2014).
• The 2013 Constitution guarantees the right to education. Primary
school enrolment remained high in the period and primary
school completion rates improved to 2014 (summary table).
There were negligible differences across social groups, high
gender parity in primary school and a concentration curve that
showed almost no wealth differentials in education (See Figure 4).
Improving completion rates post 2008 were reported to relate
to improvements in the economic situation enabling children to
remain in school, backed by a national information campaign to
sensitise parents on the need to educate girls (GoZ and UNDP
2012).
• Inequalities are more pronounced at secondary school with
secondary school enrolment rising slightly to 48 percent (see
summary table). In April 2014, parents were reported to be paying
private fees and incentives for public schools, more so in urban
than rural areas, with sums paid reported to range from $25 -
$250 (CMP 2014). Community sentinel site monitoring reported
the share of households having difficulty with meeting these costs
rising up to 2011, but falling thereafter, as did the reported level
of dropout (CMP 2014). The budget allocation to BEAM fell
from $73 million in 2013 to $15 million in 2014. External funders
directly supplemented costs for children with $10 million (NGO
Human rights Forum 2014). A shortfall in public assistance has
had the most impact on vulnerable children and their schools: In
the poorest quartile of schools, BEAM funds constitute 25 percent
of school income, largely benefitting vulnerable children (Smith
et al. 2012). Social inequalities are also affected by the quality of
education. The low pass rate for Ordinary Level, at 21 percent
in 2013, suggests concern with education quality (NGO Human
rights Forum 2014). Community sentinel site monitoring reported
that education quality improved in their areas in 2009 to 2012, but
report of improvements plateaued thereafter (CMP; 2014 Table 2).
© COSV, 2008
12Figure 4: Concentration curve, net primary school attendance
100
90
80
Cumulative % net primary attendance
70
60
50
40
30
20
10
0
0 10 20 30 40 50 60 70 80 90 100
Cumulative % primary children ranked by wealth
Source: authors from Zimstat UNICEF 2009
Table 2: Community monitoring report of changes in quality of schooling, 2009-2014
Percent sites reporting that quality of schooling has
No of sites
Stayed the
Improved Got worse
same
Total April 2014 244 32 65 3
Total March 2013 240 38 53 9
Total March 2012 239 69 20 5
Total March 2011 237 80 14 6
Total March 2010 240 66 26 9
Total March 2009 182 5 60 35
Source: CMP 2014
Zimbabwe’s high net enrolment and gender parity in education, nearing to MDG targets, has contributed
Progress
to health equity. While parents and government have sustained high enrolment and primary completion
throughout the period, there have been challenges in ECD enrolment, in transition to and completion of
secondary school and in education quality. Operationalising the constitutional right to education is important
to sustain education’s contribution to health, including through support of costs for the poorest children and
improving teacher pay and conditions.
13Achieving the MDG goal of halving the proportion of people with
no sustainable access to safe drinking water by 2015
PAST LEVELS CURRENT LEVEL
INDICATOR (1980–2008) (2009-2014)
Level Year Level Year
% households using improved water 78.2 2005/6 73.0 2009
source (Overall) 78.7 2010/11
76.1 2014
• rural 75.1 1999
66.5 2004 61.0 2009
67.1 2005/6 68.7 2010/11
• urban 99.0 1999 98.0 2009
99.0 2004 95.1 2010/11
99.4 2005/6
• Urban: rural ratio 1.32 1999 1.61 2009
1.50 2004 1.38 2010/11
1.48 2005/6
% households using improved sanitation 40.0 2005/6 60.0 2009
(Overall) 55.9 2010/11
35.0 2014
• rural 45.0 1999 43.0 2009
30.5 2005/6 33.3 2010/11
• urban 99.0 1999 97.0 2009
58.56 2005/6 95.1 2010/11
• Urban: rural ratio 2.20 1999 2.26 2009
1.92 2005/6 2.86 2010/11
Source: CSO Macro International, 2000, 2007; CSO 2006, MoHCW 2009; ZIMSTAT and ICF International, 2012, ZIMSTAT 2013b; 2014
Past level: 1980-2008
• Access to clean water remained static in urban
areas and fell in rural areas between 1999 and
2005/6, with a consistently wide gap between rural
and urban areas (see summary table). A far greater
share of urban than rural households had access to
sanitation, although access to improved sanitation
fell in both rural and urban areas between 1999 and
2005/6. Government, parliament and civil society
reported a worsening situation in 2008, with aging
and unrepaired sewer systems and treatment
works; illegal waste dumping and waste put in
sewers due to poor waste collection; overflowing
septic tanks; frequent water and power cuts and
frequent interruptions in supplies (MoHCW
2009; USAID 2008; CHRA 2007; Parliament of
Zimbabwe 2008). Diarrhoea rates increased from
32 to 47/1000 between 2004 and 2005 (MoHCW
et al. 2004, MoHCW 2005b).
© UNICEF Zimbabwe
14Current level: 2009-2014
• Section 77 of the 2013 Constitution guarantees the right to safe, clean and potable water and sufficient
food and for the State to take legislative measure to secure these rights. Between 2008 and 2011/12 the
share of households using an improved water source nationally fell, with the urban:rural ratio falling as
rural areas improved relative to urban (See summary table). Even where services exist, water supplies from
them have been noted to be erratic, especially in urban areas (ZIMSTAT 2013b). Community sentinel site
monitoring reported that access to safe water infrastructures within 500 meters improved between 2012
and 2014, albeit with erratic supplies resulting in households having to buy water or to sink wells and drill
boreholes, at costs that raise financial barriers to access for some.
• Access to improved sanitation increased in both rural and urban areas between 2005 and 2009 but has
since fallen, especially in rural areas. Urban-rural differentials widened with a greater decline in rural areas.
Use of improved sources of drinking water and sanitation increased with education of household head and
wealth, with 80 percent points difference across social groups in 2009. (ZIMSTAT UNICEF 2009). These
wide inequalities were sustained to 2010/11 (Summary table; ZIMSTAT 2013b), together with geographical
inequalities, with lowest levels of safe water and sanitation in Matabeleland North (See Figure 5a and b).
Figure 5a: Provincial distribution of access to improved water 2013/4
100
Improved water source
68% 77% 74% 62% 77% 68% 66% 62% 70%
80 Unimproved water source
Percent of Households
60
40
20 32% 23% 26% 38% 23% 32% 34% 38% 30%
0
Manicaland
Mashonaland
Central
Mashonaland
East
Mashonaland
West
Matabeleland
North
Matabeleland
South
Midlands
Masvingo
National
Source: ZimVAC 2013
• While Zimbabwe’s urban sanitation still outperforms many other countries in the region, there has been a
significant decline in the quality of urban and rural sanitation, sewer blockages and dysfunctional wastewater
treatment plants (WSP et al. 2011). Water supplies were also intermittent and of poor quality. Harare
residents in 2013 reported drinking contaminated water from shallow, unprotected wells and defecating
outdoors, violating their right to water and sanitation and raising the risk of disease (HRW 2013).
• Areported
national cholera epidemic covering all ten provinces from August 2008 had by April 2009 led to a
4,269 deaths and 97,469 cases (MoHCW 2009). In 2010, 14 out of 62 districts in the country
were affected by a further cholera outbreak that started in February, 2010, with 72 percent of cases from
rural areas, compared to 53 percent in 2009 (WHO MoHCW 2010). Typhoid and high levels of diarrhoea
were reported by government in both 2012 and 2014 (NGO Human rights forum 2014).
15Figure 5b: Provincial distribution of access to improved sanitation 2012
100
90
80
70
60
Percent
50
40
30
20
10
0
Bulawayo
Harare
Manicaland
Mashonaland
Central
Mashonaland
East
Mashonaland
West
Matabeleland
North
Matabeleland
South
Midlands
Masvingo
National
Source: Zimstat 2013
© F Machingura, 2011
A recovery in water and sanitation is critical to prevent cholera, diarrhoeal and other disease outbreaks and
Progress
their associated human cost, and to address the time and other costs to households, particularly for women
and children, to access safe water. In 2011, government published its National Strategy to Accelerate Access
to Sanitation and Hygiene 2011- 2015 (GoZ 2011), and ZimAsset proposed substantial investments in water
and sanitation infrastructure (GoZ 2013). Addressing the longstanding neglect of improvements in water and
sanitation services was estimated in 2011 to require US$3.7 bn (AfDB 2011), with a six-fold increase in capital
investment needed to rehabilitate services to meet MDG goals (WSP et al. 2011). While some resources have
been raised towards this, the shortfall remains wide and the issue continues to be a critical deficit area affecting
health.
16Allocating at least 10% of budget resources to agriculture,
particularly for smallholder and women producers
PAST LEVELS CURRENT LEVEL
INDICATOR (1980–2008) (2009-2014)
Level Year Level Year
Government spending on agriculture as a 11 1990 3.4 2009 (*)
percent of total government expenditure 4 1995 2.5 2010 (**)
2 2000 3.8 2014
8 2005
8 2007
Source: AU/NEPAD 2007, MoFinance 2010,2012, 2014 (*) expenditure (**) budget estimate
Past levels: 1980 – 2008
• From an allocation of 11 per cent
of the national budget in 1990, the
budget to agriculture fell to 2% in
2000, rising sharply from 2001 to
2005, at a time of significant land
reform and falling thereafter to 8
percent in 2007 (AU/NEPAD 2007).
Household surveys between 1999
and 2005 showed a fall from 18% to
10% in women’s employment in skilled
non-agricultural employment in rural
areas, suggesting greater reliance
amongst women on smallholder
farming (Loewenson, Shamu 2008).
© DFAT, 2011
Figure 6a: Distribution of farm owners by sex and land type 2010
100
Male
90 84.2%
80.5% Female
80 73.6% 75.2%
69.3%
70 65.1% 65.2% 63.4%
54.8%
60
Percent
50 45.2%
40 34.9% 34.8% 36.6%
30.7%
30 26.4% 24.8%
19.4%
20 15.8%
10
0
SSCF
LSCF
Communal
Model A
Model E
Model B2
Old
Resettlement
A1
A2
Source: GoZ 2013d SSCF = Small scale commercial farming LSCF = Large scale commercial farming
17Current level: 2009-2014
• InInvestment
2009-13 the share of the budget to agriculture did not rise above 3.8 percent (see summary table).
in smallholder and female farming, especially for local food production has been found to
improve health and nutrition, however farmers, especially women farmers, have not always accessed the
inputs needed for this. Women had significantly lower ownership of land and access to draught power,
credit and irrigation and only four percent of women farm owners secured loans compared to 12 percent of
male farm owners (GoZ 2013d; Figure 6a; CMP 2013). The Grain Marketing Board owed farmers $6.1bn in
2014 for grain delivered and late payments were reported to discourage cereal production, together with
shortages and rising prices of fertiliser (WFP and Vam 2014). Community monitoring reports indicated
a relationship between levels of own produce and household food security. For example although food
prices rose in 2014, a rise in average maize yields and in consumption from own production was associated
with rising levels of food stocks (CMP 2014; Figure 6b).
Figure 6b: Reported level of food stocks, 2004 –2014
100
80
More than 4 months
60
1-3 months
Percent
Less than 1 month
40
None
20
0
Mar-08
Nov-08
Mar-09
Mar-10
Mar-11
Mar-12
Mar-13
Apr-14
Sep-08
Sep-10
Sep-11
Sep-12
Oct-07
Oct-13
Jun-09
Jun-10
Jun-11
Jun-12
Jun-13
Jul-04
Jul-07
Source: CMP 2014
Progress
The evidence suggests that there are still further steps for the potential of land reform to translate into health
equity and food security gains, particularly through investment in smallholder food production. These include
improved support for inputs, timeliness of payments for cereal deliveries and overcoming gender inequalities in
land ownership, and in access to capital and inputs.
© COSV, 2008
18You can also read