New Orleans Community Health Improvement Report - Community Health Profile & Community Health Improvement Plan
←
→
Page content transcription
If your browser does not render page correctly, please read the page content below
New Orleans
     Community Health Improvement Report
                       Community Health Profile &
                    Community Health Improvement Plan

Prepared by: the New Orleans Health Department
January 2013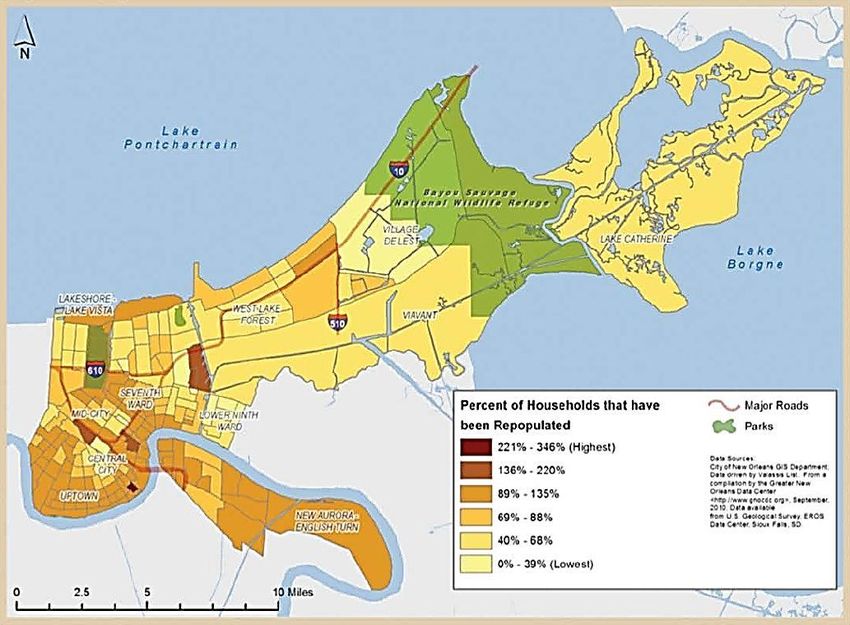
NEW ORLEANS COMMUNITY HEALTH IMPROVEMENT REPORT
LETTER FROM THE HEALTH COMMISSIONER

                                  In keeping with Mayor Mitch Landrieu’s commitment to improve the quality of life for the
                                  citizens of New Orleans, the Mayor and I are pleased to present this Community Health
                                  Improvement assessment and planning document. This booklet contains two reports, the
                                  Community Health Profile and Community Health Improvement Plan which are companion
                                  documents intended to complement each other and paint a broad picture of the state of
                                  community health in New Orleans. They are also available on the web at
                                  http://new.nola.gov/health.

                                  The reports are the result of a formal community health Improvement assessment and
                                  planning effort reflect over 18 months of collaborative work with agency partners and
community stakeholders to establish a shared vision, conduct a comprehensive community health assessment, and develop
an assets-based planning document. Using the Mobilizing for Action through Planning and Partnerships (MAPP) framework
as our guide we conducted four interdependent assessments that, when combined, provide a comprehensive snapshot of
the specific health needs and opportunities in our community. Data from the community health assessment process was
used to prioritize strategic issues to be included in the Community Health Improvement Plan.

We are thankful for the support of over 100 stakeholders and partners from across multiple sectors and technical assistance
provided by the National Association of County & City Health Officials, the Robert Wood Johnson Foundation, the Centers
for Disease Control and Prevention, and M Powered Strategies to develop this document. This is a living document and with
the help of our partners, the plan will be implemented over the next five years. Through this effort we commit to rigorously
measuring our processes and outcomes to evaluate and improve our planning efforts. We are also dedicated to developing
data-driven targets and timely policies based on evidence-based interventions supported by sound research and/or practice.
Most importantly, we are driven to see that this report is accessible to all who live, learn, work, and play in New Orleans.

Our challenges are great, but so is our opportunity. We invite you to use this plan to help inform and enhance your
knowledge of the work currently underway to improve community health in New Orleans. We also encourage everyone to
get involved and contribute to this effort as we seek to establish New Orleans a model for community health improvement
for the nation.

Sincerely,

Karen Bollinger DeSalvo, MD, MPH, MSc
Health Commissioner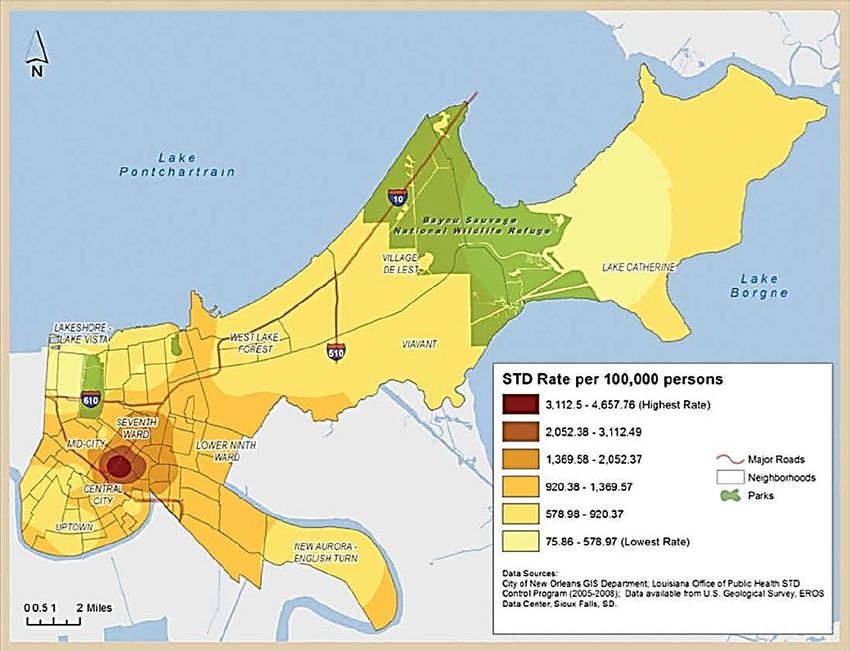
NEW ORLEANS COMMUNITY HEALTH IMPROVEMENT REPORT
COMMUNITY HEALTH IMPROVEMENT STEERING COMMITTEE
     Michelle Alletto          Birth Outcomes Project, Louisiana Department of Health and Hospitals
     Eric Baumgartner          Louisiana Public Health Institute
     Daesy Behrhorst           Louisiana Language Access Coalition
     Theodore Callier          Dillard University
     Nash Crews                Recovery School District
     Karen DeSalvo             City of New Orleans
     Lucas Diaz                Office of Neighborhood Engagement, City of New Orleans
     Denise Graves             Micah Project
     Avis Gray                 Louisiana Department of Health and Hospitals
     Stephanie Haynes          Greater New Orleans Drug Demand Reduction Coalition
     Corey Hebert              Tulane Hospital
     Ben Johnson               New Orleans Chamber of Commerce
     Calvin Johnson            Metropolitan Human Service District
     Jim Kelly                 Covenant House
     Flint Mitchell            Greater New Orleans Foundation
     Tiffany Netters           Office of Public Health, Louisiana Department of Health and Hospitals
     Minh Nguyen               Vietnamese American Young Leaders Association
     Claire Norris             Department of Sociology, Xavier University of Louisiana
     Lindsay Ordower           504HealthNet
     Charlotte Parent          City of New Orleans, Health Department
     Kate Parker               Prevention Research Center, Tulane University
     Jamilah Peters-Muhammad   Ashe’ Cultural Arts Center
     Thena Robinson-Mock       Kids Rethink New Orleans Schools
     Paul Salles               Metropolitan Hospital Association
     Timolynn Sams             Neighborhood Partnership Network
     Petrice Sams-Abiodun      Lindy Boggs Literacy Center, Loyola University
     Liz Scheer                Baptist Community Ministries
     Denese Shervington        Institute of Women and Ethnic Studies
     Adrian Todd               Kingsley House
     Yvette Wing               Centers for Disease Control and Prevention
     Beverly Wright            Deep South Center for Environmental Justice, Dillard University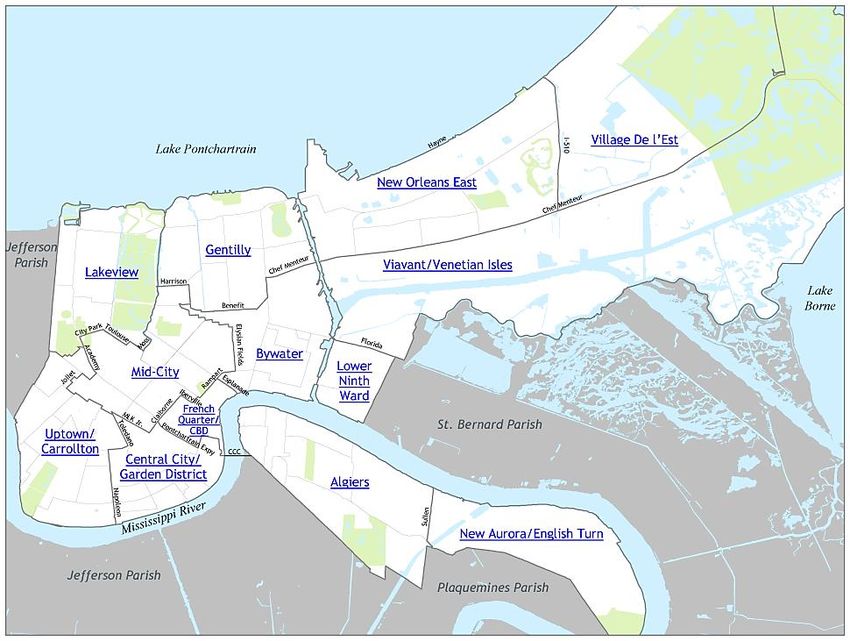
NEW ORLEANS COMMUNITY HEALTH IMPROVEMENT REPORT
TABLE OF CONTENTS
COMMUNITY HEALTH IMPROVEMENT IN NEW ORLEANS ........................................................ I
 BACKGROUND ................................................................................................................................... i
 MOBILIZING FOR ACTION THROUGH PLANNING AND PARTNERSHIPS (MAPP) ......................................... ii

NEW ORLEANS COMMUNITY HEALTH PROFILE
EXECUTIVE SUMMARY .................................................................................................................. 1
 FOUR MAPP ASSESSMENTS ............................................................................................................. 2
 COMMUNITY HEALTH INDICATORS ...................................................................................................... 3
DEMOGRAPHICS ............................................................................................................................ 4
HEALTH STATUS, HEALTH OUTCOMES, AND LIFE EXPECTANCY ........................................ 13
  ACCESS TO HEALTHCARE ............................................................................................................. 17
  CHRONIC DISEASE ....................................................................................................................... 19
  COMMUNICABLE AND INFECTIOUS DISEASES .................................................................................. 21
  MATERNAL AND CHILD HEALTH ..................................................................................................... 23
  PUBLIC SAFETY ........................................................................................................................... 25
  BEHAVIORAL HEALTH ................................................................................................................... 27
COMMUNITY INPUT ...................................................................................................................... 29
 ASSETS AND BARRIERS TO COMMUNITY HEALTH ............................................................................... 29
 COMMUNITY STRENGTHS AND ASSETS ............................................................................................. 37
  Community Health Asset Map ................................................................................................... 40

NEW ORLEANS COMMUNITY HEALTH IMPROVEMENT PLAN
EXECUTIVE SUMMARY .................................................................................................................. 1
UNDERSTANDING THE COMMUNITY HEALTH IMPROVEMENT PLAN ..................................... 2
 What is a Community Health Improvement Plan? .......................................................................... 2
 How Will We Use the CHIP? .......................................................................................................... 2
 What is the relationship between the New Orleans CHIP and other Planning Efforts? .................. 2
 Developing the New Orleans Community Health Improvement Plan ............................................. 3
 What Policy Changes are needed for our CHIP to be Successful? ................................................ 5
ACCESS TO PHYSICAL AND BEHAVIORAL HEALTHCARE ....................................................... 6
  Statement of Need....................................................................................................................... 7
  Background ................................................................................................................................. 7
  Objectives and Strategies............................................................................................................ 8
SOCIAL DETERMINANTS OF HEALTH ......................................................................................... 9
  Statement of Need..................................................................................................................... 10
  Background ............................................................................................................................... 10
  Objectives and Strategies.......................................................................................................... 10
NEW ORLEANS COMMUNITY HEALTH IMPROVEMENT REPORT
VIOLENCE PREVENTION ............................................................................................................. 11
   Statement of Need..................................................................................................................... 12
   Background ............................................................................................................................... 12
   Objectives and Strategies.......................................................................................................... 13
HEALTHY LIFESTYLES ................................................................................................................ 14
  Statement of Need..................................................................................................................... 15
  Background ............................................................................................................................... 15
  Objectives and Strategies.......................................................................................................... 16
FAMILY HEALTH ........................................................................................................................... 17
  Statement of Need..................................................................................................................... 18
  Background ............................................................................................................................... 18
  Objective and Strategies ........................................................................................................... 19
HOW CAN YOU HELP IMPROVE COMMUNITY HEALTH IN NEW ORLEANS?......................... 20
PLANNING INITIATIVE PARTNERS ............................................................................................. 21
WORKS CITED .............................................................................................................................. 25
NEW ORLEANS COMMUNITY HEALTH IMPROVEMENT REPORT
COMMUNITY HEALTH IMPROVEMENT IN NEW ORLEANS
B ACKGROUND
Community Health Improvement is a comprehensive approach to assessing community health and developing and
implementing action plans to improve community health through substantive community member and local public health
system partner engagement. The Community Health Improvement process addresses the social and environmental
determinants of health by engaging the broader public health system, focusing on the knowledge, assets and, resources we
have available as a community to improve our health together. Generally, Community Health Improvement models include
the following steps:

                                       1.   Prepare and plan
                                       2.   Engage the community
                                       3.   Develop a goal or vision
                                       4.   Conduct community health assessment(s)
                                       5.   Prioritize health issues
                                       6.   Develop community health improvement plan
                                       7.   Implement community health improvement plan
                                       8.   Evaluate community health improvement plan
                                       9.   Restart cycle

In 2011, together with community partners, the New Orleans Health Department (NOHD) engaged in its first city-wide
community health assessment since 2000. This initiative is one of many collaborative efforts the department has undertaken
in its quest to become a model 21st century health department capable of addressing modern, population-level health
issues so that all New Orleanians can achieve their full potential. The New Orleans Community Health Improvement
process represents a paradigm shift in how communities work to improve local health outcomes. This shift is marked by
notions of health moving from a medical, individual healthcare, needs assessment model, to a framework that incorporates
a broader idea of health--focusing on populations, assets and identifying resources.

The New Orleans Health Department was one of twelve local health department sites awarded a small demonstration site
grant from the National Association of County and City Health Officials (NACCHO) through the Robert Wood Johnson
Foundation. This grant was intended to help develop and implement a comprehensive Community Health Assessment
(CHA) and Community Health Improvement Plan (CHIP). Employing a nationally-recognized, best practice framework
provides useful guidance and structure for agencies committed to improving community health. Through collaborative
community health improvement efforts, stronger partnerships are built, the public health infrastructure is strengthened, multi-
sector leadership is established, and the field of public health gains more visibility.

Agency partners and key stakeholders were enlisted to form two advisory bodies: the Community Health Improvement Core
Team and Steering Committee. These groups were established to provide support to the CHA-CHIP team throughout the
process. Members of the both entities were involved in the project from its inception to inform key facets of the project as it
                                                                                                                        Page | i
NEW ORLEANS COMMUNITY HEALTH IMPROVEMENT REPORT
developed. Specifically, members of the Community Health Improvement Core Team and Steering Committee served on
assessment sub-committee working groups and were charged with designing a specific approach, collecting and analyzing
available data, and writing portions of the report for each of the four MAPP assessments. They also serve similar roles in
the Community Health Improvement Planning process.

M OBILIZING     FOR   A CTION   THRO UGH      P LANNING     AND   P ARTNERSHIPS (MAPP)
The MAPP framework is a nationally-recognized model for conducting community health assessments and strategic
planning for community health improvement, supported by the Centers for Disease Control and Prevention (CDC) and
NACCHO. MAPP is a cyclical, 18 month, six-phase process that can be tailored to suit the needs of most communities. The
model promotes an active participation component through encouraging collaboration between multi-disciplinary partners in
a variety of sectors that impact health. Community partners and stakeholders were invited to participate in this effort based
on their professional expertise and scope of work.

Vision for Community Health Improvement
Vision statements provide focus, purpose, and direction to a process. They encourage participants to work collaboratively in
achieving a shared vision for the future. In early 2012, through key informant interviews the Community Health Improvement
Steering Committee began to shape their vision statement for the Community Health Improvement in New Orleans. In these
interviews, participants were asked to list characteristics of a healthy New Orleans and share their own vision for community
health improvement. Data from these interviews was used to develop several draft vision statements presented at a meeting
of community stakeholders for feedback. To finalize the vision statement, meeting facilitators lead participants through a
facilitated group consensus-building process. This method of group visioning helped to garner far-reaching community
support and buy-in for the vision statement that would inform subsequent phases of MAPP.

                       “We envision a safe, equitable New Orleans whose culture,
                         institutions, and environment support health for all.”

                                 -Vision for Community Health Improvement in New Orleans

                                                                                                                      Page | ii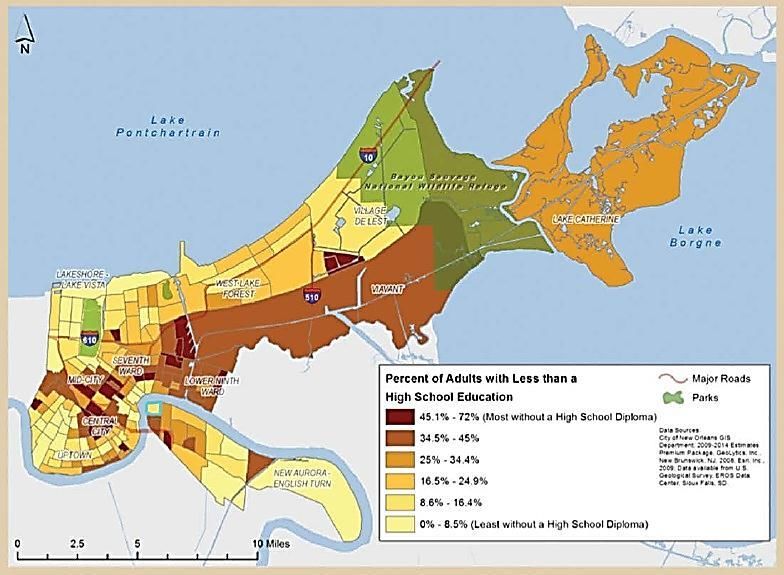
NEW ORLEANS COMMUNITY HEALTH PROFILE

NEW ORLEANS COMMUNITY HEALTH PROFILE
NEW ORLEANS COMMUNITY HEALTH PROFILE

EXECUTIVE SUMMARY
This report presents the major quantitative and qualitative findings from our city-wide Community Health Assessment. We
employed a macro-level analysis to synthesize the data and to help illustrate how citywide interactions affect health and
other social outcomes in Orleans Parish. According to the Centers of Disease Control and Prevention (CDC), health is one
of many domains that contribute to overall quality of life; other factors include jobs, housing, schools, neighborhoods,
culture, values, and spirituality which often make it a complex variable to capturei. The construct of Health-Related Quality
of Life (HRQOL) accounts for those components of overall quality of life that clearly affect physical and/or mental health.
Because larger scale issues like healthcare funding, agency reorganization, and priority setting tend to have a trickledown
effect on neighborhoods and individuals, as reflected in quality of life and health concerns, it is important to consistently and
systematically assess these issues.

Community input was vital to shaping the city-wide Community Health Assessment and this Community Health Profile. The
Community Health Improvement core team decided early in the assessment process to heed to growing concerns about
assessment fatigue in the Greater New Orleans area due to the overwhelming number of community assessments
conducted post-Hurricane Katrina, the chosen approach proved less invasive and burdensome to community residents.
Instead, the Community Health Improvement team decided to use a mixed methods approach for collecting community
health indicator data for this initiative with minimal primary data collection (i.e. surveys, key informant interviews, and focus
groups). Instead we incorporated available secondary data from other community health and quality of life assessments as
well as state and national surveillance reports. Specifically, this Community Health Profile report uses data from all four
MAPP assessments to present a comprehensive overview of the trends, barriers, assets, and opportunities that impact the
multiple determinants of health and health-related quality of life for the citizens of New Orleans.

Throughout the assessment process we learned that poverty, particularly childhood poverty, is a major determinant of
health for residents of New Orleans. The effects of poverty on the health of our citizens can be seen through lack of access
to affordable housing, food, healthcare services, as well as higher rates of unemployment, infant mortality and morbidity,
and obesity than the national average. In addition, there is a 25 year gap in life expectancy between residents of one of the
city’s most economically depressed neighborhoods compared to those in the most affluent neighborhoods. According to the
Joint Center for Political and Economic Studies’ report Place Matters for Health in Orleans Parish: Ensuring Opportunities
and Good Health for All (2012), “Place matters for health in important ways, according to a growing body of research.
Differences in neighborhood conditions powerfully predict who is healthy, who is sick, and who lives longer. And because of
patterns of residential segregation, these differences are the fundamental causes of health inequities among different racial,
ethnic, and socioeconomic groups”ii. Thus, examining the distributions of poverty and health at the neighborhood and
community level is essential to address and eliminate health disparities.

While it is true that there are a number of challenges that must be addressed to improve the health and quality of life for our
residents, it is also true that New Orleans is a city on the mend. We are experiencing a period of astounding growth,

                                                                                                                         Page | 1
NEW ORLEANS COMMUNITY HEALTH PROFILE
innovation, and cultural renaissance. Decision-makers and citizens alike are finding newer, more modern, and efficient ways
to engage collaboratively to create a future that is brighter than our past through increased opportunities for civic
engagement, more governmental accountability, rebuilding public infrastructure, and advocating for a “Health in All Things”
policy and programmatic agenda for all who live, learn, work and play in New Orleans.

F OUR MAPP A SSESSMENTS
The assessment phase of the Community Health Improvement process involves conducting four interdependent
assessments that when combined provide an expansive array of data that can be used to inform the Community Health
Improvement Planning process. This profile contains findings from each of the following four MAPP assessments:

    1. Community Health Status- the purpose of the Community Health Status Assessment is to gather data on all
        entities that comprise the public health infrastructure of New Orleans/Orleans Parishiii. To accomplish this,
        quantitative data is collected for extended range of health-related indicators that allow comparisons between the
        local jurisdictions and state and national health issues or trends. This assessment seeks to answer the questions:
                 a. How healthy are our residents?
                 b. What does the health status of our community look like?
    2. Local Public Health System- the Local Public Health System (LPHS) can be described as the human,
        informational, financial, and organizational resources, including public, private, and voluntary organizations and
        individuals that contribute to the public's health. In this vein, the LPHS Assessment (LPHSA) evaluates the
        strengths and weaknesses of the system and provides the basis for improving the city’s public health infrastructure.
        The assessment serves to answers the questions:
                 a. What are the competencies, and capacities of our local public health system?
                 b. How well are the 10 essential public health services being provided in our community?
    3. Community Themes and Strengths- the Community Themes and Strengths is a critical component of Community
        Health Improvement. Through this process community concerns and solutions are explored to help provide insight
        into the issues of importance to the residents of New Orleans. This assessment is designed to result in a strong
        understanding of community concerns, perceptions about quality of life, and a map of community assets and
        answers the questions:
                 a. What is important to our community?
                 b. How do we perceive quality of life in our community?
                 c. What assets do we have that can be leveraged to improve our community’s health?
    4. Forces of Change- the Forces of Change Assessment serves to help communities identify potential environmental
        shifts, changes to the public health landscape, both positive and negative, that could affect community health in the
        area. During this assessment, participants were asked to brainstorm forces, trends, factors, or events that will
        influence perceptions of health and quality of life in the community and the local public health system. The forces

                                                                                                                        Page | 2
NEW ORLEANS COMMUNITY HEALTH PROFILE
identified helped to identify overarching concerns that may impact community health. The Forces of Change
assessment seeks to answer the questions:
a. What is occurring or might occur that affects the health of our community or the local public health
system?
b. What specific threats or opportunities are generated by these occurrences
C OMMUNITY H EALTH I NDICATORS
Working closely with community stakeholders and members of the Community Health Improvement Steering Committee the
following community health indicators were selected (based on: data availability, relevance, and city-wide impact) to be
addressed by the Community Health Assessment:
Category Community Health Indicators
Race Income
Ethnicity Housing
Demographics
Gender Education
Age Employment
Access to Healthcare
Maternal and Child Health
o Health insurance coverage
o Infant mortality
o Primary care
o Teen pregnancy
Chronic Disease
o Low birth weight
o Obesity
Public Safety
Community Health o Heart disease & stroke
o Murder & violent crime
Status/Outcomes o Diabetes
o Intimate partner violence
Communicable/Infectious Disease
Behavioral Health
o Chlamydia
o Mental health
o Gonorrhea
o Substance abuse
o Syphilis
o Suicide
o HIV/AIDS
In addition to quantitative health indicator data, we also used qualitative data to describe the various assets and barriers to
community health for New Orleanians. While the quantitative health indicator section of this report relies solely on
secondary surveillance data (collected by the State of Louisiana Department of Health and Human Services, the U.S.
Census American Community Survey (ACS), and Centers for Disease Control and Prevention) the asset/barrier
identification section of the report includes both primary and secondary data. Primary data includes key informant interviews
and discussion/focus groups conducted during our Forces of Change and Local Public Health System Assessments, while
the secondary data used from the City of New Orleans’ Master Plan (Plan for the 21st Century: New Orleans 2030 – A
Vision and A Plan for Action)iv and the Kaiser Family Foundation’s 2010 report, New Orleans Five Years After the Storm: A
New Disaster Amid Recoveryv. The compilation and synthesis of health and quality of life data from each of the sources
outlined above help to provide necessary context and insight into both the many challenges to addressing community health
in New Orleans and the prevailing strength of the LPHS and residents determined to improve health outcomes in our city.
Page | 3NEW ORLEANS COMMUNITY HEALTH PROFILE
DEMOGRAPHICS
In 2010, the U.S. Census Bureau estimated that approximately 342,829 residents lived in Orleans Parish. While the majority
of residents identify as Black or African American (61.2%) or White (34.2%), there are also a significant proportion of
residents that identify as Asian (3.3%), Hispanic (5.2%), or as another unspecified race (2.4%). Currently, there are slightly
more females (51.6 %) than males (48.4%) in New Orleans and the average age of residents is 34.6 years. Table 1
presents the demographic composition of Orleans Parish, Louisiana and the U.S.
Table 1: Population Demographics for Orleans Parish, Louisiana and U.S.
Demographics Orleans Parish LA U.S.
Total population 343,829 - 4,533,372 308,745,538
Race
Black or African American 210,447 61.2% 32.0% 12.6%
White 117,460 34.2% 62.6% 74.2%
Asian 11,306 3.3% 1.5% 4.8%
American Indian and Alaska Native 2,792 0.8% 0.7% 0.8%
Native Hawaiian and Other Pacific
339 0.1% 0% 0.2%
Islander
Some Other Race 8,192 2.4% 1.5% 4.8%
Ethnicity
Hispanic or Latino (of any race) 18,051 5.2% 4.2% 16.4%
Gender
Female population 177,581 51.6% 51.0% 50.8%
Male population 166,248 48.4% 49.0% 49.2%
Age
Under 5 years 22,040 6.4% 6.9% 6.5%
5 to 19 years 62,477 18.2% 20.8% 20.4%
20 to 34 years 89,004 25.9% 21.3% 20.2%
35 to 54 years 91,285 26.6% 27.0% 27.8%
55 to 64 years 41,384 12.1% 11.9% 11.9%
65 to 84 years 32,635 9.4% 10.8% 11.3%
85 years and over 5,004 1.5% 1.4% 1.8%
Median age (years) 34.6 - 35.8 37.2
Source: U.S. Census Bureau, 2010
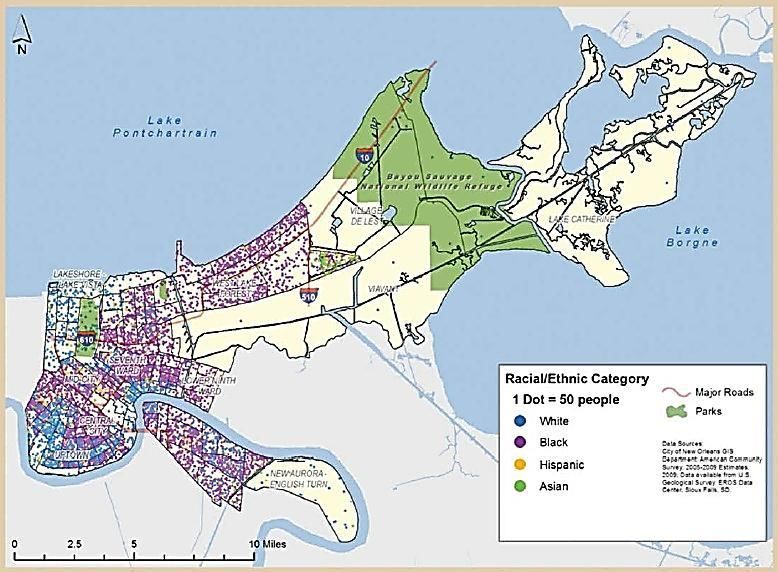
Though slightly over 60% of New Orleanians identify as African American or Black, racial and ethnic groups are unevenly
dispersed throughout the city. This uneven distribution often impacts health outcomes in minority communities, not because
they are predominantly Black or Hispanic but because of spatial concentrations of higher rates of poverty. Even persons
with middle and relatively higher incomes are at greater risk when more of their neighbors are poorvi. Research findings
demonstrate a link between income inequality and mortality and self-reported health (SRH)vii. That is, individuals who report
lower incomes also tend to report material deprivation and, in turn, tend to suffer social, psychological and emotional
deprivation. The U.S. Census (2010) reports 14 tracks in Orleans Parish are racially homogeneous. These tracks are
located in the neighborhoods of Fisher Development, the Lower Ninth Ward, Florida Development, Pontchartrain Park, Lake
Page | 4NEW ORLEANS COMMUNITY HEALTH PROFILE
Catherine, Seventh Ward, St. Bernard Area, Treme, B.W. Cooper, Dixon, and the Northern Portion of Central City. Areas
that are predominately white are between Orleans and Pontchartrain Avenue and in Audubon between Robertson Street
and Prytania Street. Map 1 highlights several of the neighborhoods that comprise the city of New Orleans and Orleans
Parish and Map 2 demonstrates the racial composition of Orleans Parish. The areas of Lake Terrace and Oaks, St.
Anthony, Milneburg, Old Aurora, Tall Timbers/Brechtel, West & East Riverside, Lower Garden District, Central Business
District, Mid-City and Marlyville/Fountainbleu are the most racially diverse areas.
MAP 1. ORLEANS PARISH NEIGHBORHOODS
Source: Greater New Orleans Community Data Center, Map available at: www.gnocdc.org
MAP 2. RACIAL COMPOSITION OF NEW ORLEANS NEIGHBORHOODS
Source: Place Matters for Health in Orleans Parish, 2012
Page | 5NEW ORLEANS COMMUNITY HEALTH PROFILE
In 2010, the U.S. Census reported the mean household income for Orleans Parish was $59,554. Nationally, real median
household income1 was $49,445 in 2010, a 1.2% decline in family households and 3.9% decline in nonfamily households
from 2009. In Orleans Parish, 60.5% of households report incomes of less than $50,000, while 14% have an income less
than $10,000, and retirement income comprises 12.6% of all households. According to Place Matters for Health in Orleans
Parish, families living below the Federal Poverty Level (FPL) are 3.6 times more likely to report fair or poor health than those
with incomes of at least two times above the poverty level. Between 2009 and 2010, there was a national increase in the
rate of poverty2. Nationally, the official poverty rate in 2010 was 15.1 percent, an increase up from 14.3 percent in 2009.
This was the third consecutive annual increase in the poverty rate. In 2010, approximately 23% of families in Orleans Parish
lived below the poverty level. It is important to note that poverty is not randomly distributed across the population. Findings
show that populations with marginal positions in the social structure (i.e., the young, minority, less educated, and women)
are more likely to live below the poverty level than those who occupy higher positions in the social structure (e.g., older,
white, more educated, and men). For families below the poverty level in Orleans Parish, findings show that families with
younger children have slightly higher rates of poverty (39.5%) compared to families with older children. Additionally, single-
headed households are significantly more likely to live below the poverty level (45.2%), than married couples (5.0%). Table
2 presents income distribution estimates for Orleans Parish, Louisiana and the U.S.
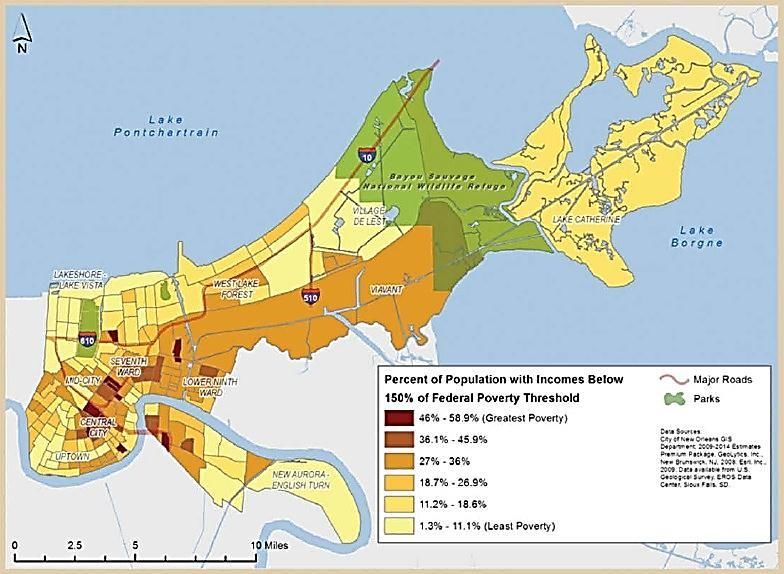
As previously mentioned, poverty is unequally distributed. Findings show persistent poverty in Central City, Seventh Ward,
and Lower Ninth Ward. Economically disadvantaged communities/neighborhoods have restricted access to jobs and
healthy foods and, in turn, poorer health outcomes. To assess poverty in neighborhoods a community risk index was
created. The community risk index measures the distribution of poverty across neighborhoods/communities in Orleans
Parish using , the following indicators: populations below 150% of the Federal Poverty Level (FPL), overcrowded
households, households without a vehicle, and vacant housing (higher scores index community poverty, material
deprivation, poorer housing conditions. The data in Table 3 highlights the percentage of individuals and families living below
the poverty level over the past year. Map 3 indicates that 84 Census tracks (46.4%) have a score higher than zero,
indicating a higher than average level of risk. Communities with the highest levels of risk are the Desire Development, Saint
Bernard, Central City, the Saint Thomas Development, and the Florida Development. Areas with the lowest risk include Old
Aurora, the Lake Terrace and Oaks, Lakeview, West End, Lakewood, Filmore, Little Woods and Read Boulevard East.
1“Real” refers to income after adjusting for inflation. All income values are adjusted to reflect 2010 dollars. The adjustment is based on percentage
changes in prices between 2010 and earlier years and is computed by dividing the annual average Consumer Price Index Research Series (CPI-U-
RS) for 2010 by the annual average for earlier years. The CPI-U-RS values for 1947 to 2010 are available in Appendix A and on the Internet at
www.census.gov/hhes/www /income/data/incpovhlth/2010/p60no239 _appacpitable.pdf Consumer prices between 2009 and 2010 increased by 1.7
percent.
2 This report utilizes the U.S. Census Bureau’s estimates of income and poverty which, are based solely on money income before taxes and do not
include the value of noncash benefits, such as nutritional assistance, Medicare, Medicaid, public housing, and employer-provided fringe benefits.
Page | 6NEW ORLEANS COMMUNITY HEALTH PROFILE
TABLE 2. Income Distribution for Orleans Parish, Louisiana and the US
INCOME AND BENEFITS
Orleans Parish LA US
IN 2010 INFLATION-ADJUSTED DOLLARS)
Total number of households 142,093 - 1,689,822 114,567,419
Nonfamily households 64,710 - 560,705 38,478,374
Less than $10,000 20,589 14.50% 9.8% 7.6%
$10,000 to $14,999 11,743 8.30% 7.5% 5.8%
$15,000 to $24,999 18,927 13.30% 13.6% 11.5%
$25,000 to $34,999 15,812 11.10% 10.9% 10.8%
$35,000 to $49,999 18,828 13.30% 14.4% 14.2%
$50,000 to $74,999 22,009 15.50% 17.0% 18.3%
$75,000 to $99,999 13,073 9.20% 10.9% 11.8%
$100,000 to $149,999 11,184 7.90% 10.1% 11.8%
$150,000 to $199,999 4,079 2.90% 3.0% 4.2%
$200,000 or more 5,849 4.10% 2.7% 3.9%
Mean household income (dollars) $59,554 $59,116 $68,259
Mean household income with Social Security $35,129 24.70% 28.4 28.4%
Mean Social Security income (dollars) $13,367 - $14,507 $16,236
Mean with food stamps/SNAP benefits in past 12
$22,309 19.1% 15.3% 11.9%
months
Mean family income (dollars) $70,914 - $69,092 $79,338
Mean nonfamily income (dollars) $44,215 - $36,435 $43,469
Per capita income (dollars) $25,082 - $22,862 $26,059
Source: U.S. Census Bureau, American Community Survey, 2010
TABLE 3. Percentage of Families and People Whose Income in the Past 12 Months is Below the
Poverty Level for Orleans Parish, Louisiana and the US
Orleans Parish LA US
All families 22.6% 14.5% 11.3%
With related children under 18 years 34.3% 22.6% 17.9%
With related children under 5 years only 39.5% 27.1% 19.3%
Married couple families 5.0% 5.1% 5.6%
With related children under 18 years 7.4% 7.1% 8.4%
With related children under 5 years only 10.7% 7.2% 7.6%
Families with female householder, no husband present 45.2% 37.1% 30.3%
With related children under 18 years 55.6% 46.5% 39.6%
With related children under 5 years only 55.8% 54.0% 47.7%
All people 27.2% 18.7% 15.3%
Under 18 years 42.0% 27.3% 21.6%
Related children under 18 years 42.0% 27.1% 21.2%
Related children under 5 years 50.1% 33.0% 25.0%
Related children 5 to 17 years 38.5% 24.7% 19.8%
18 years and over 23.0% 15.8% 13.3%
18 to 64 years 24.0% 16.7% 14.2%
65 years and over 17.1% 11.5% 9.0%
Source: U.S. Census Bureau, American Community Survey, 2010
Page | 7NEW ORLEANS COMMUNITY HEALTH PROFILE
MAP 3. POVERTY BY NEIGHBORHOOD IN ORLEANS PARISH
Source: Place Matters for Health in Orleans Parish, 2012
According to the World Health Organization (WHO) health is conceptualized as "the range of personal, social, economic
and environmental factors which determine the health status of individuals or populations. Therefore, family composition is
regarded as a health determinant in our social environment.” Because household composition and structure affect access to
health resources such as social support and, in turn, can serve as protective factors against poverty, chronic stressors or
daily quality of life issues, the variations in household structures in Orleans Parish were examined. There were
approximately 142,158 households in Orleans Parish in 2010. The majority of households in the Parish were composed of
residents living with family members (53.9%), compared to those households that were composed of non-kin residents or
roommates not related to them (46.1%). According to the U.S. Census Bureau, 22.7% of households reported living with
children under the age of 18 while 20.6% of family households were composed of adults 65 years and older. Of the
households with minor children, the majority are headed by single females (10.8%), compared to those headed by single
males (2.2%). While, nuclear3 family households make up 27.5% of Orleans Parish households, only 9.7% reported having
minor children. Table 4 presents housing structure of Orleans Parish, Louisiana and the U.S. Map 4 shows the percentage
3 A Nuclear family household is conceptualized as a two adult household with a husband and wife present.
Page | 8NEW ORLEANS COMMUNITY HEALTH PROFILE
of households that have repopulated as of December 2009 compared to those captured pre-Hurricane Katrina by the June
2005 US Census.
Table 4: Housing Population Characteristics1 for Orleans Parish, Louisiana and the
US
Orleans Parish LA US
HOUSEHOLDS BY TYPE
114,567,41
Total households 142, 158 - 142,093
9
Nonfamily households 65, 515 46.1% 45.5% 33.6%
Family households (families) 76, 643 53.9% 54.5% 66.4%
With own children under 18 32, 293 22.7% 23.1% 29.7%
Married-couple family 39, 078 27.5% 28.0% 48.6%
With children under 18 13, 860 9.7% 10.6% 20.0%
Male householder, no wife
7, 784 5.5% 5.1% 4.7%
present
With own children under 18 3,114 2.2% 1.3% 2.3%
Female householder, no
29, 781 20.9% 21.4% 13.1%
husband present
With own children under 18 15, 319 10.8% 11.1% 7.4%
Households with individuals
39, 412 27.7% 28.0% 33.1%
under 18 years
Households with individuals 65
29, 226 20.6% 20.6% 24.8%
years and over
HOUSING OCCUPANCY
131,791,06
Total housing units 189, 896 - 190,154
5
Occupied housing units 116,638 72.5% 74.7% 86.9%
Owner-occupied 57,548 49.3% 50.3% 65.4%
Renter-occupied 59,090 50.7% 49.7% 34.6%
Vacant housing units 44,299 27.5% 25.3% 13.1%
Source: U.S. Census Bureau, American Community Survey, 2010
Page | 9NEW ORLEANS COMMUNITY HEALTH PROFILE
MAP 4. PERCENT OF HOUSEHOLDS REPOPULATED, ORLEANS PARISH
Source: Place Matters for Health in Orleans Parish, 2012
Though the housing landscape is improving in New Orleans for most, a very visible homeless population still exists. Social
services are limited and mostly available to the chronically homeless. For example, there are two major general population
shelters, a male shelter, an adolescent shelter, a day shelter program, and a small number of church and nonprofit based
supportive programs for clients with a history of substance abuse. The demand for housing and supportive services in New
Orleans is great where those unable to qualify for shelters or transitional housing can be found sleeping along major
highways and intersections. According to Unity of Greater New Orleans’ Point in Time assessmentviii, conducted in February
2011, there are approximately 9,100 homeless people living in the Greater New Orleans area. Though the number of
homeless individuals in New Orleans decreased by about 3,000 people from the previous assessment, the chronically
homeless in our area is still almost double the national population. In general, our homeless tend to be an older male
population, most aged 45-61 years. In addition, 79% reported some medical, physical, or psychiatric disability.
Education is a strong indicator of income and occupational status which also influences health status. For example,
American adults with higher levels of education report higher earnings and lower unemployment ratesix. Specifically, adults
Page | 10NEW ORLEANS COMMUNITY HEALTH PROFILE
with less than a high school diploma earned less than half the income of their counterparts with a bachelor’s degree
($18,432 versus $47, 510). But even those with a high school diploma earned less than those adults who had attended
some high school ($26,140 versus 31,906). In 2010, 15.8% of adult residents, 25 years and older, of Orleans Parish
attained less than a high school diploma or equivalency, 25.1% had a high school diploma, 20.9% had some college
education, and 33.2% held a bachelor’s degree or higher. Because education and income are strongly correlated, income
and education distribution patterns are similar across neighborhoods. It is important to note that the aforementioned
communities are areas that have the highest percentages of the population with incomes less than 150% of the federal
poverty level. Table 5 shows distributions of educational attainment in Orleans Parish. Map 5 indicates that B.W. Cooper,
Central City, the Desire Area, the Desire Development have the largest percentage of population lacking a high school
education.
Table 5. Educational Attainment for Orleans Parish, Louisiana and the US
Highest Level of Education for population 25 years and
Orleans Parish LA US
over
Population 25 years and over 229,330 - 2,945,907 204,288,933
Less than 9th grade 12,191 5.3% 6.5% 6.1%
9th to 12th grade, no diploma 24,121 10.5% 11.6% 8.3%
High school graduate (includes equivalency) 57,661 25.1% 34.4% 28.5%
Some college, no degree 47,917 20.9% 21.0% 21.3%
Associate's degree 11,435 5.0% 5.1% 7.6%
Bachelor's degree 43,923 19.2% 14.4% 17.7%
Graduate or professional degree 32,082 14.0% 7.0% 10.4%
Source: U.S. Census Bureau, American Community Survey, 2010
MAP 5. EDUCATIONAL ATTAINMENT BY NEIGHBORHOOD IN ORLEANS PARISH
Source: Place Matters for Health in Orleans Parish, 2012
Page | 11NEW ORLEANS COMMUNITY HEALTH PROFILE
Employment status is also strong predictor of wellbeing and quality of life. The literature highlights that the health effects of
unemployment could be induced by socio-economic factors, such as financial strain and poverty. Orleans Parish has 63.1%
of the population over 16 years old in the labor force, where 53.7% of individuals self-reported as employed, and 9.2% were
unemployed. The majority of those employed (38.50%) work in management, business, science, and arts positions or
working within the educational services, healthcare, and social assistance industries. Table 6 illustrates employment status,
including occupation, industry and class of worker in Orleans Parish, Louisiana and the U.S.
TABLE 6. Employment Status for Orleans Parish, Louisiana and the US
Orleans Parish LA US
Population 16 years and over 281,961 - 3,550,438 243,832,923
Population 16 years and over In labor force 177,839 63.10% 2,203,490 64.4%
Civilian labor force 177,381 62.90% 61.6% 63.9%
Employed 151,493 53.70% 55.4% 57.0%
Unemployed 25,888 9.20% 6.2% 6.9%
Armed Forces 458 0.20% 0.4% 0.4%
Not in labor force 104,122 36.90% 37.9% 35.6%
OCCUPATION
Civilian employed population 16 years and over 151,493 - 1,967,523 139,033,928
Management, business, science, and arts occupations 58,293 38.50% 31.4% 35.9%
Service occupations 37,448 24.70% 18.9% 18.0%
Sales and office occupations 31,851 21.00% 24.9% 25.0%
Natural resources, construction, and maintenance occupations 10,042 6.60% 12.3% 9.1%
Production, transportation, and material moving occupations 13,859 9.10% 12.6% 11.9%
INDUSTRY
Civilian employed population 16 years and over 151,493 - 1,967,523 139,033,928
Agriculture, forestry, fishing and hunting, and mining 2,653 1.80% 4.2% 1.9%
Construction 8,312 5.50% 8.0% 6.2%
Manufacturing 7,120 4.70% 8.3% 10.4%
Wholesale trade 3,145 2.10% 2.7% 2.8%
Retail trade 12,768 8.40% 11.7% 11.7%
Transportation and warehousing, and utilities 7,540 5.00% 5.3% 4.9%
Information 2,415 1.60% 1.4% 2.2%
Finance and insurance, and real estate and rental and leasing 8,097 5.30% 5.5% 6.7%
Professional, scientific, and management, and administrative
16,497 10.90% 8.0% 10.6%
and waste management services
Educational services, and healthcare and social assistance 41,422 27.30% 23.9% 23.2%
Arts, entertainment, and recreation, and accommodation and
25,138 16.60% 9.7% 9.2%
food services
Other services, except public administration 6,988 4.60% 5.3% 5.0%
Public administration 9,398 6.20% 6.0% 5.2%
CLASS OF WORKER
Civilian employed population 16 years and over 151,493 - 1,967,523 139,033,928
Private wage and salary workers 117,490 77.60% 77.1% 78.3%
Government workers 25,242 16.70% 17.3% 15.3%
Self-employed in own not incorporated business workers 8,713 5.80% 5.6% 6.3%
Unpaid family workers 48 0.00% 0.1% 0.1%
Source: U.S. Census Bureau, American Community Survey, 2010
Page | 12NEW ORLEANS COMMUNITY HEALTH PROFILE
HEALTH STATUS, HEALTH OUTCOMES, AND LIFE EXPECTANCY
Available data measuring health outcomes and determinants of overall health show both the state of Louisiana and Orleans
Parish lag behind the nation on a number of indicators. Louisiana is consistently placed near the bottom of national health
rankings, currently 49th, according to the America’s Health Rankings project of the United Health Foundation. The report
highlights Louisiana’s high prevalence of obesity and diabetes, smoking, violent crime and childhood poverty as being
leading risk factors, as illustrated in Figure 1. Within Louisiana, Orleans Parish ranks 60th out of 64 metropolitan areas in
health outcomes and 27th of 64 in health factors according to the County Health Rankings & Roadmaps annual report.
Compared to statewide figures, New Orleans reports higher rates of premature deaths, percentage of low birthweight
babies, sexually transmitted infections, uninsured, children in poverty, and violent crime, as shown in Table 7.
Figure 1. Health Rankings for Louisiana 2011 NO. 1
Value Rank State
DETERMINANTS BEHAVIORS
Smoking (Percent of adult population) 22.1 44 9.1
Binge Drinking (Percent of adult population) 14.7 20 6.7
Obesity (Percent of adult population) 31.7 42 21.4
High School Graduation (Percent of incoming ninth graders) 63.5 48 89.6
COMMUNITY & ENVIRONMENT
Violent Crime (Offenses per 100,000 population) 549 44 122
Occupational Fatalities (Deaths per 100,000 workers) 8.4 48 2.5
Infectious Disease (Cases per 100,000 population) 19.6 48 2.3
Children in Poverty (Percent of persons under age 18) 30.5 49 6.2
Air Pollution (Micrograms of fine particles per cubic meter) 9.8 25 5.2
PUBLIC & HEALTH POLICIES
Lack of Health Insurance (Percent without health insurance) 17.2 36 5.0
Public Health Finding (Dollars per person) $99 16 $244
Immunization Coverage (Percent of children ages 19 to 35 months) 89.4 35 96.0
CLINICAL CARE
Early Prenatal Care (Percent with visit during first trimester) 86.7* 7 -
Primary Care Physicians (Number per 100,000 population) 117.9 23 191.9
Preventable Hospitalizations (per 1,000 Medicare enrollees) 93.2 47 25.6
ALL DETERMINANTS -0.57 50 .90
OUTCOMES
Diabetes (Percent of adult population) 10.3 41 5.3
Poor Mental Health Days (Days in previous 30 days) 3.9 41 2.3
Poor Physical Health Days (Days in previous 30 days) 4.2 44 2.6
Geographic Disparity (Relative standard deviation) 12.1 30 4.8
Infant Mortality (Deaths per 1,000 live births) 9.1 48 4.7
Cardiovascular Deaths (Deaths per 100,000 population) 318.9 45 197.2
Cancer Deaths (Deaths per 100,000 population) 215.3 47 137.4
Premature Deaths (Deaths per 100,000 population) 10,331 48 5481
ALL OUTCOMES -0.25 48 0.32
OVERALL -0.82 49 1.20
-Indicates data not available. *See measure description for full details.
Source: United Health Foundation: America’s Health Rankings, 2011.
Page | 13NEW ORLEANS COMMUNITY HEALTH PROFILE
Table7. Orleans Parish Health Rankings
Orleans Error National Louisiana Rank (of
Margin Benchmark* 64)
Health Outcomes 60
Mortality 62
Premature death 13,987 13,447-14,528 5,466 10,361
Morbidity 45
Poor or fair health 18% 16-20% 10% 19%
Poor physical health days 3.5 3.1-3.9 2.6 3.7
Poor mental health days 3.6 3.2-4.0 2.3 3.2
Low birth weight 13.4% 13.0-13.7% 6.0% 11.0%
Health Factors 27
Health Behaviors 11
Adult smoking 21% 18-23% 14% 22%
Adult obesity 30% 27-33% 25% 33%
Physical inactivity 29% 26-32% 21% 30%
Excessive drinking 19% 16-21% 8% 15%
Motor vehicle crash death rate 13 12-15 12 22
Sexually transmitted infections 1,152 84 626
Teen birth rate 55 53-56 22 55
Clinical Care 20
Uninsured 27% 25-29% 11% 20%
Primary care physicians 526:1 631:1 863:1
Preventable hospital stays 59 56-63 49 93
Diabetic screening 74% 71-78% 89% 79%
Mammography screening 60% 59-68% 74% 63%
Social & Economic Factors 52
High school graduation 66% 67%
Some college 61% 59-64% 68% 52%
Unemployment 8.8% 5.4% 7.5%
Children in poverty 41% 36-46% 13% 27%
Inadequate social support 25% 23-28% 14% 23%
Children in single-parent households 60% 58-63% 20% 41%
Violent crime rate 1,074 73 676
Physical Environment 21
Air pollution-particulate matter days 2 0 4
Air pollution-ozone days 5 0 7
Access to recreational facilities 6 16 9
Limited access to healthy foods 21% 0% 14%
Fast food restaurants 41% 25% 53%
* 90th percentile, i.e., only 10% are better Note: Blank values reflect unreliable or missing
data
Source: County Health Rankings & Roadmaps, 2012 LA report
Page | 14NEW ORLEANS COMMUNITY HEALTH PROFILE
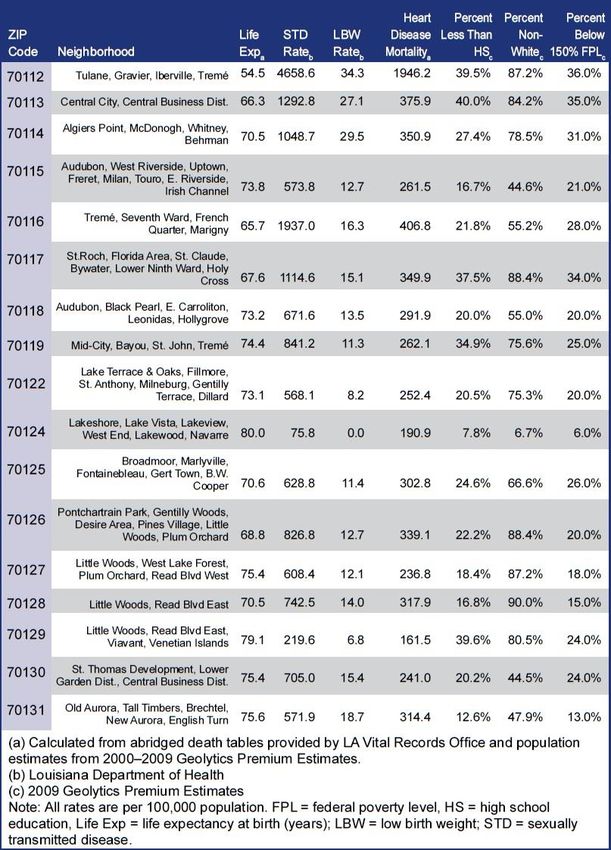
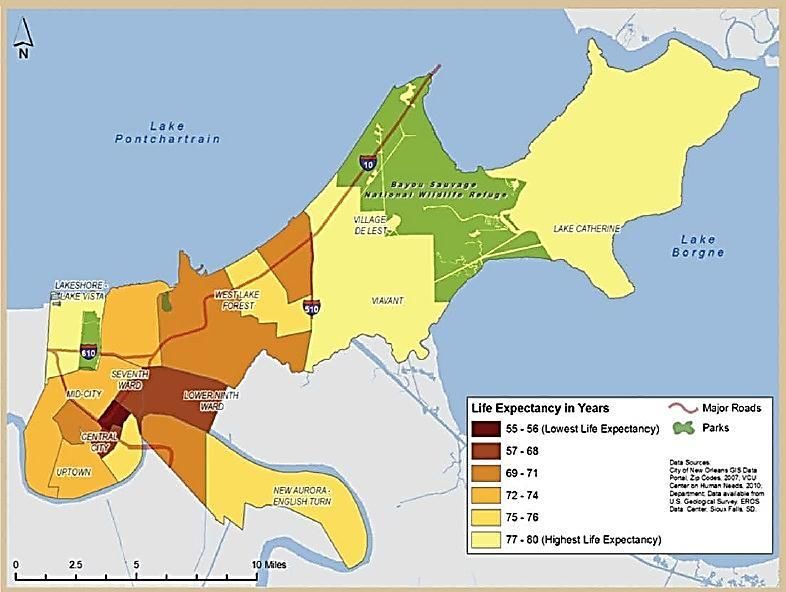
While many studies demonstrate the linkage between income and health-related outcomes, the relationship between
communities that have high levels of poverty and corresponding high rates of chronic illnesses, like diabetes and heart
disease, is most notable. More specifically, studies show that mortality and morbidity rates are unevenly distributed across
the neighborhood level with less educated and economically disadvantaged neighborhoods reporting disproportionately
poorer health outcomes. For example, in the Tulane, Gravier, Iberville, and Treme neighborhoods (zip code 70112) 36% of
the population lives below the Federal Poverty Level (FPL). This community not only represents the highest proportion
people living below the FPL in the New Orleans but also reports some of the poorest health outcomes (i.e., highest STD
rate, highest rate of heart disease and the lowest life expectancy) outcomes compared to other areas. In comparison, zip
code 70124 has the lowest rate of poverty in the city and significantly better health outcomes. Figure 2 and Map 6 present
health outcomes including life expectancy by zip code and neighborhood.
MAP 6. LIFE EXPECTANCY IN YEARS BY NEIGHBORHOOD
Source: Place Matters for Health in Orleans Parish, 2012
Page | 15NEW ORLEANS COMMUNITY HEALTH PROFILE
FIGURE 2. HEALTH OUTCOMES BY ZIP CODE
Source: Place Matters for Health in Orleans Parish, 2012
Page | 16NEW ORLEANS COMMUNITY HEALTH PROFILE
A CCESS TO H EALTHCARE
Access to healthcare is largely affected by a patient’s health insurance status. Uninsured individuals use fewer healthcare
services and, in turn, are more likely to suffer adverse health outcomes than individuals with private insurance coverage.
Lack of insurance also has adverse effects on health status and physical functioningx. Like all health resources, there are
healthcare variations across race, household structures, and incomes. For example, national rates and numbers of
uninsured non-Hispanic Whites in 2010 was 11.7% (approximately 23.1 million). For Blacks in the same year, the number of
uninsured individuals was 20.8%. Additionally, the national rate of uninsured individuals was higher among people with
lower incomes compared to their more affluent counterparts. In 2010, 26.9% of people in households with annual incomes
of less than $25,000 had no health insurance coverage. As household income increased, the uninsured rate decreased
where 21.8% of people in households with incomes ranging from $25,000 to $49,999 were uninsured, 15.4% of people in
households with incomes ranging from $50,000 to $74,999 were uninsured, and 8% of people in households with incomes
of $75,000 or more also remained uninsured. Table 8 shows the distribution of health insurance coverage in Orleans Parish.
TABLE 8. Health Insurance Coverage for Orleans Parish, Louisiana and the US
Orleans Parish LA US
Civilian non-institutionalized population 346,224 - 4,440,314 304,287,836
With health insurance coverage 280,795 81.10% 82.2% 84.5%
With private health insurance 185,982 53.70% 58.4% 65.8%
With public coverage 124,573 36.00% 34.0% 29.7%
No health insurance coverage 65,429 18.90% 17.8% 15.5%
Civilian non-institutionalized population under 18 years 73,806 73,806 1,113,329 74,017,524
No health insurance coverage 4,007 5.40% 5.5% 8%
Civilian non-institutionalized population 18 to 64 years 234,013 - 2,788,424 191,138,060
In labor force: 170,650 - 2,068,145 147,410,050
Employed: 145,883 - 1,863,173 131,727,379
With health insurance coverage 113,240 77.60% 77.0% 82.0%
With private health insurance 105,008 72.00% 72.8% 77.7%
With public coverage 11,327 7.80% 6.3% 6.3%
No health insurance coverage 32,643 22.40% 23.0% 18.0%
Unemployed: 24,767 24,767 204,972 15,682,671
With health insurance coverage 12,297 49.70% 43.3% 52.3%
With private health insurance 5,559 22.40% 24.3% 34.4%
With public coverage 7,542 30.50% 21.4% 20.1%
No health insurance coverage 12,470 50.30% 56.7% 47.7%
Not in labor force: 63,363 - 720,279 43,728,010
With health insurance coverage 47,172 74.40% 74.8% 77.7%
With private health insurance 28,497 45.00% 45.1% 51.2%
With public coverage 23,163 36.60% 36.7% 32.9%
No health insurance coverage 16,191 25.60% 25.2% 22.3%
Source: U.S. Census Bureau, American Community Survey, 2010
Page | 17NEW ORLEANS COMMUNITY HEALTH PROFILE
Between 2009 and 2011, the number of uninsured adults increased in the New Orleans region from 100,222 to 126,101,
which caused rates of uninsured adults to rise from 20.2% to 24.1%. For adults under 200% of the FPL, 14,188 people
became uninsured between 2009 and 2011, raising the percent of uninsured adults 19-64 under 200% FPL to 35.7%. A
higher percentage of adults without a child in the household are uninsured at 26%, compared to 19.5% of adults with at
least one child in the household. In 2010 specifically, 81% of individuals residing in Orleans Parish reported health
insurance coverage where 54% reported private insurance coverage compared to 36% with coverage from public programs
(e.g., Medicaid, Medicare). In addition, 22% of employed individuals lacked health insurance coverage.
The widespread devastation of Hurricane Katrina gravely impacted healthcare infrastructure across the continuum of care,
from basic 911 to primary care to hospital services in New Orleansxi. These challenges with the city’s healthcare
infrastructure also gave way to unprecedented opportunity to redesign a major American health sector from the ground upxii.
The primary reason for taking on such a massive effort came from the long-standing poor performance of the system and
poor health outcomes of the population; both causes rooted in systematic disrepair as evidenced by the low density of
primary care physicians per population, high density of specialty care physicians, and higher number of hospital beds per
capita than the national averagexiii. Also, access to community-based primary care and prevention was challenging for the
city’s most vulnerable populations, low-income residents and the uninsured, where in lieu of primary care these populations
relied heavily on emergency rooms for their care. A trend repeated throughout Louisiana, which has the 8th highest
emergency room visit rate per capita in the nationxiv.
The primary care safety-net in the Greater New Orleans area has grown rapidly in the past seven years since Hurricane
Katrina. Currently it ranks in the top 10% nationally and has the capacity to reach 80% of the city’s low-income population.
Greater New Orleans has 102 access points for uninsured, under-insured, and low-income residents, 72 of which include
primary care services. Over 200,000 people receive their care from more than 450 health care professionals at these health
care sites. The network of community clinics in New Orleans has also greatly improved. At present, 18 organizations and 51
clinical sites offer ongoing, coordinated primary care services in the Greater New Orleans area. Because of demonstrated
success in developing patient-centered medical home facilities, integrating primary care and mental health services, and
creating new payment models to support team-based, innovative primary care services U.S. Secretary of Health and
Human Services (HHS) Kathleen Sebelius has recognized it as a national model. These clinics are easily accessible with a
reported average wait time to schedule an appointment of less than one week. Throughout the system, medical services are
also offered at various clinics in seven different languages. Increasingly these clinics are poised to go beyond traditional
medical care services, to also provide health services including prescription assistance programs, counseling, health
education, support groups, community gardens, social services case management, and Medicaid enrollment. Though the
safety-net is a dramatic improvement over past dependence on emergency rooms for primary care, it is still unstable and
heavily reliant on public funds, especially for care to the uninsured.
Page | 18You can also read