Understanding and Tackling Micromobility: Transportation's New Disruptor - Let's go! - Governors ...
←
→
Page content transcription
If your browser does not render page correctly, please read the page content below
Understanding and
        Tackling Micromobility:
         Transportation's New Disruptor

                                                                   MAIN ST
                                                      SPRING AVE

                                                    Let’s go!

This publication is made possible by a grant from
                                                    PAG E 1 o f 4 4
                                                                             August 2020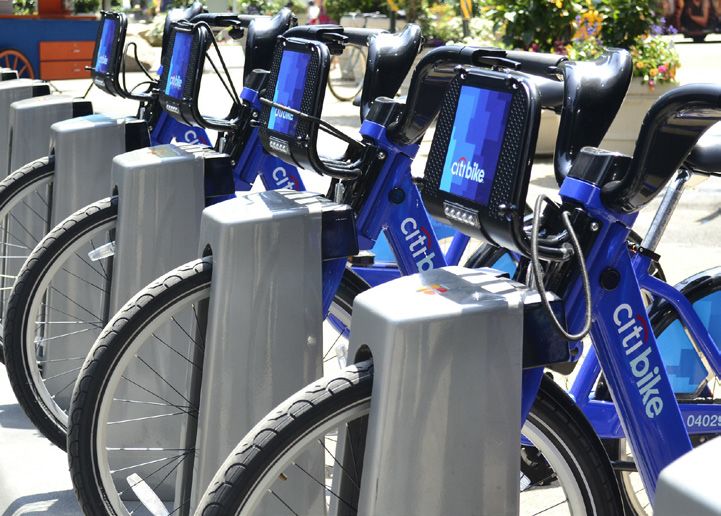
Contributors
 This publication was researched and written by Pam Shadel Fischer, GHSA’s Senior Director of External
 Engagement. The publication was prepared with the assistance of an expert panel:

 Jonathan Adkins                                                       Jason JonMichael
 Executive Director, Governors Highway Safety Association              Assistant Director, Austin Transportation Department
 Washington, DC                                                        Austin, TX

 Ruth Esteban*                                                         Nicole Payne
 Highway Safety Specialist, National Highway Traffic Safety            Program Manager, National Association of City Transportation
 Administration                                                        Officials
 Washington, DC                                                        New York City, NY

 Dr. Staci Hoff                                                        Tamara Redmon*
 Research Director, Washington Traffic Safety Commission               Pedestrian Safety Program Manager, Federal Highway
 Olympia, WA                                                           Administration
                                                                       Washington, DC
 Colin Hughes
 Senior Policy Manager, New Mobility, Lyft                             Steve Roberson
 Washington, DC                                                        Senior Research System Analyst, State Farm®
                                                                       Bloomington, IL
 Ken McLeod
 Policy Director, League of American Bicyclists                        Sharada Strasmore
 Washington, DC                                                        Shared Micromobility Planner, District Department of Transportation
                                                                       Washington, DC
  *Served in advisory capacity

  Russ Martin, Senior Director of Policy and Government Relations, GHSA, reviewed and edited the
  publication. Creative by Brad Amburn.

  Cover: Designed by Brad Amburn. Please note GO is a fictional micromobility provider.

  This publication is primarily directed to Governors Highway Safety Association (GHSA) members,
  who consist of the state and territorial Highway Safety Offices, which are tasked with addressing the
  behavioral safety issues that plague the nation’s roadways and contribute to the vast majority of traffic
  crashes. It is not intended to be inclusive of all policies or programs, nor does inclusion of a policy or
  program imply endorsement by GHSA, State Farm® or the expert panel. Rather it is intended to foster
  discussion and action that advances the safety of all roadway users. While SHSOs are the primary
  audience, advocates, educators, elected officials, micromobility providers and system operators, and
  planning and transportation professionals will also find it instructive.

  Why State Highway Safety Offices and Their Partners Should Read This Publication
  Micromobility is a new and emerging issue that merits your attention as people who use this mode
  have a right to the road. But just like other modes of transportation, micromobility is not without its
  challenges. This publication, which is funded by State Farm®, explores six of those challenges—
  oversight, funding, data collection, enforcement, infrastructure and education—and the role your
  State Highway Safety Office (SHSOs) and partners can play to help address them.

  GHSA consulted with an expert panel of federal, state and local highway safety officials, bicycle
  and rideshare advocates, and micromobility providers as well as public health professionals and
  others working in this arena to gain a better understanding of the challenges and potential solutions
  discussed in this publication. Several months into these discussions, COVID-19 erupted in the
  U.S., impacting the mobility of every segment of society. The pandemic has forced us to rethink
  transportation, particularly in cities where many people rely on mass transit to get around. Therefore,
  the pandemic along with expert insights, survey results and online research informed this work.

                                                              PAG E 2 o f 4 4
Introduction
               Disruptive—problematic, destructive, radical change sparked by innovation

  More than a century ago, mass production of the
  Model T disrupted the nation’s economic and social
  character as the assembly line ushered in a new era
  of mobility for all. The smartphone is this century’s
  disruptor making possible a new form of shared                                                   MAIN ST

  mobility that includes not only cars, but also pedal-
  powered and electric bicycles (e-bikes), standing and
  seated electric scooters (e-scooters), and electric
  skateboards and skates. These bicycles, scooters
  and other small devices are part of an evolving class

                                                                                      SPRING AVE
  of vehicles referred to as micromobility or personal
  transportation devices (PTDs). They’re typically
  low speed (under 30 mph), light weight (less than
                                                                                    Let’s go!
  100 pounds) and partially or fully motorized and
  may be personally owned or part of a shared fleet
  (Pedestrian and Bicycle Information Center & Society of       The smartphone is this century’s disruptor, enabling
  Automotive Engineers as cited in Goodman et al., 2019).       greater shared mobility. (Please note GO is a fictional
                                                                micromobility provider.)
  (See the chart on page 19.)

  Interestingly, disruptive is the term frequently used by urban transportation and planning officials
  to describe micromobility. However, electric bicycles are hardly disruptive or new. The first e-bike
  patents were awarded in the late 19th century. But the first commercially successful models
  would not appear until 1997, with worldwide mass production following several years later. Electric
  powered scooters, skateboards and skates, previously unpowered children’s toys, have been
  transformed into adult conveyances, with e-scooters becoming a preferred mode of travel for many
  18–34-year-old urbanites and college students.

  In the U.S., pedal-powered rather than e-bikes and scooters heralded the start of shared mobility
  when the first docked (or station-based) bike system launched in Tulsa, OK in 2007. More than a
  dozen years later, there are 190 systems across the country, including New York City’s Citi Bike, the
  nation’s largest. Launched in 2013, Citi Bike set a single day record of 100,000 rides in September
  2019 and achieved its 100 millionth ride in July (Change, 2020; City of New York, 2020).

  E-scooters, which began appearing overnight on city streets in 2018, may seem
  child-like in their appearance. But these dockless vehicles (unlike docked vehicles,                       40+
  these do not have a fixed home location and may be dropped off and picked up                               The number
                                                                                                             of U.S.
  from arbitrary locations) quickly overtook station-based bike share and established
                                                                                                             bike-share
  micromobility as a legitimate, albeit controversial, transportation mode. As a result,                     programs
  some bike share systems have gone dockless—and electric. Currently, more than 40                           with electric
  U.S. bike-share programs now have electric fleets (Lee et al., 2019), with that number                     fleets.
  expected to grow.

                                              PAG E 3 o f 4 4
The Pandemic’s Impact on Micromobility
  When the World Health Organization declared coronavirus a worldwide pandemic on March 11,
  2020, and states began putting shelter-in-place orders into effect, travel all but stopped. People,
  however, still had to go out for groceries and check on loved ones, while those deemed essential
  needed to get to work. As the virus quickly spread, use of mass transit fell to historic lows as
  people, who could, refrained from riding buses, trains and subways to avoid being in close quarters
  with others. Some systems also reduced service hours and/or routes forcing those who could not
  work from home to find other commuting options.

  Many people in cities turned to micromobility. In New
  York, bikeshare ridership jumped 67 percent in mid-March
  compared to 2019, while bike check-outs on Chicago’s
  Divvy program more than doubled the first two weeks of
  March compared to last year. However, once lockdowns and
  mandatory shelter-in-place orders took effect, micromobility
  use dropped and some systems shut down (Shared-Use
  Mobility Center, 2020). Those providers that continued to
  operate, instituted extra cleaning and disinfecting measures.                              67%
  Many systems offered free rides to essential workers or                                    the uptick
  deeply discounted rates to provide open-air, socially distant transportation, while        in Citi Bike
                                                                                             ridership in
  systems in Kansas City, Detroit, Memphis and the Big Island of Hawaii, for example,
                                                                                             March 2020
  offered unlimited free rides for all. Some systems partnered with restaurants and
                                                                                             compared to
  food delivery services to help them fulfill orders, with one provider, Wheels, offering    last year.
  e-bikes equipped with self-cleaning handlebars and brake levers.

  As cities have reopened, micromobility providers are hopeful the continued need to social distance
  will result in far greater demand for service. An April 2020 survey of 25,000 Americans found
  that of those who regularly ride mass transit, 20 percent would no longer do so, while another 28
  percent would do so less often (IBM, 2020). A month later, micromobility providers in Columbus,
  OH, Oklahoma City, OK, and Washington, DC were reporting the length of e-scooter rides was
  increasing, suggesting “riders [were] making their full commutes on the vehicles rather than for
  first-mile, last-mile trips” as had been the norm before the pandemic (Lazo, 2020). Meanwhile,
  Chicago officials announced they would partner with three e-scooter vendors to conduct another
  four-month pilot program starting this July that would make 10,000 scooters (up from 2,500)
  available throughout much of the city (Wisniewski, 2020).

  Use of these devices may go beyond shared systems as sales of on-road bicycles, including
  e-bikes, surged during the pandemic, with one New York City retailer recording sales of 600
  percent compared to last year (Goldbaum, 2020). A recent study commissioned by Deloitte
  predicted use of e-bikes worldwide will grow 50 percent by 2023 (Lee et al., 2020). Most e-bikes
  will travel at least 25 miles or farther depending on the level of power assist the rider engages.
  They can also be used to haul gear and transport packages and food to customers. In March, New
  York City’s comptroller released a report encouraging the city to subsidize frontline workers who
  may be interested in purchasing e-bikes to hasten their travel time (Hawkins & Ricker, 2020). Then

                                                PAG E 4 o f 4 4
on April 1, New York state’s ban on e-bikes and scooters was rescinded giving communities the
  ability to allow and regulate them (Hawkins, 2020).

  During the height of the pandemic, some cities closed streets to cars and opened them exclusively
  to pedal and e-bicycles, e-scooters and pedestrians. Oakland, CA was the first to do this launching
  its Slow Streets program on April 11. By early June, over 20 miles of slow streets had been installed
  along 19 corridors throughout the city (City of Oakland, 2020). Seattle also closed 20 miles of
  roads—dubbed Stay Healthy Streets—that had limited open space, low rates of car ownership
  and were along routes to essential services including takeout meals. Those closures became
  permanent in May, making Seattle the first U.S. city to commit to such a measure. The city is also
  accelerating efforts to install biking infrastructure including greenways and protected bike lanes
  (Portfield, 2020; Zipper, 2020). Across the nation, micromobility providers and pedestrian and
  bicycling advocates have been urging other cities to follow suit.

Micromobility: Far from a Passing Craze
  There is no doubt that COVID-19 negatively impacted micromobility, as many providers slashed
  their workforce and removed bikes and scooters from cities either voluntarily or under government
  order. But industry watchers are predicting that until there is a treatment and/or vaccine for the
  virus, people will remain hesitant about being in crowds and continue to seek other forms of
  transportation (Nicklesburg, 2020). Micromobility can help fill that need now and well into the
  future. Before addressing the challenges, however, it is important for SHSOs to understand that
  micromobility is far from a passing craze.

  Ridership Growth
  Since 2010, there have been 207 million trips on shared bikes (pedal and electric-powered) and
  e-scooters in the United States. A total of 84 million of those trips occurred in 2018 (the latest
  year for which data is available), double the number taken the previous year. Those 84 million trips
  included 36.5 million on station-based bike share, 9 million on dockless bikes and 38.5 million on
  e-scooters (National Association of City Transportation Officials [NACTO], 2019).

  Of the three micromobility modes, e-scooters overtook bikes as the
  preferred vehicle for dockless providers and by the end of 2018 there were         85,000
  approximately 85,000 scooters operating in nearly 100 U.S. cities. Three           scooters were
  metropolitan areas—Los Angeles, San Diego and Austin—accounted for                 operating in nearly
                                                                                     100 U.S. cities in 2018.
  the largest concentration of all e-scooter trips (40 percent) in that year
  (NACTO, 2019).

  Station-based bike share systems also expanded their fleets by 9 percent in 2018 (57,000 bikes),
  sparking upticks in ridership. For example, Ford GoBike grew 10-fold in the San Francisco Bay Area
  increasing ridership by 260 percent, while Honolulu’s Biki grew 30 percent and rides jumped 200
  percent. Boston’s Bluebikes not only expanded by 40 percent and gained 30 percent more riders,
  but also increased its coverage area. By the end of 2018, 85 percent of all city residents lived
  within a five to seven-minute walk of a Bluebikes station, up 67 percent from 2017 (NACTO, 2019).

                                               PAG E 5 o f 4 4
2011      2012      2013       2014         2015      2016       2017      2018

 2010                                                                                          2019
 Since 2010, there have been 207 million trips             There were 135 million trips in 2019 alone,
 on shared bikes (pedal and electric-powered)              including 40 million on station-based bike
 and e-scooters in the United States.                         share, 10 million on dockless bikes, and
                                                                              86 million on e-scooters.

While pedal-powered bikes accounted for the greatest share of station-based system rides in
2018 at 30 million, station-based e-bikes (6.5 million) had double the usage of their non-electric
counterparts. Madison, WI converted its entire bike share fleet to electric in 2019 and found that
e-bikes generated “up to five times as many trips as standard bikes,” while usage declined in
cities where e-bikes were removed from their systems’ fleets (Anzilotti, 2019b). As a result, San
Francisco, Minneapolis and New York are just a few of the cities transitioning all or a portion of
their fleets from pedal to electric bikes in collaboration with providers (NACTO, 2019).

In 2018 the average bike share trip covered 2.5 miles and lasted just under 25 minutes, while the
average e-scooter trip traversed 1.5 miles and lasted approximately 17 minutes. The largest bike
share systems were more heavily used, on a per-bike basis, than smaller systems. The opposite
holds true for e-scooter systems as the largest fleets were used less than once per day, while
smaller fleets were used more than four times per day. The greatest use of station-based bikes
occurred during traditional rush hours, while scooter trips were dispersed throughout the day,
with the most ridership on Fridays and weekends. Surveys of riders in cities across the U.S., found
station-based bike share users are more likely to ride to get to and from work and to connect to
transit. The opposite is true for e-scooter riders who are more apt to use the device for social,
shopping and recreational purposes (NACTO, 2019), with tourists accounting for a significant share
of ridership in some major cities (Gauquelin & Chamussy, 2020).

Micromobility use continued to grow in 2019 as people took 136 million trips on shared bikes,
e-bikes and e-scooters. This is a 60 percent increase over the previous year that was largely driven
by a 45 percent increase in dockless e-scooter programs (NACTO, 2020a). Austin, for example,
recorded 5.3 million rides in 2019 (City of Austin, 2020a), while Los Angeles had one million scooter
and dockless bike rides per month last year. And Lime, which was operating micromobility fleets
worldwide, marked a milestone in September 2019—its 100 millionth ride (Schneider, 2020).

                                             PAG E 6 o f 4 4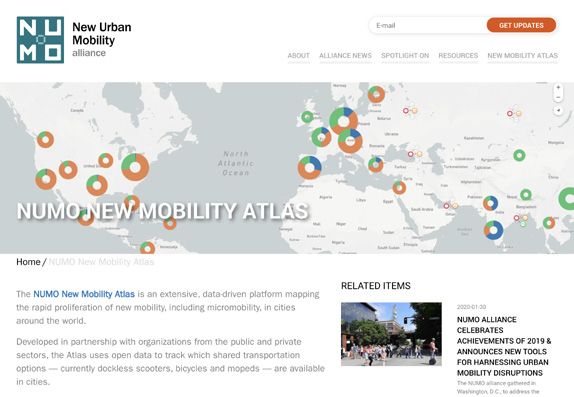
A Viable Transportation Alternative
Micromobility—unlike trains, buses and subways—allows for social distancing. But in a pre-
pandemic world, some people without the means, ability or desire to own a vehicle choose to get
around via e-bikes and scooters. And they likely recognize and appreciate micromobility’s value
even more since the pandemic.

          Car speeds in cities have slowed, making micromobility a faster mode of travel.

        4.7 mph                                                                   15 mph
       average car                                                               average max
        speed in                                                               e-scooter speed
   midtown Manhattan
         in 2017

Car travel speeds in cities had been getting slower pre-pandemic, making micromobility a faster
alternative. In midtown Manhattan, for example, cars traveled an average of 4.7 miles per hour
in 2017 (Agrawal as cited in Lee et al., 2019). Shared e-bikes and e-scooters typically have a
top-speed of 20 and 15 mph, respectively, making them a faster alternative. Speed of travel is
important to riders. In Copenhagen, where 62 percent of the population bikes to work or school,
more said getting there faster (49 percent)—rather than health benefits, cost savings or the
environment—is their primary motive for cycling (Lee et al., 2019). Then there’s gridlock and
parking; unlike cars and trucks, bike and scooter riders take up less space and do not have to circle
the block to find a place to park – or pay for the privilege.

E-bikes and scooters can not only make getting to a destination faster, but also enable the rider to
do so without breaking a sweat. Both devices –unlike pedal bikes –require less or no output on the
part of the rider. E-bikes are especially convenient for older adults and people with limited mobility,
as the rider can pedal a little or a lot. Proponents of e-bikes also point to the device’s health benefit,
suggesting that riding one “isn’t cheating,” as users
get additional exercise because they ride more
often and for longer distances (Krug, 2020). Having
access to an e-bike might also prompt someone to
pick up their bike helmet rather than their car keys
to run an errand or commute to work.

Scooters, on the other hand, require a bit more
physical prowess, which is why these devices are
evolving to accommodate different body types
and comfort levels. In Portland, OR micromobility
providers Razor and Shared offer e-scooters with
                                                                 Detroit’s Adaptive MoGo program meets a wide
seats for people with disabilities. The seated                   range of rider needs.
e-scooters also have larger wheels and wider

                                               PAG E 7 o f 4 4
tires than stand-up scooters. Meanwhile, Detroit’s Adaptive MoGo (bikeshare) program had begun
offering 13 different cycles including recumbent, upright cargo, hand and tandem tricycles to
accommodate a wide range of rider needs in 2018. However, the program is currently postponed
due to the pandemic (MoGo, 2020).

Concerns about locating a micromobility system (either docked or dockless) and whether a device
is available are also being addressed. Provider apps, for example, can pinpoint the location of
available devices and their prices as measured by range. Google Maps displays the location of bike
sharing stations and how many bikes are available in 24 cities around the world including Chicago,
Los Angeles, New York and San Francisco. The app also provides the location of Lime scooters in
many U.S. cities and directions to and from the closest bike sharing stations in ten cities including
Chicago, New York, San Francisco and Washington, DC (Smith, 2020).

The New Urban Mobility Alliance launched an online platform,
New Mobility Atlas, in late 2019 to map the growth of new
mobility in cities. It uses open data to track the availability of
shared transportation options including dockless scooters, bikes
and mopeds. In response to the pandemic, the North American
Bikeshare Association (NABSA) created a COVID-19 Tracker that
identifies micromobility shared services for each state/city and
whether each is operating, offering free or reduced prices and
additional services such as support to health care facilities and       The New Mobility Atlas tracks shared
delivery services.                                                      transportation options in cities.

Potential riders can also get help from the U.S. Department of Transportation’s (U.S. DOT) Bureau
of Transportation Statistics’ (BTS) interactive bikeshare and e-scooter map, which shows, by city,
the name of the system serving the area (the site is current as of November 2019).
For cities with a docked bike share system, the map allows users to zoom in on the
location of a docking station at street level. Bike share systems with fixed docking
stations are also included in the BTS’ Intermodal Passenger Connectivity Database
(IPCD), which includes information about passenger transportation facilities.
According to the IPCD, 71 percent of all bike share docking stations are located
within one block of another public transportation mode such as a bus or train, while        The
13 percent are within two blocks (U.S. DOT, 2019). That is why transit aggregator           Transit app
                                                                                            provides
apps like Transit are gaining popularity with micromobility users. The app provides
                                                                                            real-time
real-time information for buses, trains, bikes, e-scooters, car share and ride hail         mobility
services in 188 cities/regions in the U.S., giving riders the ability to easily mix and     information.
match modes to help them get where they want to go (Transit, 2020).

Finally, micromobility providers recognize the public’s pandemic-driven concern about hygiene.
While e-bikes and e-scooters have a built-in social distancing mechanism—one-rider-only—
ensuring they are disinfected between riders is an issue. As noted earlier, Wheels has partnered
with NanoSeptic to cover its devices’ cover grips and brake levers with a self-cleaning material
designed to reduce transmission of the virus (Gauquelin & Chamussy, 2020). To prevent the
spread of COVID-19 in Austin, on March 17, 2020, the City’s Transportation Department required

                                             PAG E 8 o f 4 4
all providers to reduce their fleets by 10 percent due to the decrease in ridership, remove all non-
  operational devices and institute sanitation measures for those devices remaining in operation on
  the city’s right-of-way (J. JonMichael, personal conversation, July 1, 2020).

  Meanwhile, PTD providers Pony, Spin and Wheels have found a way to eliminate the need to
  disinfect their vehicles between riders. They have changed their business model from casual users
  to regulars by testing long-term rentals for shared bikes and scooters. Micromobility proponents
  call this a “good try before you buy option,” with Wheels and Pony (the latter is dubbed Adopt-A-
  Pony) now selling devices directly to the public (Gauquelin & Chamussy, 2020).

The Safety of Micromobility
  Micromobility generated significant press coverage in 2018 and 2019 due mostly to the
  proliferation of e-scooters, which (as discussed earlier) began appearing on local streets as an
  adult conveyance rather than a children’s toy. The news stories typically focused on concerns about
  scooters being operated and parked on sidewalks, as well as the potential for riders to be seriously
  injured or killed. The latter was sparked by a series of research studies that examined medical
  records and emergency room data related to e-scooter incidents. Just like other transportation
  modes, the research confirms e-scooters and e-bikes are involved in crashes and people are injured
  and killed. However, research conducted by e-scooter provider, Bird, contends that “more people
  are injured by motor vehicles in three hours in the U.S. than are injured by e-scooters in a year”
  (Bird, 2019a). According to the International Transport Forum (ITF), “e-scooter riders do not face
  significantly higher risk of road traffic death or injury than cyclists” and roads would be “safer if
  e-scooter and bicycle trips replace travel by car or motorcycle” (2020).

  E-Scooters
  Using data from the National Electronic Injury Surveillance
  System (NEISS), one study found that between 2014 and 2018               222–365%
  the number of e-scooter injuries and hospital admissions in                the jump in hospital admissions
  the U.S. increased 222 percent and 365 percent, respectively.              for e-scooter injuries between
                                                                             2014 and 2018.
  During the same time period, the rate of scooter crashes
  increased from six per 100,000 people to 19 per 100,000 with
  fractures, contusions/abrasions and lacerations the most
  prevalent injuries. The researchers also noted there was a large
  increase in injuries between 2017 and 2018, rising from 8,016 to
  14,651 (2018 marked the unofficial start of e-scooter programs
  in many locales), and the rate of head trauma for scooter riders
  was double that of bicyclists (Namiri et al., 2020). It is important to note that the researchers were
  not able to distinguish between standing and seated scooters or to account for ridership exposure.
  The explosion in the number of e-scooters beginning in 2018 must be also taken in account when
  reviewing crash and injury data. According to the National Association of City Transportation
  Officials (NACTO), between 2010 and 2016 there were 88 million shared mobility trips in the U.S.
  However, those trips were taken on bike share, not e-scooters (NACTO, 2020b).

                                               PAG E 9 o f 4 4
These injury and head trauma rates mirror findings of an Austin study conducted by the city’s
Public Health (APH) Department, with support from the Centers for Disease Control and Prevention
(CDC). Researchers identified 271 people with potential scooter crash-related injuries and
interviewed slightly more than half. They learned that 45 percent of the crashes involved head
injuries, with 15 percent suffering traumatic brain injuries. Less than one percent of the riders were
wearing a helmet. Unlike the NEISS study, however, the APH had access to exposure data (number
of trips, miles and hours ridden) and found that for every 100,000 trips taken, 20 individuals were
injured (APH, 2019).

These studies along with several others also examined causation factors. Most scooter injuries
were the result of falls, collisions with objects such as light poles, manhole covers or curbs or
crashes involving motor vehicles. However, the latter were not as prevalent as might be expected.
In the Austin study, for example, 16 percent of the incidents involved a rider either “colliding and
swerving, stopping or jumping off a scooter to avoid a collision” with a motor vehicle, while 10
percent of injured riders actually collided with a motor vehicle. (The latter, however, were more
likely to result in significant injuries.) Instead, the roadway condition – potholes, cracks in the
pavement – played a much larger role (50 percent), with a third of riders injured on sidewalks and
slightly more than half in the street (APH, 2019).

Other factors identified in the studies included inexperience, alcohol and speed. In
Austin one-third of those injured were first-time riders, while more than 60 percent             1/3
had ridden nine times or less (APH, 2019). In Southern California, where researchers          of those injured
                                                                                              in Austin were
examined medical records from two urban emergency departments, five percent of
                                                                                              first-time
injured riders tested positive for alcohol, while in Austin 29 percent had consumed           scooter riders.
alcohol in the 12 hours preceding their injuries (Trivedi et al., 2019; APH, 2019).
Another study involving 103 male scooter riders treated at trauma centers in San
Diego and Austin, found 79 percent tested for alcohol and 48 percent of those individuals were over
the legal limit (0.08). Additionally, 60 percent were screened for drugs, with slightly more than half
(52 percent) testing positive (Kobayashi et al., 2019). And 37 percent of people in the CDC/APH study,
said that “excessive scooter speed contributed to their injury” (APH, 2019).

Several studies also found e-scooters pose a risk to pedestrians. In the South California study cited
above, 52 percent of the pedestrians seeking treatment had been hit by a scooter and 24 percent
tripped over a device that was parked on the sidewalk (Trivedi et al., 2019). This has prompted some
cities to ban sidewalk riding to prevent injuries and reduce liability claims. However, micromobility
providers and advocates worry that prohibiting sidewalk riding poses risks to scooter riders who
would be forced to operate on high-speed and/or high-volume roadways that are unlikely to have
separate or protected infrastructure (more on that on page 14).

When it comes to gender and age, male e-scooters riders were more likely to be injured than females
and the average age ranged from 29 to 39. However, people of all ages were represented in the
studies. That said, the Southern California study found that nearly 11 percent of e-scooter injuries
involved patients under 18 years of age, despite state law requiring riders to be at least 16 (and 18
years of age per provider rental agreements) (Trivedi et al., 2019). In addition, 60 percent of the riders
injured in Austin were residents, while a third either lived out of town, in other states or other countries.

                                               PAG E 1 0 o f 4 4
E-bicycles
Using NEISS data from 2000 to 2017, an analysis of injury patterns and trends associated with
e-bikes found there were 3,075 injuries accounting for 0.13 injuries per 10,000 total U.S. emergency
department injuries (EDIs). (This compares to 130,797 powered scooter injuries at a rate of 5.3 injuries
per 10,000 EDIs.) The average age of a person injured on an e-bike was 31.9, with riders 18-44 and
45-65 accounting for 41 percent and 28 percent of all injuries, respectively. Males were more likely
than females to be injured (83 percent) (DiMaggio et al., 2019). It merits noting the average age of an
injured e-bike user increased from 22.8 before 2013 to 37.7 after 2013, likely the result of an increase
in the device’s use for commercial deliveries in urban settings and possibly by older persons seeking
a power-assisted transportation device (Tan, Nadkami & Wong as cited in DiMaggio et al., 2019).
3x
Unlike e-scooter injuries, e-bike-related injuries were nearly three times more likely to
be the result of a collision with a motor vehicle and to be severe enough to necessitate
hospitalization due to internal injuries. E-bike injuries were also three times more likely more likely that
than e-scooter injuries to involve a collision with a pedestrian. (This may be due to the e-bike injuries
disparity in weight and speed between a traditional bicycle and an e-bike and the fact
are the result of
a collision with
that e-bikes, unlike motor vehicles, are quiet.) E-bike riders, on the other hand, were more
a motor vehicle
likely than e-scooter riders to have been wearing a helmet at the time of their injury or pedestrian
(DiMaggio et al., 2019). The researchers involved in many of these studies pointed out compared to
that the prevalence of e-bike and e-scooter related injuries were likely underestimated. e-scooters.
As for fatalities, limitations with the data make it difficult to report the numbers. E-bikes are typically
identified as bicycles in crash reports and medical records, while e-scooters may not be identified at
all (see page 19). The 2017 GHSA report, A Right to the Road, pointed out that despite unprecedented
growth in U.S. bike share there had been only two deaths associated with these programs since
2007. However, two deaths were recorded in 2019 (NACTO, 2020). As for e-scooters, according to
a database maintained by researchers at the University of North Carolina’s Collaborative Sciences
Center for Road Safety, there have been 22 fatalities in the U.S. since 2018, with the most recent
occurring last December in Elizabeth, NJ. The key takeaway from these crashes is that 19 of the
fatalities involved a motor vehicle. The three other fatalities were the result of a rider crashing into
a tree, a collision between two e-scooters and head trauma resulting from a scooter fall (Harmon,
2020). All but two of the fatally injured scooter riders were male. The deceased riders ranged in age
from 5 to 53, with an average age of 28.8 years (PBIC, 2020).
E-bikes E-scooters
4 fatalities 22 fatalities
associated with bike share programs since 2007. since 2018, with all but three
involving motor vehicles.
PAG E 1 1 o f 4 4SHSO Involvement in Micromobility
GHSA surveyed the 54 State and Territorial Highway Safety Offices to better understand what,
if any role, they are currently playing in micromobility at the state and/or local level. The survey
asked if their state has laws addressing micromobility (e.g., maximum speed, where the devices
may be ridden, minimum rider age, helmet use) and local micromobility programs/pilots. The
SHSOs were also asked if they were working with local programs (if one or more existed in their
state) or on micromobility at a statewide level and if they were not, why. Finally, SHSOs were asked
if a staff member had been specifically tasked with addressing micromobility.
Thirty states (60 percent) responded to the survey. Seventeen reported having state laws addressing
some aspect of micromobility, with most focusing on e-scooters. Sixteen SHSOs indicated there are
micromobility programs/pilots in their state, but only nine are working with them in some capacity
(typically education). Six SHSOs indicated they are working on micromobility at a statewide level,
with activities ranging from educating riders and drivers and providing grant funds (for education
and enforcement of bicycle and pedestrian issues rather than expressly for micromobility) to serving
on a commission tasked with reviewing legislation and potential pilot sites.
When asked why they were not working with an existing program or on any statewide activities,
several SHSOs responded they were not asked and/or there was no data to support their
involvement. One explained they “have no jurisdiction [since the devices] are not classified as a
motor vehicle,” while several other SHSOs said micromobility is a “local issue” (GHSA, 2020a).
All SHSOs are encouraged to identify where micromobility has established
Getting ahead of
a foothold in their state or has the potential to do so. While the U.S. DOT and supporting
BTS bike share map shows programs exclusively in urban areas and busy this mode means
suburban corridors, micromobility is popular on many college and university taking inventory
campuses and could (if it is not already) begin appearing on small town of micromobility
streets. Getting ahead of and supporting this mode means taking inventory programs and laws/
ordinances in your
of micromobility programs and laws/ordinances in your state and determining
state and determining
what data, if any, your state is currently collecting. Once you have done that, what data, if any, your
carefully review the remainder of this publication—it outlines a game plan for state is currently
helping your SHSO become an active participant in the micromobility arena. collecting.
Addressing Micromobility’s Challenges
Contrary to news reports and public perception, COVID-19 has not been a death knell for shared
mobility. Rather it has established e-bikes and e-scooters as a viable and convenient mode of
transportation. (Just ask any essential worker who has been using one to get to and from work
during the pandemic!) (Spivak, 2020). And if device providers begin pivoting from rent by the ride to
rent by the month or try and buy, e-bikes and scooters have the potential to become a preferred or
more frequent mode of travel for city dwellers and college students, as well as people living in the
suburbs and small towns across America.
PAG E 1 2 o f 4 4Recognizing micromobility’s potential and the fact that these devices are sharing the road (or
sidewalks) with motor vehicles, traditional bicycles and pedestrians, there are inherent safety
issues. For that reason, SHSOs cannot afford to remain on the sidelines. Waiting to be invited in
or taking the position that micromobility is a local issue is short-sighted and fails to consider the
critical role SHSOs can play in addressing the following six challenges, all of which have statewide
implications:
Oversight
The Challenge: The statutes and regulations governing PTDs vary from
state to state and/or locality to locality, making it difficult for riders and
other road users to know what is allowed and for law enforcement officials
to address unsafe behaviors.
Since states have oversight of traffic laws and vehicles, the responsibility
rests with state legislatures to address this problem. What is needed are
consistent, simple and easy-to-understand rules that promote safety and Consistent, simple, and
balance the needs of all road users. At the same time, the rules must be easy-to-understand
flexible enough to accommodate new devices that are likely to appear in rules promote safety
the future. As these shared systems and/or personal PTD use grows, a and offer clear
guidance for riders.
statewide law provides guidance and ensures that regardless of jurisdiction,
riders know what they can and cannot do. This becomes even more
important if a local government does not have its own rules. Plus, a strong state rule reduces the
burden on local governments to enact their own regulations (Fang et al., 2019).
The consensus among micromobility providers, local transportation and law enforcement officials
and advocates is that state legislatures are the appropriate entity to establish regulations for
PTDs, but state laws must grant local governments the ability to limit the devices’ based on local
conditions (Fang et al., 2019). For example, there may be certain streets in a city that are simply
too narrow or congested to support mixed modes. Or sidewalks with heavy pedestrian traffic may
not be appropriate for e-scooters or necessitate lower riding speeds during certain times of the
day and/or days of the week. Communities might also need to implement PTD riding and parking
restrictions during special events and observances.
There is also agreement that PTDs should be regulated as a class, not device by device since they
share similar operational characteristics (e.g., low speed, fully or partially motorized). This makes
rule making less reactionary and ensures the rights and responsibilities are clear the moment a
new device appears on the road. Even more importantly, regulating PTDs as a class makes it easier
for the public and law enforcement to remember one set of rules (Fang et al., 2019).
Most concur that, where appropriate, PTD rules should mimic bicycle rules. Proponents say
Proponents point to the value of applying bicycle rules, which not only riders, PTD rules should
mimic bicycle
but also other road users and law enforcement can remember. It also ensures
rules, which leads
fairness, since PTDs function much like bicycles due to their speed and size (Fang to questions over
et al., 2019). Which begs the question—should PTDs be allowed on sidewalks? sidewalk use.
PAG E 1 3 o f 4 4Micromobility proponents and public health experts stress banning sidewalk riding sets up PTD riders
(especially those on e-scooters) to break the law –particularly in areas where they do not feel safe
riding in the street. Banning PTDs on sidewalks is also inconsistent with how bicycles are currently
regulated, as few states have language in their vehicle codes that prohibit sidewalk riding. The
League of American Bicyclists (LAB) argues there should be clear rules for sidewalk riding, so it is
clear how all road users should interact with each other. LAB recommends that bicyclists ride on the
road if they can do safely. Sidewalk riding can create conflicts with pedestrians, it is also a leading
cause of crashes involving cyclists being struck by turning motorists (Butcher, 2014; LAB, 2018).
Sidewalks are designed to be safe spaces for pedestrians; therefore, priority must be given to
people on foot. However, the case can be made for not enacting PTD sidewalk bans. Instead, states
legislatures should develop policy that promotes the safety and unrestricted movement of all modes,
with the caveat that communities may impose sidewalk and other infrastructure-related bans as well
as speed limit caps where warranted (Fang et al., 2019).
A case in point is Arlington County, VA, which piloted a micromobility program
in October 2018 and subsequently passed an ordinance allowing the use of
e-bikes and e-scooters on its streets a year later. (Arlington County is part of the
Washington, DC metropolitan area, which is also served by the regional Capital
Bikeshare program.) Virginia’s motor vehicle code defines the devices and where
they may be operated (among other restrictions) but gives local governing bodies
the right to enact ordinances prohibiting the use of PTDs and other devices on
sidewalks (Virginia Law Library, 2020). In early 2020, the County instituted a ban on
sidewalk riding where there is a protected bike lane “available in the same direction
of travel” (Arlington County Government, 2020). Signage prohibiting sidewalk Signage posted in
riding has been installed adjacent to the bike lanes. Where PTD sidewalk riding is Arlington, VA, limits
sidewalk riding.
permitted, the maximum speed limit is 6-mph.
What About E-bikes?
Aren’t they already regulated—particularly when it comes to where they may be ridden? Federal
law (U.S.C. Title 14 Section 2085) defines what an e-bike is for the purpose of Federal regulation
of consumer products (see the box) and directs that these vehicles must comply with Consumer
Product Safety Commission standards. But the law is silent on when and where they may be
operated. As a result, some states identify an e-bike as a moped or other motor vehicle, require that
the device be registered and the rider licensed, and/or ban its use on bicycle-specific infrastructure.
What is an e-bike?
According to the U.S. Government, it is a two or three-wheeled vehicle with fully operable pedals and
an electric motor of less than 750 watts (1 h.p.), whose maximum speed on a paved level surface, when
powered solely by such a motor while ridden by an operator who weighs 170 pounds, is less than 20 mph.
The good news is state legislatures are making progress in adopting a standard definition for
e-bikes. As of August 2020, 28 states have adopted a 3-tiered classification system:
PAG E 1 4 o f 4 4» Class 1 bikes provide electrical
motor assistance only when the rider
pedals and cuts off when reaching
20 mph.
» Class 2 bikes have a throttle-
activated motor that can be used
without the pedals and cuts off when
reaching 20 mph.
» Class 3 bikes provide electrical or
throttle-activated motor assistance
only when pedaling and cut off when According to PeopleForBikes, the 28 states in green have enacted model
legislation regulating three classes of e-bikes.
reaching 28 mph.
The laws also have similar defining language along with safety and operation requirements. This
effort has largely been led by PeopleForBikes, a national advocacy group that promotes the use
of Class 1 and Class 2 e-bikes wherever pedal-powered bikes are allowed and Class 3 e-bikes on
roadways only (Exponent, 2019; Yobbi, 2020).
Finally, a review of state/territorial, local and university regulations governing PTD operation found
that all addressed one or more of four explicit behaviors: required such as wearing helmets; allowed
and prohibited, with a focus on sidewalk riding; and exempted such as not needing a license or
registration. The most common user behaviors explicitly required address helmet use (typically
for riders under 18 years of age), minimum rider age, braking, lights and reflectors, safety guides,
yielding to pedestrians, number of riders, riding abreast, parking, speed of streets, rights and
penalties (Fang et al., 2019).
The Role for SHSOs
Task a staff member, ideally a program coordinator or manager working in pedestrian and
bicyclist safety, with the responsibility of becoming your SHSO’s expert on micromobility. If
PTDs are not explicitly banned in your state, this individual is encouraged to work with local
jurisdictions that may already have micromobility operations to harmonize regulation.
Include micromobility (if it is not explicitly addressed) in your state’s pedestrian and bicycle
safety task force, advisory group, commission or other relevant body’s charter and expand the
membership to include representatives from this mode.
Work with the task force to review how PTDs are addressed in state laws and regulations to
identify confusing language, gaps and deficiencies.
Work with task force members—and others with an interest in micromobility, such as
providers and sellers, local ride share program administrators, and insurers, to educate
policymakers and the media about what PTDs are and are not and how to effectively regulate
their use ensuring that mobility and safety are not compromised.
PAG E 1 5 o f 4 4Funding
The Challenge: The current U.S. surface transportation funding law—the FAST Act—does not
include dedicated funding for micromobility, despite a decade of steady growth.
Currently there are shared micromobility systems in 47 states and Washington, DC. The mode
is expected to continue to grow over the next decade, with management consultant, McKinsey
predicting it could generate anywhere from $300 to $800 billion by 2030 (Heineke et al., 2019). The
pandemic’s effect on those projections is unknown, but not the public’s appetite for transportation
modes that promote social distancing. When the average length of household trips is factored into
the discussion—the majority (59 percent) are less than six miles and three-quarter are ten miles or
less (Federal Highway Administration, 2018)—the use of shared and/or owned PTDs becomes even
more viable and cost-effective (particularly for those who do not have the means or desire to travel
by motor vehicle).
At present, the cost of owning and operating a shared micromobility system
falls on local governments, device providers and/or non-profits. Some bikeshare
systems are government-owned, such as those operating in the DC metropolitan
area, while others are government-endorsed. Citi Bike in New York, for example,
is the latter and uses money from corporate sponsors rather than public dollars
to purchase and maintain vehicles (DuPois, Greiss & Klein, 2019). San Francisco’s
bikeshare program, Bay Wheels, is administered by the Mass Transit Authority At present, the
(SFMTA) and operated by Motivate, which has undertaken a major expansion cost of owning and
with sponsorship from Ford. Once complete, the system will cover approximately operating a shared
micromobility
half the city—at no expense to taxpayers (SFMTA, 2020). (Motivate is owned by
system falls on
Lyft and operates many bikeshare programs across the United States.)
local governments,
device providers,
The introduction of dockless bikes, however, created a new set of challenges and/or non-profits.
for government agencies, prompting cities to institute permitting processes
that include the collection of fees to help cover administrative and other costs
(much to the dismay of providers). San Francisco was one of the first to do this, charging each
provider an application and annual permit fee as well as a $10,000 endowment. Seattle enacted a
$250,000 free-floating bike share program fee in 2018 that annually allows four dockless providers
to each operate up to 5,000 bikes on the Department of Transportation’s (SDOT) right-of-way. If
there are three or fewer vendors, the fee is $50 per permitted bicycle or other device, prorated
by month. SDOT uses the fee to cover permit costs, program administration and for public-realm
accommodations such as signage and designated bike share parking areas (SDOT, 2018). (Seattle
currently does not allow e-scooters.)
Fees help, said those government and non-profit officials interviewed for this publication, but they
do not begin to cover all administrative costs. Nor do they address the need to educate riders and
other road and sidewalk users about how to safely operate together. Many communities encourage
or require micromobility providers to invest in education and rider training that includes promoting
helmet use, but consistent and widespread outreach is needed. Funding is also needed to train
officers to understand and enforce PTD laws. There is also agreement among city and community
officials, providers and advocates that more protected infrastructure is needed, as it is the
preferred and safest place to ride. All these things take money.
PAG E 1 6 o f 4 4Micromobility & Reauthorization
The NABSA, which advocates for shared micromobility, is calling on Congress to include
micromobility in the next surface transportation reauthorization bill. Infrastructure is a key
theme of NABSA’s platform, which includes incorporating Complete Streets into project design,
expanding the Transportation Alternatives Program to include shared micromobility and placing
greater emphasis on using Highway Safety Improvement Program funds to address vulnerable
road user safety. The association is also urging Congress to reauthorize and increase funds for
direct investment in micromobility systems and allow monies to be used to study and support the
industry’s growth. That provision, coupled with reinstating the bicycle commuter tax benefit and
expanding it to include shared micromobility, could result in more e-bikes and e-scooters on the
road (NABSA, 2020).
SHSOs may fund some micromobility safety programs using federal funding from Section 402 or
possibly Section 405(h) (Non-motorized Safety) of the National Priority Safety Program. A state
is eligible for Section 405(h) funding if its combined statewide pedestrian and bicyclist fatalities
account for more than 15 percent of its total traffic deaths based on the most recent Fatal Analysis
Reporting System (FARS) data.
However, SHSOs may use these funds only to train law enforcement officials
GHSA urges
on pedestrian and bicyclist safety laws and for enforcement mobilizations,
Congress to
campaigns and road user public education and awareness programs that expand the 405(h)
address these laws (GHSA, 2020b). Ensuring law enforcement and all road program to allow
users understand these laws is critical. However, this restriction has hampered federal funds to be
states from fully expending 405(h) monies. Therefore, GHSA urges Congress used for a wider
to expand this program to allow federal funds to be used for a wider range of
range of programs
that address
programs that address vulnerable users. States should also explore how these
vulnerable users.
funds can be used to advance micromobility safety.
The use of alcohol and other drugs by PTD riders, as well as bicyclists and pedestrians, is also
problematic, just as it is for motorists. As discussed previously (see page 10), researchers examining
the medical records of PTD riders treated at hospitals found significant alcohol and drug use. At
the same time, one-third of fatally injured pedestrians in 2018 and 20 percent of bicyclists ages 16
and older, in 2019, with known test results had a BAC of 0.08 or higher [Retting, 2020; NHTSA as
cited in Insurance Institute for Highway Safety, 2019]). Under the FAST Act, slightly more than half
of Section 405 funds are earmarked for impaired driving incentive grants (GHSA, 2020b). However,
the use of alcohol and/or drugs by all road users means they have diminished faculties that could
impact judgement, decision-making and reaction time and put them at risk for injury and/or death.
Therefore, Congress should expand the use of Section 405(d) funds to include countermeasures
addressing alcohol and drug use by drivers, riders, pedestrians and bicyclists.
Helmet Use
For PTD riders, reinforcing the importance of wearing a helmet is critical as the majority of shared
bike and scooter riders do not wear helmets and are significantly less likely to do so compared
to cyclists who own their bicycles (Fischer et al., as cited in Graves et al., 2014). Micromobility
providers urge riders via their apps and websites to wear helmets but they do not typically provide
them at the time of rental. (See the rare exceptions in the sidebar.) An evaluation of the barriers
PAG E 1 7 o f 4 4These PTDs Come with a Helmet
Getting shared PTD riders to wear helmets is a big problem for providers. Wheels provides riders a free
helmet that is locked to the rear of their e-bikes operating in six U.S. cities. The helmet is unlocked
via the Wheels app and comes with a peel-off biodegradable headliner. A magnetic sensor in the bike
recognizes when the helmet is being used (Hawkins, 2019a).
In Europe, 5,000 Tier scooters are equipped with a foldable helmet that is locked inside a compartment
located below the handlebars (accessible via the app). The helmets meet European safety standards,
are checked after every fifth ride and disinfected as part of the company’s COVID-19 safety precautions
(Porter, 2020).
and facilitators to helmet use among bikeshare riders in Australia, where helmet use is mandatory,
found that 61 percent cited helmet inaccessibility or the desire not to wear one as the main barriers
to using the mode (Fishman et al., as cited in Graves et al., 2014).
Providers, however, do not advocate for helmet laws as the requirement could
impact a rider’s spur-of-the-moment ability to use a shared device. It was
e-scooter operator, Bird, that sponsored the bill in California that rescinded
the state’s helmet requirement for all riders 18 and older (Kerr, 2018). At the
same time, e-bike and scooter provider, Lime, gives a helmet to all learn to
ride event participants and partners with a leading helmet manufacturer to
offer riders discounts on helmet purchases. During the pandemic, helmet
manufacturer, Thousand, launched its Courier Care program to give free
Development of
helmets to bicycle couriers doing essential work (Thousand, 2020). To address
collapsible and
the disparity in helmet use among shared PTD users, Congress is encouraged shareable helmets
to include competitive funding in the next federal transportation bill to spur could encourage use
development of collapsible helmets or helmets designed for shared use. among riders.
The Role for SHSOs
Educate your state’s Congressional delegation about:
» what micromobility is (referring to the SAE Taxonomy discussed on page X can be helpful)
and how it has and continues to grow, the behavioral safety issues that put riders and other
road/sidewalk users at risk and the need to authorize funding for micromobility safety in
the next federal surface transportation funding bill.
» why expanding the 405(d) program is necessary to fully address the impact of alcohol and
other drugs on road safety.
» why expanding the 405(h) program is necessary to fully address the safety of ALL
vulnerable road users.
» the disparity in helmet use among PTD riders, the dangers of riding without a helmet, the
societal costs associated with head/brain injury and the need for innovative approaches to
increase helmet use.
PAG E 1 8 o f 4 4Data
The Challenge: Micromobility-involved crashes and injuries are likely
underreported due to the lack of a universal reporting standard.
No report
SHSOs are dependent on crash and other aggregated, de-identified
data sets for problem identification and resource allocation. Data is
also critical for making sound policy-decisions. The current lack of a
standardized reporting mechanism for PTD-related crashes coupled
with underreporting on the part of law enforcement and providers
makes it difficult for SHSOs and their partners to understand
micromobility’s impact on traffic safety. This should not be construed as the fault of either party, as
a rider may choose not to report a crash, the crash may not involve a motor vehicle or meet the state’s
reportable standard or it could have been misclassified. If reference is made to a PTD on a crash
report, it is typically included in the narrative (Goodman et al., 2019).
To collect reliable micromobility crash data, state crash reporting systems should include a
unique field element with attributes for all PTDs currently permitted to operate on state and local
roadways. A micromobility element for non-motorists has been proposed for the next update to
the Model Minimum and Uniform Crash Criteria (MMUCC) scheduled for publication in 2022. The
proposed element follows the framework laid out by the Society of Automotive Engineers (SAE)
in their publication, Taxonomy and Classification of Powered Micromobility Vehicles (J3194). The
graphic below and associated narrative are included in a summary document to J3194 and present
SAE J3194™ TAXONOMY & CLASSIFICATION OF
the most user-friendly avenue to increase data capture of these mobility types without sacrificing
POWERED MICROMOBILITY VEHICLES
data quality and integrity.
POWERED MICROMOBILITY VEHICLE Scope of J3194™
A wheeled vehicle that must: • Only includes vehicles that are primarily
designed for human transport and to be
• Be fully or partially powered
used on paved roadways and paths
• Have a curb weight ≤ 500 lb (227 kg)
• Excludes solely human-powered vehicles
• Have a top speed ≤ 30 mph (48 km/h)
TYPES OF POWERED MICROMOBILITY VEHICLES1
Powered Powered Standing Powered Seated Powered Powered Powered
Bicycle Scooter Scooter Self-Balancing Non-Self-Balancing Skates
Board Board
Center column Y Y Y Possible N N
Seat Y N Y N N N
Operable pedals Y N N N N N
Floorboard / foot pegs Possible Y Y Y Y Y
Self-balancing2 N N N Y N Possible
1
All vehicles typically designed for one person, except for those specifically designed to accommodate additional passenger(s)
2
Self-balancing refers to dynamic stabilization achieved via a combination of sensors and gyroscopes contained in/on the vehicle Source: Society of Automotive Engineers
PAG E 1 9 o f 4 4You can also read