TALLINN DEVELOPMENT PLAN 2014-2020
←
→
Page content transcription
If your browser does not render page correctly, please read the page content below
TALLINN
DEVELOPMENT
PLAN 2014–2020
Tallinn
Development Plan
2014–2020
Contents
Adopted by Tallinn City Council regulation no. 29   1.       Introduction............................................................................................................................................................................. 4
from June 13 2013.                                  2.       Central strategic development trends, related tasks and solutions.......................................................................... 7
                                                             2.1 Population development........................................................................................................................................... 8
                                                             Needs and their fulfilment options................................................................................................................................... 9
                                                             2.2 Economic development............................................................................................................................................. 10
                                                             Needs and possibilities for their fulfilment..................................................................................................................... 15
                                                             Investment projects planned with external funding.................................................................................................... 18
                                                             2.3 Socio-cultural development .................................................................................................................................... 19
                                                             Needs and their fulfilment option..................................................................................................................................... 20
                                                             Investment projects planned with external funding.................................................................................................... 23
                                                    3.       Development vision for Tallinn........................................................................................................................................... 24
                                                    4.       Development principles of Tallinn . ................................................................................................................................... 26
                                                    5.       Development model for Tallinn.......................................................................................................................................... 28
                                                             Action plan of the development plan................................................................................................................................ 35
                                                    6.       Main risks associated with the implementation of the main objectives of the development plan
                                                             and the options for their mitigation.................................................................................................................................. 74
                                                    7.       Updating the development plan........................................................................................................................................ 78
                                                    8.       Financial obligations exceeding the duration of the development plan................................................................. 80
                                                             References................................................................................................................................................................................ 82
                                                             Annex 1. The most important projects of 2013 by fields............................................................................................. 84

                                                    Figure 1. Development model for Tallinn.................................................................................................................................... 5
                                                    Figure 2. Central strategic development trends and solutions............................................................................................. 8
                                                    Figure 3. Natural growth of the population of Tallinn, 2008-2011...................................................................................... 9
                                                    Figure 4. The age and sex distribution of the population of Tallinn in 2013..................................................................... 9
                                                    Figure 5. The number of economically active enterprises in Tallinn, 2008–2012............................................................ 11
                                                    Figure 6. The employment status dynamics among 15–74-year-olds in Tallinn.............................................................. 11
                                                    Figure 7. Employed persons by industry, 2008–2012.............................................................................................................. 12
                                                    Figure 8. The average monthly gross wages in 2008–2011................................................................................................... 12
                                                    Figure 9. The number of authorised dwellings, 2008–2012.................................................................................................. 13
                                                    Figure 10. The number of authorised dwellings in Tallinn, 2008–2012.............................................................................. 13
                                                    Figure 11. Real estate prices and gross wages in euros in Tallinn, 2008–2011................................................................. 14
                                                    Figure 12. The main way of going to work.................................................................................................................................. 14
                                                    Figure 13. Number or trips with the public transportation of Tallinn, 2008–2011......................................................... 15
                                                    Figure 14. Light traffic routes in Tallinn....................................................................................................................................... 16
                                                    Figure 15. The proportion of people associated with Tallinn................................................................................................. 19
                                                    Figure 16. Social benefits dependent and independent of family income (millions of euros), 2005–2012.............. 20
                                                    Figure 17. Tallinners' self-assessment of their health status, 2008–2012......................................................................... 20
                                                    Figure 18. Tallinners' aspects of life and corresponding areas of development............................................................... 29
                                                    Figure 19. Development targets.................................................................................................................................................... 30
                                                    Figure 20. Prospective railway corridors...................................................................................................................................... 32
                                                    Figure 21. Prospective main streets.............................................................................................................................................. 33
                                                    Figure 22. Bicycle lanes in Tallinn.................................................................................................................................................. 34

                                                                                                                                                                                                                                                             3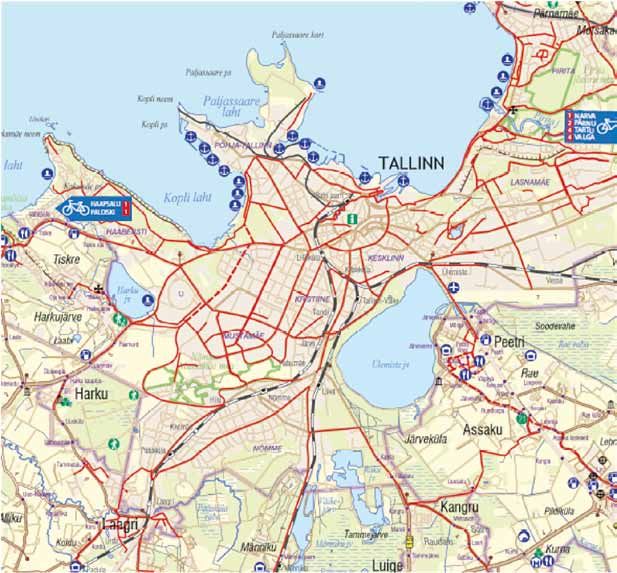
1. Introduction
ment principles for Tallinn, and the action plan. The Figure 1. Development model for Tallinn
action plan contains six main objectives, sub-
objectives, measures for achieving them, perfor-
mance indicators, and a list of activities for 2014- Central developments Development vision
2017. A separate part of the development plan shall and challenges for Tallinn
present risks related to the achievement of the • population development
objectives and the options for their mitigation. The • economic development
work ends with a list of sources used for the prepa- • socio-cultural development
The Local Government Organisation Act is the legal basis The central objective of the updated development plan shall ration of this development plan.
Development strategy
for the preparation of the Development Plan for Tallinn, be a Tallinn that is socially safe and has a clean living environ- The relationships between the Tallinn Develop- Conclusions of the developments
pursuant to subsection 37 (1) of which every local govern- ment. Among other things, it shall provide for measures to ment Plan for 2014-2020 and other central devel- in the context of the
ment shall have a development plan. boost employment in the short term, in the phase of managing opment documents, and the legal binding between development strategy
the consequences of the financial crisis, and in the long term. the parts of the development plan, have been
The Tallinn Development Plan has been prepared for the
period of 2014−2020. The action plan of the development In addition to focusing on the capital, the revision of the summarised in Figure 1. Development plan Budget strategy for Tallinn
plan has been prepared until 2017. The development plan is action plan of Tallinn has also taken into account other Main objectives
The development plan lists the following urban
based on the objectives of the Tallinn Development Plan for trends in the urban region because several solutions for the Secondary objectives
development priorities by main objectives:
2009-2027 (Regulation No. 129). The main objectives of the future of Tallinn can only thrive thanks to the cooperation Measure
development plan shall be based on and specify the objec- with neighbouring municipalities and joint investments in 1) The main priority of the business, tourism and Actions
tives stated in the development strategy of Tallinn titled the social and technical infrastructure. The harmonious employment fields is the creation of a favourable
“Tallinn 2030”. Furthermore, the Tallinn sectoral and city politics of Tallinn and the municipalities of the capital city growth environment for start-ups and creative opment program for municipal preschool institutions,
district development plans, the main views of the Tallinn region, as well as the government, help to perform more enterprises. It is also important to support the internation- 2013-2021, "A nursery school place for every child". The plan
budget strategy and the comprehensive plan for Tallinn have successfully the tasks of the development plan, which is alisation of companies. In the short term, it is important to is to create more than 600 nursery school places per year,
been taken into account. The recommendations from the aimed ultimately at ensuring the welfare of the residents maintain the labour resources and to flexibly implement amounting to 26 300 places by the end of the period. The
strategic environmental assessment report of the develop- of the centre of the county and the capital of Estonia and Tallinn’s support programs for the city’s residents and entre- Koidula St. 23 building is converted into a nursery school.
ment strategy shall be taken into account during the imple- at increasing the global competitiveness of the city. preneurs. The expansion of the Lasnamäe Industrial Park The renovation of the following institutions is also planned:
mentation of the objectives listed in the development plan. and the completion of the Suur-Sõjamäe Industrial Park are Tallinn Pääsküla Upper Secondary School, Tondi Basic School,
It is therefore important that the state would support among the most important projects. Also important is the
The necessary resources for the implementation of the achieving the goals set in the development plan, such as by Õismäe Russian Lyceum, Tallinn French Lyceum's gymna-
development of entrepreneurship-supporting structures, sium, Gustav Adolf Upper Secondary School's gymnasium
development plan shall be proposed in the city's budget co-financing objects of national importance. innovation of tourism services and the appreciation of
strategy, and more specifically, provided in the city budget. and primary school building, renovation of the primary
The development plan consists of an introduction, a short entrepreneurship as a whole, which consists of promoting school building of the Old Town Educational College, as well
The city's budget strategy, which is linked to the development description of the development tasks and options for Tallinn, entrepreneurship, organising relevant events and support- as completion of the reconstruction of Tallinn nursery
plan, serves as the basis for the preparation of the city’s budget, a formulation of the principles of the vision and manage- ing the carrying out of these events. It is important to school No. 26 (Kiisa St. 6), construction of the Pirita-Kose
making of investments and, if necessary, the taking of loans. encourage cooperation between universities, institutions and Veerise nursery schools, renovation of the Õismäe Rd.
of professional higher education, vocational schools and 24 nursery school building, and renovation of the Tallinn
The development plan provides an opportunity to deliber- enterprises. The main activity to ensure employment Mardi nursery school. The activities of the "Peace in the
ately involve the potential of the state, the European Union, growth is the advancement of skills and knowledge and the Community" programme shall be continued to bring differ-
the private sector and the non-profit sector in the develop- lowering of barriers to entry into the labour market. ent ethnic groups closer together and increase mutual trust.
ment of Tallinn. In the youth work field, development of mobile and virtual
2) The development of education and youth work fields is
based on the development of the network of general educa- services, along with services targeting unemployed young-
tion schools, and also in the future on the close-to-home sters are under development, with an emphasis being
principle, according to which the aim is to guarantee every placed on the improvement of youth workers' professional
child the possibility to attend a school near their home. qualifications and the recognition of their work.
Access to general secondary education is ensured for those 3) In the cultural field, the main objective is a national cul-
who are interested. In vocational education, the range of ture that is modern, evolving and inclusive of the younger
disciplines necessary for the city is increased. In the field of generation. In the inclusion of minorities and their partici-
early childhood education, the most important is the devel- pation in cultural life, the orientation of the activities of
4 TALLINN D EVELOPMENT PLAN 2 0 1 4 – 2 0 2 0 INTRO D U C TION 5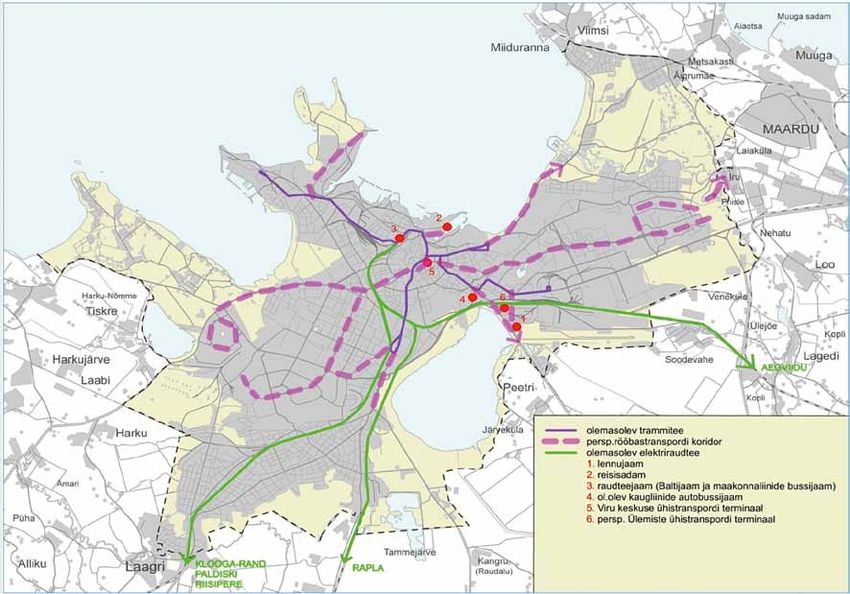
2. Central
    minorities towards the wider public and cooperation with          and turn former industrial sites into public spaces. In the
    other cultural groups is important. In addition to the devel-     transport field, the preferential development of public
    opment of a professional culture that is competitive in           transport is most important, including providing free public
    Europe, diverse opportunities for amateur cultural activities     transportation for residents of Tallinn, developing the con-

                                                                                                                                        strategic
    and support for the activities of citizen’s associations must     tactless ticket system and developing light traffic routes.
    be ensured. In the cultural heritage field it is important to     Priority infrastructure projects include the construction of
    value the historic cityscape of Tallinn, including the Old        the Haabersti intersection, construction of Põhjaväil and
    Town, which is included on UNESCO's list of World Heritage        developing the tramway system to Ülemiste and Lasnamäe.

                                                                                                                                        development
    Sites, as well as in the increasingly valued historic suburban    The Municipal Engineering Services Department's goal
    built-up areas of cultural and environmental value. Strategic     regarding the planning of road investments is the achieve-
    investment objects: Tallinn Song Festival Grounds, Russian        ment of the required level with major repairs and recon-
    Cultural Centre, Tallinn Linnahall, city walls and towers, the    struction, pursuant to Regulation No. 94 of the Tallinn City

                                                                                                                                        trends, related
    House of the Brotherhood of the Blackheads, the historic          Government, of 1 October 2003, titled “Approval of road and
    building complex of the City Theatre, Lasnamäe Orthodox           street repair standards of Tallinn”.
    Church, Mustamäe Lutheran Church, Tallinn Creative Hub,
    Tallinn Zoo, Salme Cultural Centre, departments of the Tal-       6) In the field of local government, the priority is the expan-

                                                                                                                                        tasks and
    linn Central Library and the Tallinn Russian Museum, and          sion of the conurbation-based development model. Coop-
    the monuments to Jaan Poska and Jüri Vilms.                       eration with the local governments of Harju County is
                                                                      increased in order to implement this, especially with the
    4) The priority of social protection, health and safety is the    neighbouring local governments of Tallinn. Cooperation

                                                                                                                                        solutions
    adjustment of the social benefit system to the economic           with Helsinki, Riga and St. Petersburg is important in
    circumstances, similarly to the already implemented first and     increasing the international competitiveness of the city. The
    second aid packages of Tallinn. Municipal construction is         share of e-services in the provision of public services is
    continued with the second housing programme, in order to          increased, in particular, frequently used services and ser-
    help young people in entering the city's labour market and        vices with a large user base are developed.
    in finding a home. To increase the efficacy of prevention work
    with risk groups, the number of child protection officials in     The objectives of the Tallinn Development Plan for 2014-
    districts will be increased, if necessary, and several new day    2020 are implemented by the Tallinn City Government,
    centres will be opened. To increase the volume of social ser-     agencies, city district governments and their agencies, city-
    vices, housing at the Iru nursing home will be expanded. In       owned businesses and cooperation partners. Since Tallinn's
    2014, reconstruction of the Tallinn Support Centre Juks           area of influence extends considerably beyond the admin-
    (Kadaka Rd. 153) will be completed, and the Tallinn Children’s    istrative border, cross-border cooperation must be improved
    Shelter and the Tallinn Family Centre will be reconstructed       in the implementation of the development plan, above all
    and expanded. In addition to supplementary pension pay-           in Harju County and with the capital region of
    ments, senior citizens will be given discounts on goods and       Finland – Uusimaa.
    services. To improve procedural acts, it is important that the    The development plan was changed in cooperation with
    remit of the Municipal Police be expanded.                        city officials, members of the City Council and stakeholders,
    5) In terms of urban space, the priority is the creation of a     and it took the submitted proposals into account. The
    high-quality urban space that supports an increase in             organisational activities were coordinated by the Tallinn
    population and the addition of jobs. In the development of        City Office. In the preparation of the development plan ideas
    the urban space, the objective is to receive the European         were used, which are presented in the documents shaping
    Green Capital title by 2018, thanks to the creation of an         the development of the city and in surveys – in the develop-
    integrated green network and the improvement of the               ment strategy, in the sectoral and district development
    quality of water and air. It is also important to make the city   plans and in the comprehensive plan of Tallinn.
    centre more compact, preferentially develop coastal areas

6            TALLINN D EVELOPMENT PLAN 2 0 1 4 – 2 0 2 0                                                                                                  7
2. Central strategic development trends, The population of Tallinn is multi-eth-
nic. Fifty-two per cent of the popula-
tion are Estonians, 38% Russians, 10%
Figure 3. Natural growth of the population of Tallinn, 2008-2011
related tasks and solutions Ukrainians, Belarusians, Finns, Jews,
Tatars and other nationalities. The per-
centage of Estonians is greatest in the
6000
5000 985 937
1200
1000
city districts of Nõmme, Pirita, Kristiine 4000 761 800
and the City Centre 786
3000 600
The following section provides an Figure 2. Central strategic development trends and The population growth rate has
overview of the most influential 2000 400
solutions remained stable in Tallinn, mainly due
trends influencing or having influ- to the increase in the number of births 1000 200
enced the development of the city. (Figure 3). In 2011, 4986 babies were
Central development trends, such as Strategic needs and born in Tallinn. According to the popu- 0 0
population development, economic 2008 2009 2010 2011
Population development options: lation projection for Tallinn for the
development and socio-cultural • in the urban management years 2011–2030, the birth rate in Tal-
development are observed. Based on live births Source: Statistical yearbook “Tallinn arvudes”
field linn will rise to a relatively high level, (Tallinn in numbers), 2013
the nature of the development trend, • in the entrepreneurship and comparable to the birth rates of the
the main development activities and employment fields Nordic countries.
general solutions that would enable Economic development • in the education and youth
work fields Figure 4. The age and sex distribution of the population of Tallinn
the execution of tasks in the best pos- The influence of migration on the num-
• in the culture and recreation in 2013
sible way are highlighted, while keep- ber of residents and on the structure of
ing the main objectives in mind. fields population is primarily related to the
Socio-cultural development • in the social and health care settling of larger generations in the
Men Women
2.1 Population fields
capital, to study and work, during the
188 014
85+
80–84 231 816
development 1980s. The immigration of youth has 75–79
increased the percentage of younger 70–74
Tallinn is Estonia's most populous city. age groups in the population of the city 65–69
60–64
According to the Estonian Population and has created a favourable basis for 55–59
Register, in April 2013, 425 249 people the growth of the birth rate and positive 50–54
lived in the capital, which is 31% of population growth. In the near future 45–49
Estonia’s population. During 2008- we must be ready for the beginning of 40–44
35–39
2013, the population has shown an the re-urbanisation process, due to the
30–34
upward trend in all city districts. The at times poor building quality of houses 25–29
population has grown the fastest in in new settlements, the lack of availabil- 20–24
Pirita, the City Centre and Haabersti.. ity of services and poor road conditions, 15–19
which have served to decrease the 10–14
5–9
attractiveness of suburban living. 0–4
20 15 10 5 0 0 5 10 15 20
Population in Tallinn city districts in 2008–2013 Age groups are undergoing significant
thousands thousands
changes during the period of this devel-
Change opment plan. The change in Tallinn, as Source: Statistical yearbook “Tallinn arvudes” (Tallinn in numbers), 2013
2008–2013 a whole, arises from the fact that
2008 2009 2010 2011 2012 20131 (2008–100%) between the large age groups of 0-4
Tallinn 401 372 404 005 406 703 411 980 416 144 425 249 6 and 20-34, there is a smaller group of 5-19-year-olds. Variabil- future, emigration from Tallinn will be significantly lower
ity is even greater in the city’s districts. This should be taken than from the rest of Estonia. Whether or not the city's
Haabersti 39 587 40 454 41 051 41 549 42 294 43 187 10 into consideration when planning places in nursery schools population will grow in the future depends on the attrac-
City Centre 47 671 48 158 48 646 50 182 51 308 54 025 13 and schools. For example, the number of 3-6-year-olds and tiveness of the working and living environment. With that
Kristiine 29 478 29 221 29 395 29 810 30 055 30 765 4 especially the number of 7-14-year olds increases rapidly at in mind, the city's population development prerequisites
the beginning of the forecast period and then the increase are presented below.
Lasnamäe 112 001 113 332 114 258 115 654 116 273 117 514 5 shifts to the upper secondary school level. Also, the number
Mustamäe 64 243 64 339 64 113 64 597 64 237 65 347 2 of people retiring increases, but this increase is not so rapid.2 Needs and their fulfilment options
Nõmme 38 725 38 428 38 100 38 275 38 898 39 274 1 Steady development and population regeneration are in the Due to the need to preserve the population of Tallinn, it is
interests of the development of Tallinn. important to diversify the living environment of the city.
Pirita 14 039 14 595 15 135 15 567 16 636 17 243 23
An alternative to the Estonia-based migration is migration The improvement of residents' quality of life helps to ensure
Põhja-Tallinn 55 628 55 478 56 005 56 346 56 443 57 894 4
between countries. Now, and probably also in the near the continued growth of Tallinn’s population. Above all, this
Source: Statistical yearbook “Tallinn arvudes” (Tallinn in numbers), 2013
1
as of 01.04.2013
2
Population projection for Tallinn (Tallinna rahvastikuprognoos) 2011–2030 (2011)
8 TALLINN D EVELOPMENT PLAN 2 0 1 4 – 2 0 2 0 C ENTRAL STRATEGI C D EVELOPMENT TREN D S , RELATE D TAS K S AN D SOLUTIONS 9
mean even greater focus on the diverse needs and desires centre region and develop new business quarters in other Figure 5. The number of economically active enterprises in Tallinn, 2008–2012
of the population – creating a better working and business districts, near main streets or roads. Since wealthier Tal-
environment, a flexible housing policy that favours diversity, linners often move to live in neighbouring rural municipali-
50000
incl. increasing the municipal housing fund, higher quality ties, a dual approach is to be used in the development of
and more diverse services and a citizen-friendly living culture in Tallinn. First of all, residents in the areas of urban 40000
environment. sprawl continue to be (potential) consumers of the cultural
and entertainment services offered in Tallinn, connecting 30000
According to the population forecast for Tallinn, the percent- the capital and the suburbs in a uniform conurbation. While 20000
age of those 65 and older will increase from 17% in 2011 to rural municipalities are unable to compete with Tallinn in
18% in 2020, and to 20% in 2030.3 This means that the terms of content and diversity, Tallinn’s competitive-weak- 10000
number of taxpayers might decrease and economic pres- ness is the poorer availability of services for the residents
sure on the city’s budget will inevitably increase. Therefore, 0
of neighbouring municipalities. To make the services more
it is imperative to improve the productivity of the people 2008 2009 2010 2011 2012
accessible logistically, the (public) transport and parking
remaining in the labour market, in order to achieve the same possibilities must be improved, the urban space in the city Source: Statistical yearbook “Tallinn arvudes” (Tallinn in numbers), 2013
or better standard of living. The prerequisite for this is centre concentrated, and the "Park and Ride" and joint ticket
structural changes in business that aim to increase produc- system expanded. A local approach is more meaningful in
tivity and achieve higher profits. The city's business policy the organisation of amateur activities and public events: Figure 6. The employment status dynamics among 15–74-year-olds in Tallinn
must encourage such changes. residents should be able to participate in events and be
active as close to home as possible; this would also help to 250 unemployed
The ageing of the population will result in an increase in
the demand for welfare, medical and recreational services strengthen the local (district’s) identity. 200 employed
directed towards senior citizens, and will require the redi- The ethnic composition of the population and changes in 150
recting of more resources to creating day-care centres, the organisation of education make the planning and
nursing homes and active hobby activities for this age implementation of education policy much more compli- 100
group. The ever declining working-age population will need cated. In terms of the stable development of the network
to support a growing dependent population group, which 50
of educational and social institutions, the large size differ-
also leads to the city having less money to invest in its own ence between different age groups is problematic, such as 0
development. At the same time, developed countries – the size difference between the generation of the Singing 2008 2009 2010 2011 2012
where there is a similar trend taking place – may begin to Revolution (1980s) and the following generation of the
even more intensively invite younger people from other Source: Statistical yearbook “Tallinn arvudes” (Tallinn in numbers), 2013
1990s, as well as the nature of migration inside the conur-
areas to live there, including from Estonia, and that would bation. These differences require the constant adaptation
diminish the working age population even further. of the educational network to meet the changing needs.
are made in Tallinn and Harju County.4 The problems of foreign number of operating companies has increased in most areas
The city’s network of child care institutions and schools The ethnic diversity of a city means that the city should be investors in the Tallinn area began in 2007, in relation to labour (except in administrative and support service activities).6
must be constantly kept up to date. Since many people able to create conditions for the representatives of different shortages and a considerably more rapid growth of cost levels
working in Tallinn live in the neighbouring settlements, the ethnic nationalities to promote and consume their culture. than planned, which all culminated in 2008 with the departure In 2011, the revenue of businesses in Tallinn (with more
transport infrastructure must be conurbation-based. It is On the other hand, the multi-ethnic nature is a resource that of several companies. Due to the economic and financial crisis, than 20 employees) accounted for EUR 15.103 billion, which
therefore important to develop a unified public transport has yet to be effectively implemented in the cultural con- the interest of foreign investors in investing in Estonia has was 56% of all sales revenue in Estonia. In 2011, the corpo-
standard for the capital region’s local governments. Urban sumption and in the diversification of amateur opportunities significantly decreased since 2008. Partial relief for the reduc- rate EBIT was EUR 843 million.7 Since the majority of these
development should create conditions that reduce the for city residents, and for the promotion of tourism. The tion in the volume of foreign investments should be provided are small businesses, the flexible response to market signals
transport burden, or at least halt its growth. There are two integration of ethnic groups must be a common theme run- by the means of the European Union (EU) Structural Funds, in is a competitive business advantage.
available options. Firstly, the development of high-quality ning through the educational, cultural, and social services. particular to the public sector (and via orders also to the private
and child-friendly residential areas near the business dis- Due to emigration and competition with higher-salary
sector), but also to businesses and to the non-profit sector. The countries, businesses are finding it difficult to locate skilled
tricts of the city centre enables work and everyday life to be 2.2 Economic development introduction of the euro is expected to increase the interest of workers and engineering and technical personnel. Also,
blended in a smaller unit of space, maintain a skilled profes- foreign investors
sional workforce and stop the resettlement of young people Tallinn's share of the country's gross domestic product has most of the emigrants are 20–29 year-olds.8 The existing
in the suburbs of Tallinn. Among other things, opportunities grown, with nearly 49% of Estonia's GDP now produced in In 2012, according to Statistics Estonia, there were 45 787 workforce that was freed during the financial crisis is best
must be created in the various areas of Tallinn for the con- Tallinn. GDP per capita in Harju County is higher compared economically active enterprises in Tallinn, which is 3014 suited for the development of the service sector. In the
struction of family, semi-detached and terraced homes, to to the other Baltic capitals, but remains well below the level more than in 2011.5 labour market there are many half-educated young people
offer the opportunity of creating a home in the city for those of the Nordic metropolitan regions. Rapid growth has been and people without a proper professional education or
who prefer a more private environment. A contribution followed by a sharp decline since 2008, and stabilisation Wholesale and retail businesses (21%) dominate in the people without retraining, who are working in jobs for
should also be made to increasing the high-quality concen- and slight growth in 2010 and 2011. business structure. These are followed by professional, which they are unsuited. In business services (information
tration of urban space in the city centre and in the interme- scientific and technical and construction businesses (in and communication technology (ICT), data processing,
diate zones between large apartment building districts. To Important engines of economic development have been 2011, respectively 16.5% and 8.4%). Compared to 2010, the design), the good language skills of Estonians and large
alleviate traffic problems and to save residents’ time, it foreign investments in the capital region's economy. number of suitable graduates for the workforce continue
would be useful to disperse business areas outside the city Approximately four fifths of direct investments in Estonia to play a role that favours investments.
4
www.stat.ee
5
Statistical yearbook “Tallinn arvudes” (Tallinn in numbers) 2013
6
Statistical yearbook “Tallinn arvudes” (Tallinn in numbers) 2013
3
Population projection for Tallinn (Tallinna rahvastikuprognoos) 2011–2030 (2011), 28 7
www.stat.ee
8
Estonian Quarterly Bulletin of Statistics (Eesti Statistika Kvartalikiri) 4/2010
10 TALLINN D EVELOPMENT PLAN 2 0 1 4 – 2 0 2 0 C ENTRAL STRATEGI C D EVELOPMENT TREN D S , RELATE D TAS K S AN D SOLUTIONS 11
Figure 7. Employed persons by industry, 2008–2012 The housing market has also undergone Figure 9. The number of authorised dwellings, 2008–2012
Source: Statistical yearbook “Tallinn arvudes”
(Tallinn in numbers), 2013 rapid changes. If 2007 can be considered
45.0 the peak of rapid growth, then in 2008 a 8000
2008 2009 2010 2011 2012 sharp decline caused by the economic
40.0 Tallinn Harju county Estonia
crisis began. However, it is noteworthy
35.0 7000
that the majority of new residential areas
30.0
are concentrated particularly near the city
25.0 limits and in close proximity to the coastal 6000
20.0 area where, due to the high price of land,
15.0 new urban areas with apartment build- 5000
10.0 ings have also been built.
5.0
In absolute terms, the number of new 4000
0.0 dwellings built in Tallinn in recent years is
Education
Manufacturing
Wholesale and
retail trade
Transportation and
storage
Public administration
and national defence
Health care and
social welfare
Professional, scientific
and technical...
Accommodation
and catering
and recreation
Information and
communication
Real estate activities
Financial and
insurance activities
Other activities
Arts, entertainment
Construction
Administrative and
support service
activities
higher than in the other local governments 3000
of Harju County combined (Figure 9). A
remarkable difference between Tallinn and
the rest of Harju County lies in the size of 2000
added dwellings. While the majority of
new living spaces in Tallinn have 3 rooms 1000
or less, then in the rest of Harju County
nearly half of all new housing in residential 0
In 2012, the processing industry buildings have four or more rooms. Also,
Figure 8. The average monthly gross wages in 2008–2011 2004 2005 2006 2007 2008 2009 2010 2011 2012
was once again the largest in Tal- in total numbers, a greater number of
linn’s employment structure, fol- 1200 larger houses, which are more suitable for Source: Statistical yearbook “Tallinn arvudes” (Tallinn in numbers), 2013
lowed by wholesale and retail Estonia Harju county Tallinn families with children, have been built
trade, transportation and storage 1000 outside of Tallinn than in Tallinn. However,
(Figure 7), which have developed the proportion of smaller apartments in
rapidly in recent years. However, Figure 10. The number of authorised dwellings in Tallinn,
800 other areas of Harju County has risen only 2008–2012
the creators of new jobs are hav- recently, during the real estate boom years
ing difficulties finding a qualified 3500
600
workforce. Along with the rapid growth of housing
apartments with 5 and more rooms
construction, real estate prices rose sharply
In parallel with the development 400 4-room apartments
until the beginning of 2007, significantly 3000
and structural changes of entre- outpacing wage growth. At the beginning of 3-room apartments
preneurship, incomes have also 200 2008, demand exceeded supply on the real
increased rapidly (Figure 8). The 2-room apartments
estate market, to a large extent, and real 2500
gross wages of the residents of 0 estate prices dropped sharply. The decreased studios
Tallinn is higher than the Esto- 2008 2009 2010 2011 demand has, in particular, influenced real
nian and Harju County average. Source: Statistical yearbook “Tallinn arvudes” (Tallinn in numbers), 2013 estate projects with a large oversupply in the 2000
The wages in Tallinn are, how- suburban municipalities; high-quality dwell-
ever, far from the average level in the Nordic countries. Tallinn must continue to make efforts to obtain municipal ings in a good location in Tallinn have been
Therefore, in order to increase the competitiveness in the ownership of lands from the state and to encourage the influenced to a lesser degree.
labour market, it is essential to improve the productivity of utilisation of available land. 1500
work. This, in turn, requires serious structural changes in In the case of demand on the housing
the economy and business, along with the development of The improvement of infrastructure and construction of new market, the fact that the need for new
labour quality. streets (i.e. the Tartu Highway breakthrough) have signifi- housing is still high should be taken into 1000
cantly improved the appearance of the city, movement of account, in so far as in Estonia the living
Over the past decade, Tallinn’s urban space has become residents and access. Despite the establishment of infra- space per person is about two times less
more attractive thanks to the construction of many new structure and investments aimed at improving the availabil- than in the more developed European 500
buildings (banks, shopping centres, office buildings, apart- ity of urban space, industrial undertakings and warehousing countries. The main restriction is, however,
ment buildings, leisure centres, sports facilities and cultural businesses have moved out of the city. Also, a large number a lower income compared to Western and
objects), the development of the business district and the of less-skilled and less costly (manufacturing) jobs have Northern Europe, and the fact that loans 0
upkeep and renovating of old houses. Land use intensity moved to surrounding municipalities. If Tallinn receives are less available and the price has 2008 2009 2010 2011 2012
has increased in the city centre and around the main streets expensive jobs, then the human resource must also adapt increased. So, the need for housing in Tal-
in the city. However, there are extensive plots of land in the to these changes, and this requires the preparation of a Source: Statistical yearbook “Tallinn arvudes” (Tallinn in numbers), 2013
linn remains high. Since the location, the
urban space that are still under-utilised and not maintained. high-quality workforce. availability of social infrastructure, the
12 TALLINN D EVELOPMENT PLAN 2 0 1 4 – 2 0 2 0 C ENTRAL STRATEGI C D EVELOPMENT TREN D S , RELATE D TAS K S AN D SOLUTIONS 13aesthetic value of the surrounding envi- Figure 11. Real estate prices and gross wages in euros in people from the surrounding rural municipalities. Analysis and home, but also ensures the availability of urban leisure
ronment and safety are considered par- Tallinn, 2008–2011 has identified that every day 38 500 people commute to opportunities, and fulfils other needs of the residents. For
ticularly important in the choice of a resi- work in Tallinn from the hinterlands and that 20 100 people many families who have moved to the suburbs, the infra-
dence, Tallinn needs to make efforts for the from Tallinn regularly commute to work in the hinterlands. structure and services of Tallinn continue to be vital. There-
1600
provision of a unique living environment Gross salary in Tallinn Eighty-seven per cent of new dwellings are located in the fore, apartments near the city are valued. People would
that offers different opportunities, Price per square metre
municipalities of the so-called golden circle.9 During the rather continue living the urban lifestyle in conditions they
whereas particular priority must be given 1400 last 10 years the traffic flow across the city border has more are accustomed to on the border of Tallinn than in more
to the development of residential areas than doubled, reaching approximately 250 000 vehicles per remote houses offering more privacy. Choosing a place of
with a more separated planning structure, day. Due to the increase in traffic intensity, the average residence is also influenced by the logistical problems aris-
so-called low-density planning structure. 1200 speed of vehicles in the city has decreased. Transportation ing from mobility needs, since the public transportation
The apartment buildings from the 1950- of the workforce to businesses that moved out of Tallinn connection is somewhat better in towns and settlements
60s in Tallinn are indeed past their struc- 1000 also causes problems, since the organisation of public located near the city limits.
tural lifetime, but their technical condition transportation from residential areas to industrial areas
differs from building to building. A large near the city is difficult, therefore businesses are forced to Needs and possibilities for their fulfilment
number of these houses can be renovated 800 provide their employees with transport themselves. Economic development and growth are directly reflected in
and used, but they are morally outdated the budget of the city by the income tax that is distributed
and may drop out of the apartment mar- There are some differences between the movement pat-
600 terns of residents of Tallinn and neighbouring municipalities from the state budget, as well as in the state's ability to
ket en masse. Therefore, it is important to support local investments. The amount of revenue deter-
initiate preliminary surveys and the draft- who are commuting to work. In Tallinn, 43% of the residents
mainly use public transportation to go to work, in the sur- mines the city's ability to improve the quality of life in the
ing of plans by larger land units, in coop- 400 city, provide public services and make the city attractive to
eration with apartment associations. rounding municipalities the number is only 23%. The situ-
ation is different in the use of a personal car – 28% of Tal- residents and investors in different ways. The wishes of
Changes in life and work, and the develop- 200 linners drive to work, whereas 42% of the residents of residents regarding their choice of residence depends on
ment of land use functions, has led to surrounding municipalities do the same. One of the main economic growth. If consumer preferences change,
important changes in the movement reasons is certainly the better performance of the public demands on local government services and development
0 activities also change. In growing economies, the expecta-
directions of residents. The whole move- transportation network in Tallinn compared to public trans-
ment environment requires review and the 2008 2009 2010 2011 portation in rural municipalities or between rural munici- tions of residents towards public services and the develop-
preparation of a comprehensive mobility palities or between a rural municipality and Tallinn. ment of the city also increase; however, financial problems
Source: Statistical yearbook “Tallinn arvudes”
plan. It can already be seen now that Tal- (Tallinn in numbers), 2013 increase the need for public benefits. Reduction of the local
linn is a very important work place to many The length of Tallinn’s public transport lines have been remained government revenue base in 2009 placed an additional
at roughly the same level over the past few years; however, the burden on the city to preserve the volume and quality assur-
number of trips with public transport has increased. ance of public services in the coming years.
Figure 12. The main way of going to work
The need for structural changes in the economy requires
50% Figure 13. Number or trips with the public that the city's business policy promotes companies switch-
Tallinn
transportation of Tallinn, 2008–2011 ing to innovative, knowledge-intensive and more value-
43%
Neighbouring 45% adding jobs, as well as flexible workforce education and
42%
% main way of going to work
rural 160 retraining opportunities. It is even more important is to
40% sõitude arv
municipalities
create a business environment that is characterised by a
140
35% flexible labour market and employees' readiness for change
28% 120 and willingness to take the risk of creating their own com-
30% pany. In the implementing of innovative initiatives, it is
23% 23% 100
25% important to support the activities of business incubators,
17% 80 including creative incubators. The prerequisite for increas-
20% ing the value of the urban environment is the increase of
60 knowledge-intensive employment, the balanced placement
15%
40 of living and working spaces, and the availability of different
10% modes of transportation that are as economical and good
7% 7%
3% 20 as possible. Mobility gives employees the opportunity to
5% 2%
1% 3% find a favourable job and the companies have the opportu-
0
0% 2008 2009 2010 2011 nity to select a workforce.
Other
By bicycle
By public
transportation
By company
transportation
By private car
(or by taxi)
On foot
Source: Statistical yearbook “Tallinn arvudes” (Tallinn in It is important to continue the building and expansion of
numbers), 2013
municipal markets to support small businesses and create
stable markets. Since 2009, the city authority Markets of
In the case of Tallinn and its nearby rural municipalities, Tallinn (Tallinna Turud) has opened or reconstructed at least
public transport not only allows one to move between work one municipal market each year in different city districts
Source: Kõre, J., Murakas, R. (2006). Survey of residential areas of Tallinn and neighbouring municipalities.
9
Ahas, R., Jauhiainen, J., Silm, S., Nuga, M., Tähepõld, A., Saluveer, E., Kivi, K. (2007). Cooperation perspectives of municipalities in the Tallinn
metropolitan area. Tartu, University of Tartu;
14 TALLINN D EVELOPMENT PLAN 2 0 1 4 – 2 0 2 0 C ENTRAL STRATEGI C D EVELOPMENT TREN D S , RELATE D TAS K S AN D SOLUTIONS 15(Nõmme, Lasnamäe, Mustamäe and the Kalaturg Fish Mar- certainly the achievement of a strong position in the inter- Tallinn should also launch a program to make the city centre Highway, is of vital importance. Reconstruction of Peterburi
ket) The plan is to expand the municipal market model to national division of labour. For this purpose, it is important more attractive, because most tourists are consumers of Rd. and Tehnika St., continuing with the reconstruction of
the flower market on Viru St. 26. to develop unique regional centres, such as Ülemiste City the culture offered in the city centre. It is in the interest of Pärnu Hwy. and Suur-Sõjamäe St., and the reconstruction
and Tallink City, and to update the infrastructure of Kopli an attractive Tallinn to restore the Tallinn Linnahall and the of Gonsiori St. with a priority system for public transport,
Structural changes in the economy require a comprehensive Peninsula, along with opening the coastal areas to the sea. Creative Hub and to develop Kadriorg Park, the Tallinn Zoo are important. In terms of the development of infrastruc-
educational system that takes the students' and society's and the Tallinn Botanic Garden. ture, cooperation with the state is necessary for the con-
needs into account, and where a smooth transition is guar- With new developments, it must be ensured that they do struction of the Väo intersection, Tallinn’s small roundabout
anteed from one level of education to another. High-quality not exert excessive pressure on the Old Town of Tallinn, one Urban planning must focus more on planning by larger land and the Haabersti intersection, together with expansion of
retraining and advanced training opportunities for adults of the sites listed on the UNESCO World Heritage List, and units, which requires changes in legislation. The city must Rannamõisa Rd. and Paldiski Hwy. It is necessary to study
are becoming increasingly important; these are the prereq- that modern solutions would not ruin the observability of prevent various conflicts of functions that arise from the the feasibility of a Tallinn-Helsinki international undersea
uisites for the fast switching of jobs and transition into the Old Town. The location of high-rise buildings and the intensification of land use, conflicts that, in the shorter or tunnel and update the mobility plan for Tallinn.
areas of greater income. The key word is cooperation thematic plans of areas of cultural and environmental value longer term, may weaken competitiveness (i.e. development
between schools, the city, the state and businesses. In terms must be taken into account. In order to get the best spatial of commercial buildings in the contact zone of the Old Town In the development of light traffic routes in Tallinn, it is
of cluster development, the expansion of business relations and architectural solutions, it is important to organise vs. Old Town as a tourism product). The intensification of land important to continue the building of connecting roads
in the Baltic Sea region, as well as globally, in order to realise architectural competitions. use represents both a threat and an opportunity to improve between light traffic routes in city districts and the city centre,
the prerequisites of Tallinn for the development of clusters tourism. Pressure on established tourist attractions and incl. the construction of the connected bicycle and pedestrian
in high-tech manufacturing, ICT, maritime and logistics, A part of the structural shift in the economy is the reduction recreational areas must be avoided. On the other hand, new path in West-Tallinn and participation in the joint projects of
creative industries and biotechnology, is important. One of lower cost as a prerequisite for the development of tour- development projects should be seen as a means to design neighbouring municipalities titled "Developing the network
condition for increasing the competitiveness of Tallinn is ism and its disappearance in the long term. Therefore, architectural points of interest, both individual buildings and of light traffic routes in Harju County". The light traffic routes
improving the quality of tourism projects and services, larger areas (e.g. coastal areas). For the expansion of develop- of neighbouring municipalities must be connected to the
creating new products and active marketing are important. ment activities it is necessary that the state transfer land, in city's network of light traffic routes, and it is also important
Figure 14. Light traffic routes in Tallinn
a much greater extent, to municipal ownership. to ensure a safe network of light traffic routes in the city
centre. For the period of the development plan, light traffic
In order to increase the attractiveness of the city and make routes have been planned along the following sections: Män-
Bicycle and pedestrian path
Bicycle path to be built in 2013 and 2014 the city more attractive to visitors, access to coastal areas and niku Rd., Ranna Rd., Soo St., Tehnika St., Telliskivi St., Ülemiste
the preservation of areas of cultural and environmental value, intersection light traffic routes, Lääne-Tallinn light traffic
and the upkeep of parks and squares, must be ensured. Pur- route (from Akadeemia Rd, to Paldiski Hwy.), and Pelguranna
suant to the environmental strategy of Tallinn until 2030, the St. (from Paldiski Hwy. to Stroomi Beach).
idea of Tallinn receiving the European Green Capital award
by 2018 must be included in the action program. It is also important to continue the increased construction
of pedestrian walkways. Access to schools and nursery
To slow down the growth of vehicle ownership, alternative schools must be ensured, especially on foot and by bike, so
modes of transport that are comparable to the usage of a that youngsters would develop the habit of using these
car must be created. It is especially important to improve means of transport. It is necessary to ensure that people
the accessibility of urban space by increasing the impor- with disabilities have access to cultural and educational
tance of public transport (incl. railways) and the accessibility institutions and public authorities.
of light traffic routes. Development of tram traffic and the
creation of a quick connection to Lasnamägi and Tallinn The development of the city’s environment and infrastruc-
Airport help to create a better traffic environment that ture is based on the principles of the guide of the Astangu
should be treated in the context of management of urban Vocational Rehabilitation Centre from 2012, titled "Design-
space and the combined use of different modes of trans- ing and creating an environment that involves everyone”:
port. Ways must be found to develop public transport that • respect – the environment shall respect all different
is more environmentally friendly, while increasing the speed users, no-one should feel excluded, and everyone shall
of the public transport vehicles, building public transport have access;
lanes and developing the "Park and Ride" system and the
unified ticket system of Tallinn and Harju County. In terms • safety – the accessible environment shall be risk-free for
of developing public transport, participation in the 7th EU all users; all elements of the environment shall take
Framework Programme CIVITAS MIMOSA is important. safety into account (non-slip floors, no readily detachable
elements, etc.);
An important set of measures for the development of Tal- • healthiness – the environment shall promote a healthy
linn’s street network is the construction of east-west main lifestyle and use, and shall not be a threat to someone's
roads passing through the Ülemiste junction. The construc- health or cause problems for users with health problems,
tion of Põhjaväil depends on the participation of the state such as for persons with allergies;
and the Port of Tallinn, and on receiving foreign funding.
Recreational and forest areas are to be avoided during the • functionality – the primary functionality of the environ-
construction of main roads. The construction of the ment shall be consumable by everyone without any
Ülemiste junction, together with the reconstruction of Tartu problems;
16 TALLINN D EVELOPMENT PLAN 2 0 1 4 – 2 0 2 0 C ENTRAL STRATEGI C D EVELOPMENT TREN D S , RELATE D TAS K S AN D SOLUTIONS 17• clarity – all users shall be able to orient in the environ- and relatively weak development activities. Such a contradic- • reconstruction of the bastions zone in the Old Town of 2.3 Socio-cultural development
ment without much effort, therefore all the information tory position is clearly not sustainable. Tallinn's economy, as is Tallinn;
must be clear and appropriately placed. the case with Estonian’s economy as a whole, requires aggres- • renovation of municipal and social housing and former The importance of Tallinn, the country’s largest centre and
sive modernisation. The time for economic growth based on dormitories (incl. improving their energy efficiency); capital, for residents of other areas of Estonia has been
Since Tallinn is a maritime city, the development of the port extensive borrowing is over and the new rise of the economy • construction and renovation of energy-efficient social increasing. The impact area of Tallinn is the whole of Esto-
area is very important, incl. the ensuring of smooth access is based on differentiation, unique skills, productivity and new housing units; nia, with over 90% of the residents of neighbouring areas
to ports in the city and in the surrounding areas, creating investments. Flexibility of the whole labour market and in the • family homes under the project Lastele perelähedane somehow related to the capital; in Southeast Estonia, this
improved pedestrian access between the passenger ports business environment helps to leave the recession more effi- elukeskkond (project that fosters family-like living condi- number decreases to 25%
and the city, and continuing the construction of light traffic ciently and painlessly in the coming years and to more effec- tions for children from orphanages): Künni St. 9, Veerise
routes. The reconstruction of the Port of Aegna and Katariina tively prepare for the new economic growth. St. 26 and Veerise St. 28; Unlike the 1990s, the new century until 2008 was charac-
Quay and tidying of the beaches of Aegna Island are vital • establishment of the Tallinn Botanical Garden's learning terised by the overall prosperity and rapid growth of Tallinn’s
for the development of marine tourism. Supporting the Investment projects planned with external funding garden population. Social inequality has also not increased in recent
development of yacht harbours and small craft quays is also Regarding technical infrastructure objects: years in Estonia, including Tallinn, rather it has slightly
important to the city. Regarding public transport: diminished. Nevertheless, the stratification of the popula-
• reconstruction of tram line No. 4 infrastructure; • purchase of new energy-efficient trams and trolley tion compared to Nordic cities is strong. Large families,
In the interests of the development of Tallinn are the reor- • construction of the Kalamaja bypass (Kalaranna Street); buses; single-parent families and families where the parents are
ganisation of the rail transport service and a reduction in • construction of Põhjaväil (depending on the participation • construction of the Ülemiste transfer terminal. unemployed find themselves in an especially difficult posi-
the carriage of dangerous goods. In order to eliminate safety of the state and the Port of Tallinn, and on the receipt of tion. Since the interim growth in employment has been
issues at same grade rail and road crossings, it is necessary foreign funding); Regarding safety and law and order:
replaced since 2008 with the growth of unemployment due
to reconstruct the Pääsküla and Nõmme crossings and the • construction of light traffic routes; • reconstruction of street lighting in Tallinn; to the recession, then a growth in the number risk groups
Tondi railroad crossing as a grade-separated crossing. Resi- • finishing the Haabersti intersection; • renovation and reconstruction of traffic control devices and a worsening of coping difficulties is to be predicted.
dents must be educated on how to prepare for emergencies • reconstruction of Peterburi Road; in order to make traffic flow smoother and cause less
and how to behave in case of an emergency. • reconstruction of Gonsiori Street; pollution; Compared to other regions of Estonia, in Tallinn the number
• reconstruction of the Port of Aegna; • modernisation of public transport information and com- of people living below the poverty threshold is significantly
In the collaboration between Tallinn and neighbouring • construction of the Suur-Sõjamäe storm water manage- munication systems. lower, and the average income is also higher. The social secu-
municipalities, the following needs arise: the need to invest ment system; rity system of Tallinn has developed in the direction, where
in the entry and exit routes to Tallinn, the need to develop • developing the tramway system to Ülemiste and the volume of financial aid that is independent of income
sustainable multimodal transport and follow a coordinated Lasnamäe;
housing policy, optimise the educational network, promote • project “Tallinn Tram” (Phase I – reconstruction of the Figure 15. The proportion of people associated with Tallinn
leisure and recreation in green spaces, cooperation in Lasnamäe-Tallinn city centre and Kopli tramway, and the
domestic and foreign tourism, etc. A meaningful leisure turn around on Laikmaa St.);
experience requires the reconstruction of the water system • optimisation of the public transport route network;
around the north-east pond of Kadriorg Park, along with • Phase II construction works of the J. Smuuli Road railway
the fountains of Snelli pond and the park, the construction viaduct and reconstruction of Suur-Sõjamäe St. (Kesk-
of Pirita Beach fortifications, the development of Pirita Sõjamäe St. – city limits);
Beach and the design and construction of rest areas along • construction of the roadway from the Port of Tallinn, incl.
the Pirita River Landscape Protection Area are necessary. reconstruction of the Tuukri/Nafta and Petrooleumi St.
For the administration of the industrial area around Tallinn, intersection;
it is necessary to build a network of main roads around • reconstruction of Narva Hwy. (Russalka intersection – J.
Tallinn that, in addition to cars, also includes rail traffic. Smuuli Rd.);
Construction of the Tallinn railway bypass enables a reduc- • reconstruction of J. Smuuli Rd. (Narva Hwy. to Peterburi Rd.);
tion in the traffic load of the capital city as well as the • reconstruction of the Kopli tramways;
removal of environmentally hazardous cargo. • reconstruction of the Pääsküla railway crossing;
• reconstruction of the Nõmme railway crossing;
In terms of regional economic development, Tallinn in the • construction of Tondi grade-separated junction;
context of Estonia is a highly competitive economic centre, Regarding environmental objects:
where the majority of international company headquarters
are located. The preservation and strengthening of the logisti- • preparation of urban storm water management schemes
cally central position of Tallinn depends, first and foremost, and facilities for preventing floods caused by rainwater;
on the development of infrastructure across the territory of • improving the infrastructure of beaches;
the state as a whole; this, however, is not in the direct sphere • improving the maintenance, water supply and other
of activities of the city's administrative agencies. infrastructure in city cemeteries;
• tidying the forest stands, parks and green areas in the city.
The economy in Estonia has been driven by the rapid growth Regarding the urban infrastructure objects:
of indebtedness and domestic consumption, the negative
aspects of which are low yield, focus on low value-added activi- • reconstruction of Tammsaare Park and Theatre Square;
ties, lack of cooperation and networking between companies Source: R. Ahas, J. Jauhiainen et al 2007
18 TALLINN D EVELOPMENT PLAN 2 0 1 4 – 2 0 2 0 C ENTRAL STRATEGI C D EVELOPMENT TREN D S , RELATE D TAS K S AN D SOLUTIONS 19You can also read