SADC Financial Inclusion Strategy - (2016 - 2021) - FinMark Trust
←
→
Page content transcription
If your browser does not render page correctly, please read the page content below
SADC Financial Inclusion Strategy

                   (2016 – 2021)

       Approved by Summit in XXX on XX August 2016
SADC Financial Inclusion Strategy

TABLE OF CONTENTS
List of Acronyms ...................................................................................................................................... 3
List of Tables and Figures ........................................................................................................................ 4
Context and positioning .......................................................................................................................... 5
Executive Summary................................................................................................................................. 6
1.     What is the general importance of financial inclusion and potential impact for SADC?.............. 12
     1.1.     What is financial inclusion?................................................................................................... 12
     1.2.     What is the current state of financial inclusion in SADC?..................................................... 15
     1.3.     Why is Financial Inclusion important? .................................................................................. 18
2.     What are the barriers to financial inclusion and the required interventions in SADC? ............... 36
     2.1.     What are the barriers to financial inclusion?........................................................................ 36
     2.2.     What are the interventions that SADC should focus on? ..................................................... 45
     2.3.     What interventions currently exist? ..................................................................................... 51
     2.4.     Driving large scale initiatives through a multi-stakeholder approach .................................. 52
     2.5.     Which interventions are best suited for a regional approach? ............................................ 54
3.     What is the way forward? ............................................................................................................. 58
     3.1.     What is the theory of change for financial inclusion? .......................................................... 58
     3.2.     Next steps to operationalise the strategy............................................................................. 59
     3.3.     Proposed organisational structure ....................................................................................... 60
     3.4.     Monitoring framework.......................................................................................................... 61

                                                                           2
SADC Financial Inclusion Strategy

LIST OF ACRONYMS
AfDB      African Development Bank
AML/CFT   Anti-money laundering / Countering Financing for Terrorism
APEC      Asia Pacific Economic Cooperation
ATMs      Automated Teller Machines
AU        African Union
B2G       Business-to-government
BCEAO     Central Bank of West African States
BICICI    Banque internationale pour le commerce et l'industrie de la Côte d'Ivoire
BoP       Bottom of the Pyramid
CAADP     Comprehensive Africa Agriculture Development Programme
CBK       Central Bank of Kenya
CCBG      Committee of Central Bank Governors
CCU       Country Coordination Unit
CISNA     Committee of Insurance, Securities and non-banking Financial Authorities
DES       Deputy Executive Secretary
DfID      Department for International Development
DFIs      Development Finance Institutions
DFRC      Development Finance Resource Centre
DFS       Digital Finance Solutions
DRC       Democratic Republic of Congo
EAC       East African Community
EASSy     Eastern Africa Submarine Cable System
FATF      Financial Action Task Force
FDI       Foreign Direct Investment
FMI       Financial Market Infrastructure(s)
FSPs      Financial Service Providers
GDP       Gross Domestic Product
ICPs      International Cooperating Partners
ICT       Information and Communication Technology
ID        Identity Document
KYC       Know Your Customer
M&E       Monitoring and Evaluation
MAP       Making Access Possible
MNOs      Mobile network operators
MSME      Micro, Small and Medium Enterprises
NGOs      Non-governmental organisations
NICTBB    National Information and Communications Technology Broadband Backbone
ODA       Official Development Assistance
P2G       Person-to-government
P2P       Person-to-person
PMO       Project Management Office
PMU       Project Management Unit
POS       Point of Sale
RAP       Regional Agricultural Policy
RISDP     Regional Indicative Strategic Development Plan
SACCOS    Savings and Credit Cooperatives Society
SADC      Southern African Development Community
SGBCI     Société Générale de Banques en Côte d'Ivoire
SIRESS    SADC Integrated Regional Electronic Settlement System

                                             3
SADC Financial Inclusion Strategy
SME Small and medium enterprise
SMMEs Small, medium and micro-sized enterprises
SMS Short message service
SSA Sub-Saharan Africa
STEM Science, Technology, Engineering and Math
TVET Technical, Vocational, Education and Training
UMOA West African Monetary Union
UNCDF United Nations Capital Development Fund
USD United States Dollar
VSLA Village, Savings and Loans Associations
LIST OF TABLES AND FIGURES
Figure 1: Dimensions of financial inclusion........................................................................................... 13
Figure 2: Financial Access by country (in percent with upper middle income countries highlighted) . 16
Figure 3: Quality of financial inclusion in SADC (in percent) ................................................................ 17
Figure 4: Uptake of financial products and services in SADC ............................................................... 18
Figure 5: SADC tax revenue (percent of GDP)....................................................................................... 20
Figure 6: Net remittances received within SADC countries (million USD) ............................................ 22
Figure 7: Impact pathways of financial inclusion on agricultural production and processing ............. 23
Figure 8: Enterprise segment by size within SADC region (percent of firms surveyed) ....................... 26
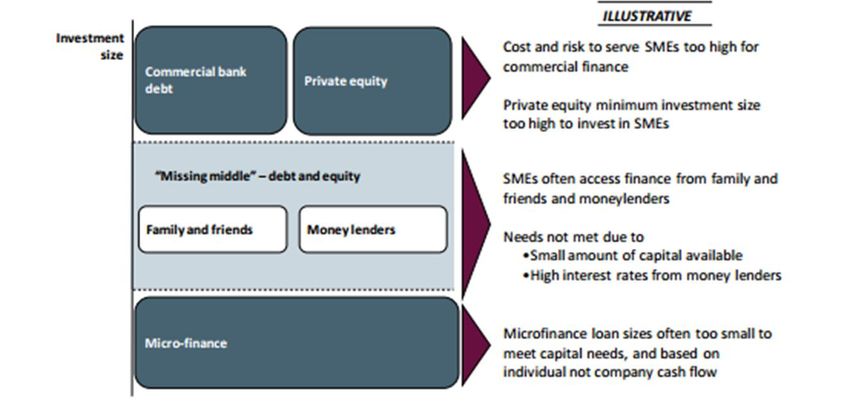
Figure 9: Challenges to SME financing .................................................................................................. 27
Figure 10: Relationship between financial inclusion and mobile cellular penetration (in percent,
subscriptions per 100 people) .............................................................................................................. 29
Figure 11: Overview of the evolution of digital finance in expanding and deepening financial inclusion
.............................................................................................................................................................. 31
Figure 12: Net primary, gross secondary and gross tertiary education enrolment in SADC (percent) 32
Figure 13: Positioning of the areas of focus and activities across product areas ................................. 45
Figure 14: Intervention categories that can drive financial inclusion in SADC ..................................... 49
Figure 15: Stakeholders currently active in the financial inclusion space in SADC (illustrative) .......... 51
Figure 16: Alignment of key intervention categories to a regional approach ...................................... 55
Figure 17: An illustrative Theory of Change for financial inclusion ...................................................... 58
Figure 18: Link between regional and national strategies and illustration of two proposed regional
structures .............................................................................................................................................. 60
Figure 19: Key indicators to measure regional progress in financial inclusion..................................... 62
4SADC Financial Inclusion Strategy
CONTEXT AND POSITIONING
This document outlines the strategy on Financial Inclusion for SADC. Financial inclusion requires
strategy development, policy alignment and stakeholder involvement in each of the SADC member
states individually, responding to the specific challenges, needs and requirements in that country.
Over and above that, alignment between SADC member states is required to address regional issues
to support regional financial integration. Such topics include regulatory harmonisation and
alignment, the lack of which hampers incentives for FSPs to expand internationally and complicates
cross-border remittances.
As a regional body working in close collaboration with its independent member states, SADC is best
placed to drive financial inclusion in the region through three key interventions::
- Providing support to individual member states in the development and execution of their
own financial inclusion strategy
- Convening stakeholders in a regular platform to share learnings, collaborate on shared
solutions and track progress
- Coordinating on regional topics and solutions
This strategy contains a rationale and proposal for the set of activities that SADC will undertake to
further regional financial inclusion and thus focuses on support to member countries, regional
convening and coordination on cross-border challenges. It cannot replace country strategies but
aims to be complementary to and supportive of member country strategies. It does not prescribe
what member country strategies need to cover and what they need to look like as that needs to be
tailored to the country situation and challenges. That said, it can provide specific support to these
countries which is outlined in this strategy. To that end, SADC and its implementing partners will
draw on a ‘toolbox’ of support offering.1 It also aims to define an ambition for member countries by
articulating metrics and targets to be tracked.
The SADC Council of Ministers tasked SADC with the development of this financial inclusion strategy,
recognising the crucial importance of financial inclusion and SME access to finance for the core area
of Industrial Development and Market Integration in the Revised Regional Indicative Strategic
Development Plan (RISDP) and the SADC Industrialisation strategy and roadmap. Two key elements
in that are the Regional Agricultural Policy (RAP) and the Regional Infrastructure Master Plan with a
key focus on ICT. Given this mandate, this draft strategy draws an explicit link to demonstrate the
contribution of financial inclusion to industrialisation. This emphasis does not mean that
industrialisation is the sole contribution financial inclusion can make. In fact, if designed and
implemented appropriately, financial inclusion will contribute to sustainable economic growth and
stability and improve livelihoods.
After creating a shared definition and understanding of financial inclusion, this document outlines
the importance of financial inclusion in SADC with a particular emphasis on its contribution to
industrialisation. Subsequently, it highlights the barriers to financial inclusion and sketches the
current landscape of interventions. Driven by the positioning, mandate and the capacity of SADC in
relation to the other stakeholders, this strategy then identifies priority areas for intervention by
SADC in financial inclusion which form the cornerstone of the proposed strategy.
1 The specific elements in the toolbox are not described in this draft strategy – they will be identified and developed as the
strategy is implemented.
5SADC Financial Inclusion Strategy
EXECUTIVE SUMMARY
The primary orientation of this Strategy is to support SADC Member States in the development and
implementation of their own National Financial Inclusion Strategies. As such, this Strategy is regional
in nature and aligns with the aspirations of the Regional Indicative Strategic Development Plan (RISDP)
and the SADC Industrialisation Strategy and Roadmap. The target audience for this Strategy is primarily
national and regional stakeholders working to address regulatory and supply-side constraints to
financial inclusion. It is envisioned that this Strategy will provide an overview of the context in SADC
and assist in coordinating efforts around a common vision and goal under the leadership of the SADC
Secretariat.
What is financial inclusion?
Across the African continent, governments have begun to realise the pivotal role financial inclusion
can play in combatting poverty and contributing to inclusive economic growth. Growing bodies of
evidence have shown that financial sector deepening is crucial to the process of economic
development, and how finance can positively impact the poor by reducing income inequality and
expanding employment.2 Recent innovations in financial services for low-income groups, in particular,
has shown governments how financial inclusion can strengthen the resilience of vulnerable and
marginalised populations. As a result, a number of countries on the continent and in the region have
begun to develop national financial inclusion strategies and spearhead key programs and initiatives to
improve financial markets.
Financial inclusion refers to the delivery of financial services and products in a way that is available,
accessible and affordable to all segments of society and plays a pivotal role in combatting poverty
and contributing to inclusive economic growth. The three main dimensions of financial inclusion are:
Access: the combination of both the availability and appropriateness of financial products and
services;
Usage: the frequency of interaction with the product or service; and
Quality: the combination of product fit, value add, convenience and risk.
In addition to the aforementioned dimensions, exclusion can also be voluntary or involuntary and
activities to drive inclusion should focus on involuntary exclusion, which results from low incomes and
high risk profiles of the un- and underserved segments of society.
Financial products and services for those who are in some way included, can be provided in the formal
or informal arena, which not only influences access and affordability, but also predictability or product
performance, consumer protection and effectiveness. The adult population and businesses accessing
financial services and products can be segmented into three main categories:
The “Banked” population refers to individuals and businesses who have/use services provided
by an institution operating under a banking license which is regulated by the regulatory
authority of the country.
Other formal (non-bank) refers to individuals and businesses who are served by other
regulated financial institutions. These adults have/use financial products and/or services
provided by regulated non-bank financial institutions such as micro-finance banks/
institutions insurance companies, retail, remittances service providers, and credit providers.
2 Beck. “Finance and Growth: Too Much of a Good Thing?”, 2014.
6SADC Financial Inclusion Strategy
The “Underbanked” population refers to individuals and businesses who have needs for
multiple products, but only have access or use a select subset of them.
The informally served refers to the adult population who do not make use of financial products
provided by regulated financial institutions. This segment of the population do not have/use any
financial products and/or services from regulated financial institutions. In many African countries the
informal financial sector is largely driven by remittances, savings groups and credit associations.
Whether through formal, or informal channels, financial inclusion encompasses four main product
categories:
Transaction [products] enable people and businesses to buy goods and services, and send
money to friends, family and business partners. They also enable government to collect taxes
and disburse social payments;
Savings and investments3 offer a safe place to save and build assets for future expenditures
such as education and agricultural inputs. Savings products also allow families, individuals,
and businesses to smoothen their consumption;
Credit provides access to capital and enables people and businesses to seize new business
opportunities or expand existing operations, and increase consumption in times of need; and
Insurance enables people and businesses to manage risk and protect themselves from sudden
shocks.
Why is financial inclusion important for SADC?
Overall, financial inclusion in the SADC region is relatively low and varies widely across countries.
Though over half of adults (66%) living in the SADC region, are financially included, 12% higher than
the continent-wide average, 41,9 million people (34%) still do not have access to either formal or
informal financial services or products. Furthermore, substantial variation exists between countries in
the region in terms of levels of access and in terms of the quality of financial inclusion.
Financial inclusion can improve livelihoods and contribute to sustainable economic growth and
stability. Specifically, as part of economic development, financial inclusion can play a catalytic and
supportive role in industrialisation which is core to SADC. That said, inclusion and the uptake of
products and services in the SADC region is relatively low and varies widely across countries, pointing
to the need for a regional strategy for financial inclusion. The SADC Industrialisation Strategy highlights
a number of barriers to industrialisation, all of which can be catalysed through greater financial
inclusion. The ways in which financial inclusion can maximise the potential of these pathways to drive
industrialisation and economic growth are summarised below and further elaborated on in Section
1.3:
Domestic resource mobilisation: Enabling the transfer of cross-border funds, increasing the
tax base, and augmenting the deposit base for the financing of low income groups and
enterprises are three tangible and impactful regional actions SADC should undertake to
mobilise domestic resources for industrialisation. Through these measures, financial inclusion
empowers consumers with tools to live more prosperous lives while supporting SMEs and
government with the capital and revenue needed to expand and industrialise the economy.
3 In the remainder of this document, this category will be referred to as ‘savings’. Whereas investment products serve a
similar purpose to savings products in terms of building and growing assets, the products most likely to be taken up first by
un- and underbanked customers to serve this purpose will be savings products (as they’re typically simpler, have a lower
risk profile and often can be drawn on at shorter timeframes without risking loss of value). To maximise financial inclusion
with limited resources, public and social sector stakeholders are advised to ensure availability of saving products first given
this typical uptake pattern. That said, the regulation, institutions and skills required to build a healthy offering of and
market for savings products are also prerequisites for investment products (necessary but not sufficient) and thus
strengthening these paves the way for investment products.
7SADC Financial Inclusion Strategy
Agricultural production and agro-processing: Agriculture stakeholders tend to be
underserved by financial institutions which limits their ability to grow and prosper. The
extension of financial products and services to the agricultural sector can improve production
and enable value addition processes. By empowering farmers with the products and services
they need to mitigate risk, save for the future, expand operations, and buy and sell over
distance, financial inclusion can not only yield enormous benefits for rural residents in SADC
but increase the yields of those farmers in turn. Financial inclusion for processing equipment
– whether through smallholder farmers or small and medium-sized enterprises – can then
spur industrialisation through greater value addition and integration into regional and global
supply chains.
Strengthening of small and medium scale enterprises: Despite the significant role SMEs play
across SADCs economy, they struggle to obtain funding from traditional sources of finance.
The financial inclusion of small and medium-sized enterprises, through credit, insurance,
savings and transaction products, increases the resilience and growth of this vital sector. A
strong SME sector, especially in manufacturing, in turn spurs employment, value addition, and
overall industrialisation of the SADC region.
Information and Communications Technology (ICT): There is a symbiotic relationship
between financial inclusion and the sophistication of a country’s ICT sector. As such, ICT
development and financial inclusion will go hand in hand, with ICT being a requirement for
financial inclusion and subsequent further inclusion providing a market need/ pull for more
sophisticated products which in turn will support the ICT sector.
Skills development: By addressing the cost-prohibitive nature of education over distance and
time, financial inclusion can increase access to education and thus develop the broader skills
of the region. Through addressing the capital constraints of educational service providers –
both public and private – financial access can expand the supply of education provided. Both
these effects spur industrialisation through the broader development of skills within the
workforce.
How can SADC drive financial inclusion in the region?
SADC can drive financial inclusion by providing support to mitigate supply, demand and
policy/regulatory barriers. Demand side barriers undermine the consumer’s ability to fully adopt and
utilise financial products and services. Supply-side barriers on the other hand limit the ability of the
financial service provider to extend products and services to un- and underserved segments of society.
Challenges on either side of the spectrum are further complicated by the policy and regulatory
environment. Section 2.1 serves to outline the barriers to financial inclusion from the aforementioned
perspectives and looks at the key trends facing the four main product categories in relation to these
barriers.
There are a number of factors affecting the availability and uptake of transactions and savings
products. Firstly, insufficient distribution channels of formal institutions severely affect the provision
of transaction and savings products, particularly in rural areas. Secondly, a lack of appropriate
transaction and savings products also play a significant role in the exclusion of low-income consumer
segments. Thirdly, the lack of a tiered KYC system for banks also poses as a significant barrier to the
provision, uptake and usage of transaction and savings products. Lastly, from a regulatory point of
view, a lack of incentives that promote interoperability also excludes certain populations from the use
of transaction products and regulatory restrictions constrain mobile money operators from offering
8SADC Financial Inclusion Strategy
interest on savings products. Furthermore, MNOs face challenges related to cash float management
which limits their ability to cash out payments.
Credit and insurance products experience extremely high barriers on the supply and demand sides,
when compared to transactions and savings product. In parallel, policy gaps within current
policy/regulatory frameworks further constrain the scale of financial inclusion through these products
across SADC. The nascent nature of insurance and credit markets across SADC, and their stage of
development, is also reflected in the policy and regulatory frameworks that govern them. FSPs often
lack the incentives to go “down-market” and in many cases, the financial and skills capacity, to provide
products to low-income and riskier consumer segments. Lack of information regarding the profiles
and demands of un- and underbanked segments also inhibits the willingness and ability of FSPs to
provide credit and insurance. From the perspective of the consumers, a lack of appropriate products
significantly impact uptake in addition to the ability of the consumer to understand product use and
functionality.
Section 2.2 identifies the interventions that SADC should focus on and highlights a preferred general
direction of travel: that of growing payments and digital financial services and orienting credit
markets towards SMEs and smallholder finance as a means to further financial inclusion. Not
surprisingly, innovations that reduce the need for either face-to-face interaction and/ or an extensive
branch network have been successful at serving the un- and underbanked. With high mobile phone
penetration in developing countries, becoming almost ubiquitous in some parts of continent and
region, digital financial services has enabled some communities to leapfrog branch banking. Similarly,
agent networks and other branchless banking models adopted throughout the continent provide
innovative ways of reaching consumers in remote areas, eliminating the need for a direct interaction
with someone in a brick and mortar institution. Where branchless banking is available, there tends to
be industry and consumer benefits. The evolution of digital financial services in particular has
drastically reduced marginal costs of inclusion, facilitated large-scale enrolment, and extended access
to remote locations, while managing to side-step challenges around financial literacy to a large extent.
Thus, countries in the SADC region, with currently low levels of inclusion have the opportunity to
leapfrog the typical development trajectory and focus strongly on digital finance services. That will
help accelerate the shift to a ‘cash lite’ society which has significant advantages in terms of growth
and bettering livelihoods.
Credit is a particular area that is in need of growth towards further inclusion – broader availability of
affordable credit for various purposes for both individuals and SMEs will have a strong developmental
effect. Moving beyond payments to expand access to credit will play an important role in enhancing
the quality of inclusion experienced by consumers in SADC. Credit markets in the region are relatively
nascent and for the most part the availability of reasonably priced credit is very limited. For those not
in formal employment, short-term credit (for consumption smoothing) is only available at high cost.
Furthermore, certain segments of society such as SMEs face a particular challenges when trying to
access productive credit. Developing credit markets that are sustainable and socially beneficial to all
players in the region will help individuals secure their livelihoods and support the growth of SMEs and
drive economic development in the region.
Interventions to address the barriers to financial inclusion broadly fall within four main categories
– funding, advocacy, research and development and finally capacity building and technical
assistance. Funding refers to interventions that facilitate the mobilisation and provision of resources
towards the attainment of identified priorities. The broad range of stakeholders and the requirement
to meet complex consumer demands in financial ecosystems will require a range of financing
mechanisms that will need to be applied in strategic ways. Examples include, challenge funds,
guarantee funds, grant funds and credit financing. Advocacy interventions seek to influence policy
9SADC Financial Inclusion Strategy
and the provision of financial services and products. For advocacy to be effective and efficient in
addressing demand-side and policy and regulatory constraints it should be based on credible evidence
and must be targeted to the correct audiences and stakeholders. Furthermore the availability of
credible data, through research and development, is key to understanding market gaps and
opportunities. Lastly, capacity building and technical assistance initiatives will serve to develop the
capabilities of state and non-government actors to drive financial inclusion at the national and regional
level.
There are a number of interventions currently underway to enhance financial inclusion in the region
that SADC could leverage going forward. Section 2.3 takes a deeper look at the trends and
opportunities that exist to drive financial inclusion in the region. The majority of stakeholders working
in the financial inclusion space at both the national and regional level, primarily on the supply-side,
are non-government entities. Non-government entities are often better placed to lead on specific
interventions or programmes given their institutional flexibility and access to technical expertise and
resources needed for implementation and scalability of interventions. Furthermore, given that a
number of International Cooperating Partners (ICPs) are already aligned at the regional level, an
opportunity exists for SADC to leverage its central position to convene ICPs to align funding activities
with regional priorities in financial inclusion. Lastly, as Member States strengthen policy around
financial inclusion at the national level, SADC has a greater role to play in coordinating activities and
targets across the region.
Section 2.4 looks at how a multi-stakeholder approach can be used to drive financial inclusion in the
region. Large-scale initiatives can be employed to address financial inclusion at both a regional and a
national level – additionally, non-government actors undertake such initiatives within a local, national
or regional context. At the regional level, entities are responsible for defining a set of shared rules to
guide initiatives by national governments and non-government actors. It is at this level that
stakeholders can also ensure or work towards policy harmonisation across their geographic area of
focus. In addition, entities operating at the regional level are responsible for creating momentum
around a shared vision or agenda to seek buy-in and commitment for this overarching vision from all
stakeholders. National entities draw on the overarching agenda at the regional level and articulate
specific national goals that take into consideration local context. In doing so, national entities take on
all three roles – rule making, market development and provide incentives for consumers and service
providers to enter the market and drive transaction volume. In addition to initiatives driven by national
entities, various non-government entities initiate, drive and lead programmes across various topics
and geographies. These need to be aligned with stakeholder and programmes at regional and national
level. At times, they do also surface issues that need to be resolved by regional/ national entities.
Addressing the multi-faceted barriers to financial inclusion will require a strong alliance between
stakeholder’s at all three levels.
SADC should select its role in driving financial inclusion based on an assessment of which
interventions are most effective and efficient at the regional level. Section 2.5 unpacks this further
to highlight the role SADC should play in terms of advocacy, research and development, resource
mobilisation and capacity building and technical assistance to drive financial inclusion in the region.
Firstly, SADC is currently best placed to drive advocacy efforts to reach common goals in financial
inclusion by using its regional position and existing structures to convene stakeholders across borders.
Secondly, SADC should also support the harmonisation of research and development for financial
inclusion within the region to standardise research and data collection methodologies to facilitate
cross-border comparison and measure regional progress. Substantial potential exists to expand SADCs
ability to mobilise resources to fund financial inclusion initiatives. If SADC were able to more effectively
mobilise resources, these resources could be pooled and distributed for greater efficiency, rather than
10SADC Financial Inclusion Strategy
be distributed in a piecemeal fashion. Lastly, capacity building and technical assistance initiatives
should be coordinated by SADC in partnership with other stakeholders. Subjects that are cross-border
or regional in nature and subjects where the required intervention is the same and can most efficiently
be delivered regionally, are most likely to benefit from increased effectiveness and/ or efficiency if
approached regionally. By contrast, subjects that require a country-specific intervention may not be
best suited to a regional intervention.
In terms of a way forward, Section 3 proposes the institution of a Regional stakeholder forum and
an implementing structure (be it a Project Management Office, a Centre of Excellence or a different
structure) be established to ensure the successful implementation of the Regional Financial
Inclusion Strategy. Whatever structure is finally chosen, it will have to focus on driving a regional
agenda in each of the four identified areas of focus – Advocacy, Research and Development, Capacity
Building and Technical Assistance and Resource Mobilisation. In staffing, SADC could choose to either;
1) develop or source these capabilities from the market, 2) enhance or repurpose existing capabilities
or 3) use a virtual structure drawing from existing capabilities. Section 3 also goes on to propose a
preliminary monitoring framework for measuring progress of the regional financial strategy.
11SADC Financial Inclusion Strategy
1. WHAT IS THE GENERAL IMPORTANCE OF FINANCIAL INCLUSION AND
POTENTIAL IMPACT FOR SADC?
Across the African continent, governments have begun to realise the pivotal role financial inclusion
can play in combatting poverty and contributing to sustainable inclusive economic growth and
stability. Growing bodies of evidence have shown that financial sector deepening is crucial to the
process of economic development, and how finance can positively impact the poor by reducing
income inequality and expanding employment.4 Recent innovations in financial services for low-
income groups, in particular, has shown governments how financial inclusion can strengthen the
resilience of vulnerable and marginalised populations. As a result, a number of countries on the
continent have begun to develop national financial inclusion strategies and spearhead key programs
and initiatives to improve financial markets. With this in mind, this chapter provides a discussion on
the concept of financial inclusion and its current state in the SADC region, followed by an examination
of how financial inclusion can drive industrialisation and the various approaches that can be employed
to address financial inclusion.
1.1. What is financial inclusion?
Financial inclusion refers to the delivery of financial services and products in a way that is available,
accessible and affordable to all segments of the population. Financial inclusion was initially measured
through a dichotomous framework, defining access according to individuals who are “banked” or
“unbanked”. This framework, erroneously assumes that inclusion will be achieved by simply offering
enough access points. As such, a more multi-dimensional understanding of financial inclusion is
required to fully understand the complexities of how underserved communities live and how they
interact with products and services. Figure 1 provides a breakdown of the current concept of financial
inclusion which looks at three main dimensions – access, usage, and quality. It is important to keep in
mind that these three dimensions do not operate independently, but reinforce each other.
It should be noted that access to finance refers to the ability of businesses and individuals to gain
access to financial products. In this regard, an individual or business can be financially included but
not necessarily have access to finance to meet all their financial needs – which means their growth
can still be inhibited. One example of this is a small business owner who may be financially included
(i.e. have a bank account or insurance product), but cannot get access to a line of credit or loan. Thus
greater financial inclusion can contribute to overcoming some but not all access to finance challenges.
4 Beck. “Finance and Growth: Too Much of a Good Thing?”, 2014.
12SADC Financial Inclusion Strategy
Figure 1: Dimensions of financial inclusion
Dimension Description Indicator Key observations
Access Access refers to the Access can be understood in two ways: Without access, uptake of
availability of affordable financial products and
and appropriate financial 1) Availability: access points to various services services is limited.
products and services. or products. These services and products can
include:
• Formal: number of ATMs and bank
branches per user;
• Semi-formal: number of microfinance
institutions, credit unions; or
• Informal: number of Village, Savings and
Loans Associations (VSLAs), or
moneylenders.
2) Appropriateness: products and services that
meet the needs of the client. For example a
VSLA as opposed to an ATM or bank branch,
may be better placed in a community
characterised by a high number of self-
employed individuals.
Usage Usage refers to the uptake Usage can be understood as follows: Usage is often used as a
or utilisation of financial proxy to determine access
products and services. 1) Frequency: the number of interactions the and uptake of financial
client has with products and services within a products and thus the
given time period. For example a client with a depth of financial
dormant bank account cannot be classified as inclusion.
financially included if they do not make use of
the product and have no other financial
products.
Quality Quality refers to product Quality can be understood in four ways: Quality also has a direct
design and functionality influence over usage i.e.
that enhance the value of 1) Product fit: products and services that are poor quality products will
services to clients. well-suited and tailored to the needs of the result in low usage.
client. Furthermore, despite its
importance quality
2) Value Add: products and services that add remains a difficult
value to the clients overall financial situation. dimension to measure
financial inclusion.
3) Convenience: products and services that are
easily accessible and user friendly.
4) Risk: access to products and services should
not increase the financial risk of consumers
e.g. over-indebtedness due to reckless lending
practices
SOURCE: Literature review; Dalberg analysis
Access is the combination of both the availability and appropriateness of financial products and
services. Facilitating access to financial services is vital as it allows the poor to increase and diversify
their income, save for education, manage risk and protect against unexpected future events. Access
includes more than just the point where “cash-in” and “cash-out” transactions can be performed. It
also speaks to the availability of appropriate infrastructure to facilitate access. In deepening access
these points need to be located in close proximity to the user, affordable and user-friendly.
Usage refers to the frequency of interaction with the product. Merely having a bank account does
not suffice as inclusion. The frequency with which the client engages with the product is much more
13SADC Financial Inclusion Strategy
telling about whether the client is financially included or not. For example, various government grants,
salary and pension payments in a number of countries are done into a mobile account by programme
design. However, many users “cash out” immediately because they experience no value. These users,
thus, have very low usage, and will not benefit from other product deployments and cannot be
counted as effectively included.
Unless the products are of high quality, meeting people’s needs, they will either choose not to access
or not use it a lot. As such, product quality is a key condition for financial inclusion. Quality speaks
to the experience of the user when accessing financial services and gauges whether the service
provided is done so in a manner that enhances value of the product to the client, from product design
to delivery. The products provided need to be tailored to the specific needs of the client, add value to
their lives and be accessible in an easy and effective manner. Without quality, there will be no usage
and it is therefore important for countries to focus on the quality of inclusion from the outset and not
wait until saturation of any one products occurs in the market.
Apart from access, usage and quality (which tends to translate into usage) as a description for the
effectiveness of inclusion, there are a few other important ways of looking at inclusion. Firstly,
exclusion can be voluntary or involuntary and activities to drive inclusion should ideally focus on
involuntary exclusion. Secondly, financial products and services can be provided in the formal or
informal arena which can differ in access and affordability, but also differ in predictability or product
performance, consumer protection and effectiveness. Thirdly, inclusion typically refers to four
different products – access to and usage of some but not all, introduces the notion of the
“underbanked”.
Individuals may be involuntarily excluded from participating the financial sector due to challenges
such as low incomes or high risk profiles.5 Individuals may also voluntarily opt out of participating.
Determinants in this regard could be lack of need for the products or services or psychological and
cultural barriers which stem from mistrust of banks and other formal institutions, either due to
negative experiences or negative perceptions.6
The adult population accessing financial services and products can then be further segmented based
upon “where” they receive financial services formally or informally.7 Formal inclusion refers to those
individuals and businesses who have/use financial products and/or services provided by a regulated
financial institution which can be a bank (operating on a banking license) or non-bank entity that is
regulated. Thus, this segmentation is as follows:8
The “Banked” population refers to individuals and businesses who have/use services provided
by an institution operating under a banking license which is regulated by the regulatory
authority of the country.
Other formal (non-bank) refers to individuals and businesses who are served by other
regulated financial institutions. These adults and enterprises have/use financial products
and/or services provided by regulated non-bank financial institutions such as micro-finance
banks9/ institutions insurance companies, retail, remittances service providers, and credit
providers.
The “Underbanked” population refers to individuals and businesses who have needs for
multiple products, but only have access or use a select subset of them.
5 Asian Development Bank. “Financial inclusion, poverty, and income inequality in developing Asia”, 2015; Dalberg analysis.
6 Shankar, S. “Financial Inclusion in India: Do Microfinance Institutions Address Access Barriers?”, 2013.
7 Finmark Trust. “Finscope South Africa”, 2014; Dalberg analysis.
8 Throughout this document, definitions of financial inclusion and financial access refer both to individuals and MSMEs.
9 It should be noted that in some countries microfinance banks have a licensing regulation that is separate from ‘regular’
banking licenses
14SADC Financial Inclusion Strategy
The informally served refers to the adult population who do not make use of financial products
provided by regulated financial institutions. This segment of the population do not have/use any
financial products and/or services from regulated financial institutions. In many African countries the
informal financial sector is largely driven by remittances, savings groups and credit associations. The
names of these rotating savings and credit issuing mechanisms may vary between countries but they
operate on very similar principles. In Malawi, Village, Savings and Loan Associations (VSLAs), are
typically made up of 15-30 members, who make individual financial contributions on a weekly basis.
The average weekly contribution ranges from 200 to 1000 Kwacha, with a 50 Kwacha contribution to
an emergency fund. This savings pool is then lent out to members who must repay with interest.
Interest averages about 20%, and is fed back into the pool of funds. At the end of each 10 -12 month
cycle the total fund is proportionally shared out between the members, based on the value of each
member’s contributions.10 Another example would be the informal money transfer market which is
highly effective in providing remittance service to international migrants in host countries. While the
informal sector benefits un- and underserved segments of society by extending services in areas
where the formal sector may not be able to, these institutions are characterised by high level of risk.
The lack of appropriate regulations and monitoring of the sector makes it difficult to: (i) leverage the
sectors potential to contribute to economic growth and development; and (ii) can also give rise to
concerns regarding consumer protection.11
Whether through formal, or informal channels, financial inclusion encompasses four main products:
Transaction [products] enable people and businesses to buy goods and services, and send
money to friends, family and business partners. They also enable government to collect taxes
and disburse social payments;
Savings and investment products12 offer a safe place to save and build assets for future
expenditures such as education and agricultural inputs. Savings also allow families, individuals,
and businesses to smooth their consumption;
Credit provides access to capital and enables people and businesses to seize new business
opportunities or expand existing operations, and increase consumption in times of need; and
Insurance enables people and businesses to manage risk and protect themselves from sudden
shocks.
1.2. What is the current state of financial inclusion in SADC?
Overall, financial inclusion in the SADC region is relatively low and varies widely across countries.
Though over half of adults (66%) living in the SADC region, are financially included, 12% higher than
the continent-wide average, 41,9 million people (34%) still do not have access to either formal or
informal financial services or products, as illustrated in Figure 2. 13 At the country level however, 90%,
86% and 81% of the adult population in Mauritius, South Africa, and Lesotho, respectively, are
classified as financially included. Conversely, countries such as the Democratic Republic of Congo,
Malawi and Mozambique are experiencing extremely low levels of financial inclusion, with over 50%
of the population lacking access to financial services of any kind.14
Low regional performance and substantial variation between countries points to the need for a more
coherent financial inclusion strategy. Low overall performance also has cross-border implications of
stifling the growth of the financial sector across the region, while variation between countries make it
10 Making Access Possible. “Malawi Country Diagnostic Report”, 2015.
11 SAIIA. “Promoting Financial Inclusion for Inclusive Growth in Africa”, 2015.
12
See footnote 3 for an explanation on the positioning of savings and investment products
13 Finmark Trust, “Financial Inclusion in the SADC Region”, 2015.
14 Ibid.
15SADC Financial Inclusion Strategy
difficult for countries to perform within the auspices of an economic community.15 Lower performing
countries thus need to “catch up” to higher performing countries, while countries with more
developed financial service sectors need to formalise, expand and deepen access to underserved
groups.
Figure 2: Financial Access by country (in percent with upper middle income countries highlighted)16
SADC 36% 18% 12% 34%
Mauritius 85% 3% 2% 10%
South Africa 75% 5% 6% 14%
Namibia 62% 8% 3% 27%
Swaziland 54% 10% 9% 27%
Botswana 50% 18% 8% 24%
Lesotho 38% 20% 23% 19%
Zimbabwe 30% 39% 8% 23%
Malawi 27% 7% 15% 51%
Zambia 25% 13% 21% 41%
Mozambique 20% 4% 16% 60%
Tanzania 14% 43% 16% 27%
DRC 12% 24% 12% 52%
Banked Other formal (non-banked) Informal only Excluded
SOURCE: FinMark Trust. “Financial Inclusion in the SADC Region”, 2015; World Bank country classification17
As illustrated in Figure 2, it appears that upper-middle-income countries tend to have higher levels of
financial inclusion, driven particularly by the formal banking sector, while low and lower-middle-
income countries with relatively high rates of financial inclusion – Lesotho and Zimbabwe in particular
– have done so through other formal and informal financial mechanisms. In Lesotho, financial inclusion
among the non-banked is predominantly driven by funeral cover, while in Zimbabwe it is driven by
mobile money and remittance services.18 Rural areas tend to face lower levels of inclusion with 45%
of rural populations facing exclusion compared to only 23% in urban areas. In terms of education,
individuals with a primary education are more likely to have access to financial products compared to
those without a primary level of schooling.19
Furthermore, as shown in Figure 3, substantial variation exists between countries in terms of quality
of financial inclusion. A larger percentage of the included population in upper-middle-income
countries, like Mauritius, South Africa and Namibia, have/use up to three to four financial products
compared to the DRC, Zambia, Mozambique and Malawi where the majority of those included only
have/use one financial product.
15 African Development Bank, “Southern Africa Regional Integration Strategy Paper 2011-2015”, 2011.
16 FinScope surveys have not been undertaken for Angola and Seychelles. The FinScope survey for Madagascar was
underway at the time that this strategy was being drafted. World Bank Global Findex data for Madagascar and Angola are
not included as they operate under different definitions of financial inclusion
17 World Bank classifies “upper-middle-income” countries as those with GNI per capita of USD 4,126 to USD 12,735. Note:
Research conducted by Finmark Trust attributes strong performance in financial access by Swaziland predominantly to an
increase in ownership of basic banking cards over the last three years.
18 African Development Bank, “Southern Africa Regional Integration Strategy Paper 2011-2015”, 2011.
19 Finmark Trust, “Financial Inclusion in the SADC Region”, 2015.
16SADC Financial Inclusion Strategy
Figure 3: Quality of financial inclusion in SADC (in percent)20
Mauritius 2014 46 30 14 10
South Africa 2015 37 26 24 13
Namibia 2011 33 33 7 27
Swaziland 2014 30 23 20 27
Botswana 2014 30 19 26 25
Lesotho 2011 37 22 22 19
Zimbabwe 2014 21 22 34 23
Malawi 2014 4 8 36 52
Zambia 2015 7 17 36 40
Mozambique 2014 6 10 24 60
Tanzania 2013 24 25 24 27
DRC 2014 2 12 34 52
Excluded Have / Use two financial products
Have / Use one financial product Have / Use three or four financial products
SOURCE: FinScope Data
Interestingly the gender gap is relatively small in SADC. At the household level women are the primary
financial managers in most families, ensuring household resource allocation to meet ongoing basic
needs and additionally saving to invest in and protect their families’ future.21 In SADC 36% women are
financial excluded compared to 33% of men. While this is 15% higher than the continent-wide average,
there are significant variances across countries. For example, in Swaziland, while there is only a one
percentage point difference between men and women in terms of exclusion, 62% of the male
population is banked compared to 48% of female counterparts with women largely accessing products
through the informal market.22 The financing gap, for women, is also more acute in rural areas, with
women only benefiting from one tenth of the credit to small formers and less than 1% of total credit
to agriculture.23
Levels of uptake across each product category are also low with large variances across countries. As
shown in Figure 4, a large percentage of adults in SADC are not accessing products and services be it
in the formal or informal arena. Those that are participating are typically accessing non-bank and
informal products and services across all four product categories. For example, approximately 32% of
adults in the SADC – below the continent-wide average of 44% - borrow, mainly through friends and
family. Furthermore, of the 51% of adults that are saving, 34% do so through informal channels or at
home. The uptake and usage of products and services varies between countries in the region. For
example, the proportion of adults who save ranges from 88% in Tanzania to 32% in South Africa.
Similarly, the proportion of adults who borrow ranges from 64% in Lesotho to only 9% in DRC.24
20
Financial products are either Transactional (incl. Remittances), Savings, Credit or Insurance. An individual can access
these products from formal institutions such as banks or non-bank formal institutions such as insurance companies and/or
from informal service provides such as moneylenders or burial societies. For the calculation of the figures below we did not
distinguish between formal and informal financial products
21 GIZ et al. “Making finance work for Africa”, n.d.; Dalberg analysis.
22
Finmark Trust. “FinScope Consumer Survey Swaziland 2014”, 2015.
23 AFDB. Ibid; FinMark Trust. “Financial Inclusion in the SADC Region”, 2015; Dalberg analysis.
24 Finmark Trust. “Financial Inclusion in the SADC Region”, 2015.
17SADC Financial Inclusion Strategy
Figure 4: Uptake of financial products and services in SADC
SOURCE: Finmark Trust. “Financial Inclusion in the SADC Region”, 2015
The use of insurance products remains low across the continent and the region, with only 27% of
adults in SADC using insurance products. Looking at the continent, statistics show that only 3% of
adults on the continent have personally paid for health insurance and only 6% of those working in
farming, forestry or fishing industries have purchased crop, rainfall or livestock insurance.25
1.3. Why is Financial Inclusion important?
As outlined in the introduction, the SADC Council of Ministers anchored the development of this
financial inclusion strategy, in the crucial importance of financial inclusion and SME access to finance
for the RISDP and the SADC Industrialisation strategy and roadmap. Given this context, this section
draws an explicit link to demonstrate the contribution of financial inclusion to industrialisation. This
emphasis does not mean that industrialisation is the sole contribution financial inclusion can make.
In fact, if designed and implemented appropriately, financial inclusion will contribute to sustainable
economic growth and stability and improve livelihoods.
SADC has identified five pathways to drive industrialisation –greater access to finance can
contribute to each of these pathways. The SADC Industrialisation Strategy and Roadmap highlights
numerous barriers to industrialisation, many of which can be catalysed through greater financial
inclusion.26 The pathways of financial inclusion most relevant to industrialisation are described below:
I. Domestic resource mobilisation: maximising revenue streams through the improvement of
tax collection, broadening the deposit base and improving the effectiveness of cross-border
payments;
II. Agro-processing: improving overall agricultural production and value-addition;
III. Strengthening small and medium enterprises (SMEs): focus on enabling small business
growth and sustainability;
IV. Information and communication technology (ICT): broadening the demand and increasing
the sophistication of ICT-based [financial] services; and
V. Skill development: improving educational access and financing the provision of educational
services.
25 Ibid. Based on 2012 data.
26 SADC. “SADC Industrialisation Strategy and Roadmap 2015-2063”, 2015.
18SADC Financial Inclusion Strategy
The following sub-sections outline how financial inclusion can maximise the potential of these
pathways to drive industrialisation and subsequent economic growth.
1.3.1. Pathway I: Domestic resource mobilisation
Enabling the cross-border transfer of funds, increasing the tax base, and augmenting the deposit
base for the financing of low income groups and enterprises are three tangible and impactful
regional actions SADC can undertake to mobilise domestic resources for industrialisation. Through
these measures, financial inclusion empowers consumers with tools to live more prosperous lives
while supporting SMEs and governments with the capital and revenue needed to expand and
industrialise the economy.
Domestic resources are less likely to fluctuate than external resources, making the use of domestic
financing mechanisms to drive industrialisation more reliable. The volatility of international capital
flows, coupled with inadequate macroeconomic policies and domestic governance often result in
significant vulnerability of developing countries to banking crises and financial contagion.27 For
example, total FDI in SADC fell by almost 50% as a result of the financial crisis, dropping from around
20 bn USD to 11 bn USD between 2008 and 2010.28 FDI across the region has since increased, but as
of 2013 still remains around 6 bn USD short of what it was in 2008. Primary commodity exporting
countries are especially susceptible to volatility. Net FDI in Zambia, for example, is largely dependent
on copper exports, dropped from 13 bn USD in 2007 to less than 7 bn USD in 2009. The country is still
struggling to diversify the economy and regain macroeconomic stability.29
These net fluctuations in FDI are also compounded by variations within the region.30 South Africa, for
example, has had historically higher levels of FDI, with average yearly FDI of around 5.2 bn USD
between 2004 and 2013. In Angola, however, a substantial reduction in FDI since 2010 has caused the
net flow of FDI to swing into negative territory; despite inflows of over 2 bn USD in 2009, Angola
experienced an average outflow of FDI of 1.7 bn USD between 2004 and 2013.31
Moreover, aid to the SADC region has continued to fall. Since reaching a high of 11% in 2003, net ODA
received as a percent of GDP in SADC fell to a low of 7% in 2013. Despite this figure being four
percentage points higher than that of the average for the sub-Saharan Africa region as a whole, ODA
to Africa continues to fall.32 This drop over time makes aid an increasingly less viable option for
financing of industrialisation, especially as countries develop and raise their income levels.
Steps to increase tax revenues, expand the deposit base, and facilitate cross-border transfers can
effectively leverage domestic capital to finance industrialisation. The SADC Industrialisation Strategy
recognises the potential of both domestic and international sources of financing for industrialisation
yet explicitly underscores the capriciousness of foreign financing in the context of the current global
economy. With that said, the strategy highlights the benefits of domestic financing over FDI and aid
for the implementation of the industrialisation strategy.33 The sub-sections below outlines how
27 Overseas Development Institute. “Financial globalisation can have several potential positive impacts on developing
countries”, 2015.
28 World Bank data on foreign direct investment, net inflows (BoP, current US$) from 2004 to 2013, most currently
available data.
29 African Economic Outlook. “Zambia”, 2015.
30 SADC website. “Foreign direct investment”, n.d.
31 World Bank data on Foreign direct investment, net inflows (BoP, current US$) from 2004 to 2013, most currently
available data.
32 World Bank data; Dalberg analysis.
33 SADC. “SADC Industrialisation Strategy and Roadmap 2015-2063”, 2015.
19You can also read