ACHIEVING 100% RENEWABLE ELECTRICITY IN NOOSA - For Zero Emissions Noosa - ITP Renewables Australia
←
→
Page content transcription
If your browser does not render page correctly, please read the page content below
ACHIEVING 100% RENEWABLE ELECTRICITY
IN NOOSA

For Zero Emissions Noosa

October 2018

                           ITP Renewables
                                  Australia
Achieving 100% Renewable Electricity in Noosa

     About ITP Renewables
     Global leader, local expertise

    ITP Renewables is a global leader in renewable energy consulting and project management,
and has undertaken a wide range of projects, including grid-connected renewable power systems,
providing advice for Australian and international government policy, feasibility studies for large
grid and off-grid power systems, developing micro-finance models for community-owned power
systems in developing countries and modelling large-scale power systems.

    We are proud to be part of the international IT Power Group, one of the world’s largest, most
respected and long-standing specialist renewable energy engineering consultancies. We work
with our clients at the local level to provide a unique combination of experienced renewable
energy consulting, engineering and implementation.

    The staff at ITP have backgrounds in renewable energy and energy efficiency, research,
development and implementation, managing and reviewing government incentive programs,
policy analysis and research, carbon markets, engineering design and project management. We
work with our clients at the local level to provide a unique combination of experienced renewable
energy consulting, engineering and implementation.

     Specialised solar capability and services

    We specialise in analysing, designing and implementing solar photovoltaics (PV) projects and
programmes. For medium-scale to MW-scale ground mount systems, we provide design, owner’s
engineer and independent engineer services, project and construction management, engineering,
procurement and construction (EPC) management, and due diligence assessment.

     Energy storage services

    We specialise in battery performance testing and analysing and implementing PV/battery
projects and programmes. For 35 years we have been specifying battery energy storage to
optimise the design of remote PV diesel hybrid mini-grids and PV/battery systems all around the
world. Recently, with rapidly falling battery prices, we have extended this expertise to on-grid
applications, now typically using lithium-ion battery technologies.

     Mini and microgrid services

    ITP has designed, managed, installed or commissioned microgrids (and minigrids) across the
Pacific and in Australia over the past 13 years. We are industry-leading experts in the microgrid
market, having been at the forefront of its development internationally and in Australia. Our end-
to-end services encompass the full spectrum of a microgrid project, from feasibility studies
through to construction and operation.

                                      http://www.itpau.com.au

ii                                                                                             Oct 2018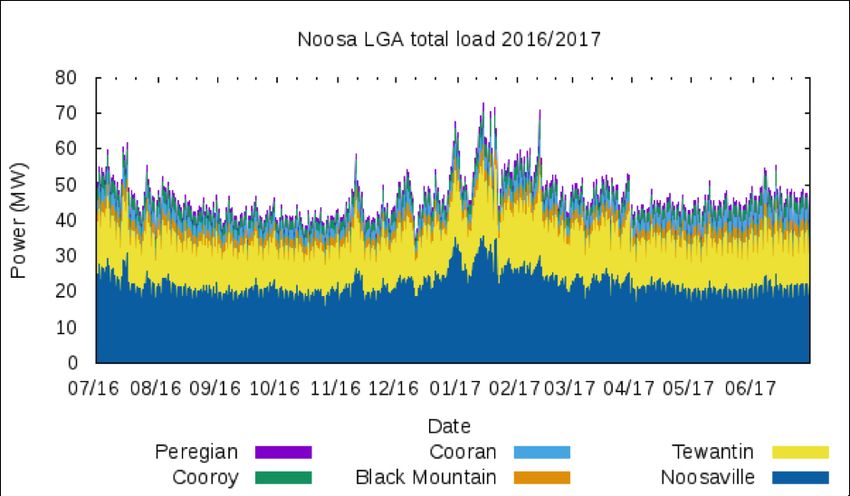
Achieving 100% Renewable Electricity in Noosa

     Acknowledgements

   Special thanks go to Navid Haghdadi at the University of New
South Wales (UNSW) Centre for Energy and Environmental
Markets for his assistance with data for the PV modelling.

    Thanks also go to the team at Zero Emissions Noosa, and especially to Geoff Acton, who not
only drove the project, but actually did a lot of the background research for this report!

    Oct 2018                                                                                iii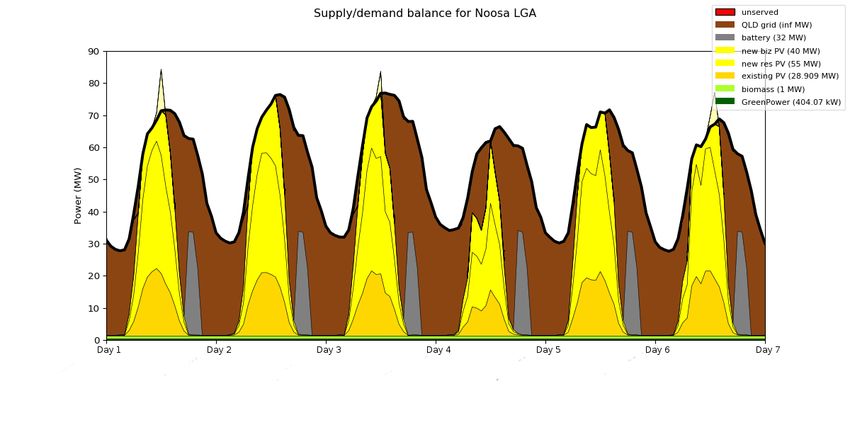
Achieving 100% Renewable Electricity in Noosa

Document Control Record
Document prepared by:
ITP Renewables
Level 1, 19-23 Moore St, Turner, ACT, 2612, Australia

PO Box 6127, O’Connor, ACT, 2602, Australia
Tel.    +61 2 6257 3511
Fax. +61 2 6257 3611
E-mail: info@itpau.com.au
http://www.itpau.com.au

Document Control
Title                      Achieving 100% Renewable Electricity in Noosa

Client RFP No.             NA                                         ITP Project Number               A02347

Client                     Zero Emissions Noosa                       Client Contact           Geoff Acton

Rev      Date              Status           Author/s                                           Project Manager           Approved
1        2805218           Draft            Rob Passey, José Zapata, Muriel Watt               Rob Passey                Oliver Woldring

2        270718            Final Draft      Rob Passey, José Zapata, Muriel Watt               Rob Passey                Oliver Woldring

3        051018            Final Report     Rob Passey, José Zapata, Muriel Watt               Rob Passey                Oliver Woldring

A person or organisation choosing to use documents prepared by IT Power (Australia) Pty Ltd, trading as ITP Renewables, accepts
the following:
      a) Conclusions and figures presented in draft documents are subject to change. ITP Renewables accepts no responsibility for
           their use outside of the original report.
      b) The document is only to be used for purposes explicitly agreed to by ITP Renewables.
      c) All responsibility and risks associated with the use of this report lie with the person or organisation who chooses to use it.

iv                                                                                                                           Oct 2018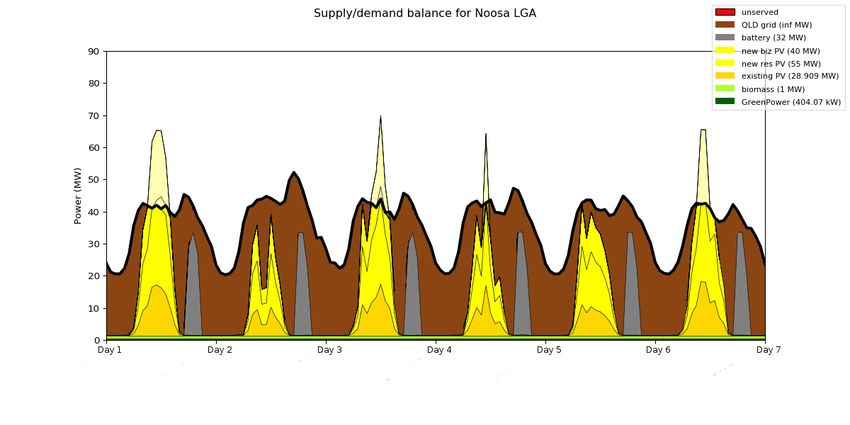
Achieving 100% Renewable Electricity in Noosa

     LIST OF ABBREVIATIONS

        AEMO              Australian Energy Market Operator
        APVI              Australian PV Institute
        ATA               Alternative Technology Association
        COREM             Community-Owned Renewable Energy Mullumbimby
        CORENA            Citizens-Own Renewable Energy Network Australia
        GW, GWh           gigawatt, gigawatt hour
        ITP               ITP Renewables
        kV                kilo volt
        kW, kWh           kilowatt, kilowatt hour
        LET               Local Energy Trading
        LGA               Local Government Area
        LGC               Large Generation Certificate
        LRET              Large-scale Renewable Energy Target
        MW, MWh           megawatt, megawatt hour
        NEM               National Electricity Market
        NEMO              National Electricity Market Optimiser
        NSW               New South Wales
        PPA               Power Purchase Agreement
        PV                photovoltaics
        Qld               Queensland
        RE                renewable energy
        RET               Renewable Energy Target
        SRES              Small-scale Renewable Energy Scheme
        STC               Small-scale Technology Certificate
        SWH               solar water heater
        UNSW              University of New South Wales
        ZEN               Zero Emissions Noosa
        ZS                zone substation

    Oct 2018                                                                v
Achieving 100% Renewable Electricity in Noosa

     What’s a Watt?

    Throughout this report we talk about kW and kWh, MW and MWh and even GW and GWh –
so what does it all mean?

     A watt-hour is the amount of electricity used by an appliance that uses 1 watt for 1 hour. So
for example, a compact fluorescent light might have a power rating of 10 watts, so using it for 1
hour would use 10 watt-hours of electricity.

    On your electricity bill, your electricity use will be measured in kWh (or kilowatt hours). A kWh
is one thousand watt-hours. This would be the same as using the 10W light for 100 hours, or
using an electric kettle (generally around 2kW) for only half an hour.

  A MW (megawatt ) is one thousand kWs, and a GW (gigawatt) is one million kWs. Similarly, a
MWh is one thousand kWhs and a GWh is one million kWhs.

vi                                                                                               Oct 2018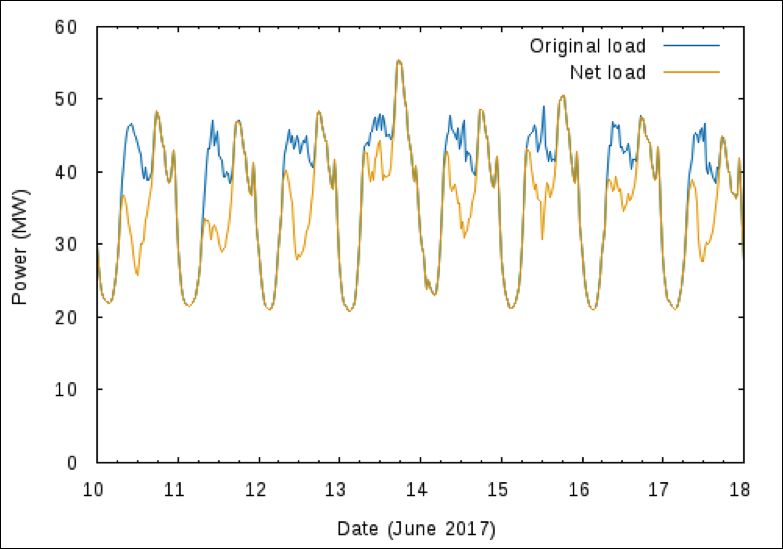
Achieving 100% Renewable Electricity in Noosa

EXECUTIVE SUMMARY
     This report was commissioned by the not-for-profit group Zero Emissions Noosa Inc. (ZEN), with
funding from the Noosa Biosphere Reserve Foundation. ZEN will draw upon the findings and
recommendations of this report to develop strategies and programs for implementation. This report firstly
reviews the electricity use and existing renewable energy generation in Noosa. It then models some
possible mixes of electricity generation and energy efficiency required to achieve ZEN’s 100% renewable
energy target by 2026. It describes a range of available options that may be suitable for driving increased
uptake of renewable energy, then recommends specific actions that can be taken in Noosa, with a special
focus on those driven by the community. It concludes with a discussion and a list of recommended actions.

Electricity use
    In Noosa Shire approximately 312,500 MWh of electricity was drawn from the Queensland grid in
2016/17, with about another 41,300 MWh from distributed PV. The highest demand peaks occur in
summer. About 56% of the electricity is used by households, with the remainder used by business and
industry.

Existing renewable energy
     As at May 2018 there was about 29 MW
PV installed in Noosa Shire, of which about
8,050 systems were most likely residential,
and about 145 were most likely commercial.
Thus, about 35% of suitable dwellings have
PV (with an average residential system size
of about 3.25kW), and about 4.7% of
businesses have PV (average ~20 kW). This
figure shows the total Noosa load profile in a
typical summer week, where the orange line
shows the electricity drawn from the
Queensland grid, and the blue lines show
what the load would have been if it hadn’t
been for the existing PV systems.

Modelling Renewable Energy Scenarios
    Two scenarios were developed for 2026.

     Scenario 1 Base Case: represents a fairly modest uptake of additional ‘behind the meter’ renewable
energy and energy efficiency options based on the continuation of BAU levels of uptake. EV use increases
to 10%. The net result is that a greater amount of large-scale PV (119 MW), or large-scale wind (85 MW), is
needed to reach 100% renewable electricity.

    Scenario 2 Stretch: represents a realistic but ambitious level of uptake of renewable energy and
energy efficiency, and 20% uptake of EVs. In this case only 67 MW of large-scale PV, or 48 MW large-
scale wind, is required to reach the 100% target.

    Oct 2018                                                                                             vii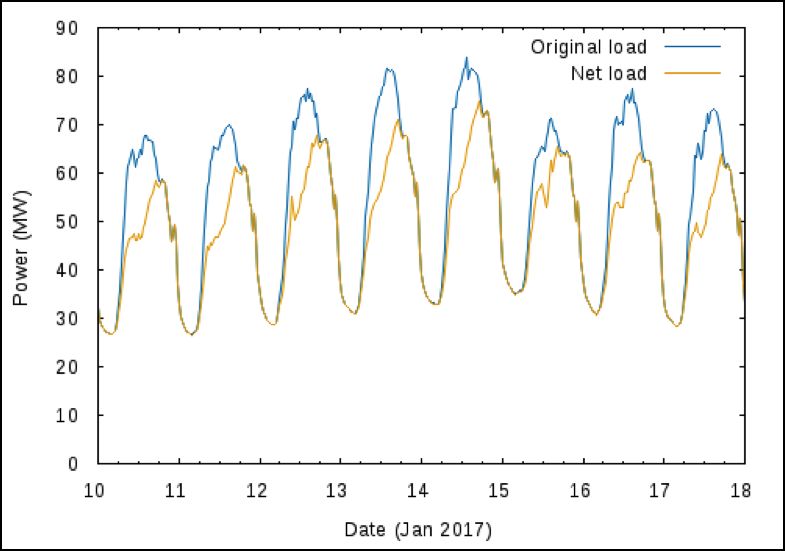
Achieving 100% Renewable Electricity in Noosa

       The table below shows the final capacity of each type of generator in 2026.

                                   Capacity of each type of generator in 2026

                                                              Base case          Stretch
                                                                (MW)              (MW)

                       Existing PV                               28.9              28.9

                       New residential PV                         22                55

                       New commercial PV                          28                40

                       New ground-mount PV/wind                 119/85            67/48

                       Bioenergy                                  0                  1

     The following charts show the electricity generation from the mix of renewable energy technologies for
the Stretch Scenario. The week of the summer demand peak and the week of the winter demand peak are
shown. Each of the colours represents a different technology (or category of technology such as residential
or commercial PV). The slightly thicker black line shows the level of demand, and where generated
electricity is exported, a paler version of the technology’s colour is used. In the charts below, 40% of
households installed 5kW, 8kWh useable capacity batteries, which discharge in the evening, shown in grey.
The brown areas represent electricity imported from the Queensland grid each night. The large-scale
ground mount PV and wind farms have not been included in the charts because there is not enough space
to build them in Noosa, they may also face public opposition because of visual impacts, and there are much
better wind resources elsewhere.

    Although the load is higher in summer, this is matched by higher PV generation. However because
almost all the renewable electricity comes from solar PV, a significant amount of electricity is still drawn
from the Queensland grid over night. At this level of PV uptake, even without large-scale PV, there is
reverse power flow back up through the zone substations into the Queensland grid. The use of batteries
reduces this effect, as would shifting night time loads such as water heating to the middle of the day to be
used as a solar sponge.

            Mix of RE Technologies, Noosa LGA, 2026 – Stretch Scenario, Indicative Summer Peak

viii                                                                                                  Oct 2018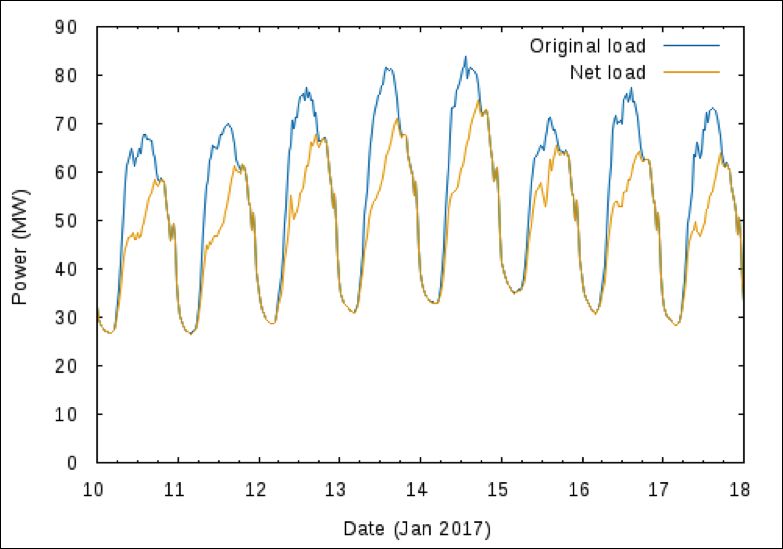
Achieving 100% Renewable Electricity in Noosa

           Mix of RE Technologies, Noosa LGA, 2026 – Stretch Scenario, Indicative Winter Peak

Available Options
     There are many different options to enable uptake of renewable energy. The emphasis of this report is
on identifying new business opportunities that the community can develop. This means they should be both
commercially available and readily deployable. As a result, solar PV and solar water heaters were assumed
to be the predominant technologies (as they are now), although there may of course be some uptake of
small-scale wind and small-scale hydro. Solar PV also has very short payback times (around 4 years for
residential, and 3 to 5 years for commercial-scale, see Tables A and B), and has no moving parts and so is
very reliable and requires very little maintenance. Large-scale PV and wind projects are currently being built
in Australia and are reporting generation costs at less than $80/MWh, making them viable in their own right.

               Table A Likely Financial Outcomes for a 5 kW Household Solar PV System

                                                                 Value

                             Installed cost                      $5,500
                             Annual generation                 6,850 kWh
                             Retail tariff                      27c/kWh
                             Export tariff                      9.5c/kWh
                             Amount of export                     40%

                             Annual income                       $1,370
                             Simple Payback Time                 4 years
                             Simple Rate of Return               25% pa

    Oct 2018                                                                                                ix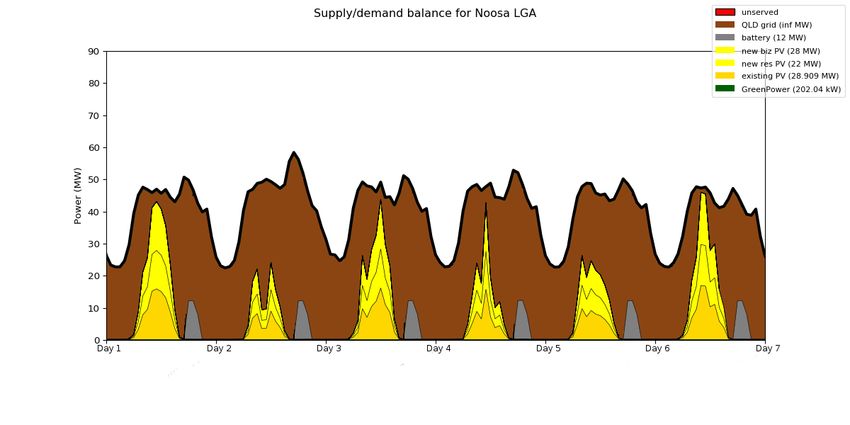
Achieving 100% Renewable Electricity in Noosa

           Table B Likely Financial Outcomes for a 30 kW Commercial Solar PV System

                                                                  Value
                  Installed cost                                 $30,000
                  Annual generation                             41,000 kWh
                  Retail tariff           17.5c/kWh (with demand      17.5c/kWh (with demand
                                                 charges)                    charges)
                  Export tariff                                  8c/kWh

                  Amount of export                                 20%
                  Annual income                      $6,400                  $10,500
                  Simple Payback Time               4.7 years                2.9 years
                  Simple Rate of Return             21% pa                   35% pa

    This report includes a brief description of the following options, and a more detailed description of
specific programs recommended for Noosa is then provided below.

    -   Bulk buys
    -   Solar $aver programs
    -   Social Housing programs
    -   Solar Power Purchase Agreements and Solar Leasing arrangements
    -   Ways to overcome the split incentive barrier for landlords & tenants
    -   Community-owned Renewable Energy Projects – both donation based and investment based
    -   Local Energy Trading

Information & Education
    Noosa Shire Council is well placed to be a reliable source of information to the community for both
energy efficiency and renewable energy, and Zero Emissions Noosa can do this via its
www.repowernoosa.com website. As well as reducing energy use, energy efficiency can help integrate
renewables into household and business load profiles, and demand side management can be used to shift
and reduce evening loads – thereby increasing the level of local energy self-sufficiency.

     There are a number of reasons that energy efficiency is not taken up as much as it could be: lack of
interest; lack of time to investigate the options; lack of good information; although the payback is high, the
total amount of money saved can be quite low, and so not worth the effort; the split incentive problem
(where a landlord would have to pay for the energy efficiency but the tenants get the benefit); for larger
items such as SWHs the upfront cost may be too high; etc. Thus, the provision of information is necessary
but not sufficient to maximise uptake.

Energy efficiency options for the future include:
    Information
    -      Full-page newspaper spreads that provide simple tips for ways to reduce energy use, along with
           links to useful sources of information
    -      Online Energy Info Hub: A Noosa-specific website of the most relevant information

x                                                                                                   Oct 2018
Achieving 100% Renewable Electricity in Noosa
- A Community Energy Information Hub, where people can get authoritative impartial advice
Community Engagement
- ATA’s Sustainable House Day: where people can open up their sustainably designed homes to
the general public.
- Energy Assessors that can carry out home energy audits, and give talks at events and to local
community organisations.
- A pledge, competition or community workshop for ideas to drive energy efficiency
- Noosa Energy Saving Challenge: a competition run by ZEN or Noosa Council to see who can
reduce their energy use the most
- Repower Programs: where an entire street undertakes energy education, energy efficiency and
renewable energy actions in order to maximise cooperative benefits.
Solar water heaters and heat pumps
- Bulk buys
- Pamphlet at point of sale on how to operate a SWH
- Information on how to choose a SWH of the correct size, type
- Training of SWH installers on what customers really want
Renewable energy options for the future, in addition to the above, include:
- Financial assessment tools such as the APVI’s SunSPot and the ATA’s Sunulator: which are
free online tools for estimating the potential for electricity generation from PV on building roofs.
- Information booklets such as the ‘Guide for Installing Solar PV for Households’ and the ‘Guide
for Installing Solar PV for Business’, both produced by the Clean Energy Council, and the ‘Home
Solar Battery Guide’.
Projects Proposed for Noosa
Following consultation with Zero Emissions Noosa, the broader community, Noosa Council and
Tourism Noosa, the following proposals are made for Noosa. It is unlikely that ZEN currently has sufficient
resources to implement these proposals, and so their success is dependent on ZEN obtaining dedicated
funding.
1. Residential: Solar Bulk Buy, Solar $avers and Landlord/tenant agreements
2. Commercial-scale: Multi-site Feasibility Studies, and Solar Lease Arrangements,
Environmental Upgrade Agreements, embedded networks.
3. Government buildings: Solar for Schools
4. Large-scale PV: Different legal structures for community ownership
5. Community Ownership: RePower Shoalhaven’s CORE model
Residential
Household PV systems should be available for around $1,000/kW in Noosa. They should pay
themselves off in about 4 years.
Solar Bulk Buy
This is a tried and tested approach used to ‘bulk supply’ solar systems, and more recently batteries
and solar water heaters, at a reduced price. Although the margins for installers are lower, this is
compensated by there being more installations. Their other advantages include the provision of reliable
information from a trusted source such as a council or local community group, the use of quality local
installers, and the inclusion of public benefits such as direct financial contributions or a solar system to
Oct 2018 xiAchieving 100% Renewable Electricity in Noosa
particular community groups. Both a higher end PV system and a cheaper option should be made
available, and there may be a need for optional microinverters or power optimisers, which are more
expensive but help a PV system to maintain it’s output despite shading. Batteries and solar water heaters
could also be considered. All options should have good warranties. The community should be consulted on
what sort of community benefit they would like, and local community organisations’ networks should be
used to spread the word.
Solar $avers
With the Queensland government conducting its Sunny Savers trials, there is no reason that Noosa
Council couldn’t initiate their own Solar $avers program. Any of the three purchase options currently being
trialled under Sunny Savers could be used, or possibly one of the local installers’ current finance offerings.
Landlord/tenant agreements
A significant problem for the uptake of solar PV on tenanted premises (both residential and
commercial) is the split incentive barrier. This is where the building owner has little incentive to install solar
because the tenant will receive the benefits (assuming they pay their own electricity bills). Information on
the various ways to overcome this problem are expected to be included in the ‘Landlord Toolkit’ that ZEN is
having developed as part of the Repower Noosa project funded from Council’s Economic Development
Fund. We have also provided a simple Memorandum of Understanding that can be used to establish an
agreement between the tenant and the landlord.
Commercial-scale
Commercial PV systems should be able to be installed at the same cost, or less, than residential
systems. Because the commercial load profile is well matched to solar output, more of the electricity is used
on-site and so avoids the purchase of electricity from the grid at the full retail rate. One complication for this
is that larger customers may be on demand charges, which PV may not reduce, however even in this case
the returns are still favourable. Another complication is that some community organisations may use little
electricity during the day, in which case a much smaller system would be advisable.
Multi-Site Feasibility Studies
All commercial/industrial sites have significant daytime loads and large amounts of roof space.
However, they may have limited time and lack the expertise to explore the possibility of solar and to assess
proposals. A two-stage approach could be used to assist these businesses. The aim is to help the
businesses to decide whether to install, and to ensure that they end up with a high quality system at a good
price. The costs of each of these stages could be paid through a grant or by participating businesses.
The first stage would involve a ‘Multi-Site Feasibility Study’ that would assess the viability of solar for
these businesses en masse. This would result in a separate assessment for each business that would
detail: the recommended system size, the installed cost, the estimated annual generation and simple
payback time, and a brief description of any relevant issues such as shading or roofing restrictions. Sites
could also be given the option of a more detailed assessment including load monitoring, and/or an energy
audit, which could be provided at an additional cost or incorporated into the Ecobiz program. The second
stage would be to help interested businesses to install an appropriate solar PV system, which involves
using a third party to call for tenders for installers and an assessment of those tenders, and then quality
assurance on the completed installations.
xii Oct 2018Achieving 100% Renewable Electricity in Noosa
Solar PPAs and Lease Arrangements
Solar PPAs and Solar Leases may be suitable for businesses in Noosa, and could even be offered by
Noosa Council to its commercial and community tenants. However, before putting too much effort into
these options it would be wise to survey business interest.
Environmental Upgrade Agreements
EUAs can be used to overcome the split incentive problem for commercial premises, but legislative
changes will be required for them to be implemented in Queensland.
Embedded networks
Embedded electricity networks may be suitable for industrial estates, apartment blocks, retirement
villages or caravan parks in Noosa, and can be used to reduce electricity costs and improve the financial
returns from solar. However, developing an embedded network is not a trivial task, and so would need to be
assessed on a case-by-case basis. Initially, we recommend that some sort of survey/audit is used to
identify areas that do have an embedded network, as well as others that may be interested in having one.
Solar for Schools
Schools and the wider education sector represent a good opportunity to install solar systems. They can
be installed with an online descriptive live data interface, and be combined with relevant curricula material
that allows school children to understand how and when electricity is being produced and used. Most of the
Noosa government schools should be included in the Queensland government’s Advancing Clean Energy
Schools program which is expected to commence in the latter half of 2018. Of course, It may be possible
for the government schools who are not included in the ACES program to acquire solar systems
themselves. Brisbane Catholic Education Queensland is undertaking two pilot programs with schools within
the diocese, with the intent being to roll the program out to all schools in the diocese once the pilots have
been evaluated, refined and the benefits proven. Zero Emissions Noosa is also developing a brief for a
campaign to focus on the wider educational sector.
Large-scale
There are very few opportunities for large-scale renewable energy generation within Noosa Shire, and
so any significant large-scale development will need to be outside Noosa. There are a number of solar and
wind farms currently being built in Queensland, including the SolarQ proposal, which is relatively nearby.
We have described three different approaches to community ownership of large-scale renewable energy
projects, and the most promising approach for Noosa appears to be the approach taken at Sapphire Wind
Farm, where shares will be made available for community ownership of a portion of the wind farm.
Community ownership
Community-Owned Renewable Energy (CORE) projects can be either donation-based or investment-
based. With donation-based projects, the community provides funds as loans that are then repaid from
savings in electricity bills. The repayments go into a revolving fund that can then be used to finance more
projects, and so on. Investment-based projects can have a number of different legal structures (as
discussed in the main report), and here ITP recommends that RePower Shoalhaven’s CORE model be
used (or the Farming the Sun approach). Each involves a proprietary company limited by shares being
established for each solar system (or group of solar systems). Once a specific project has been identified,
businesses, community organisations and public schools can use their own networks to make the project
known to the public.
Oct 2018 xiiiAchieving 100% Renewable Electricity in Noosa
Discussion and Recommendations
To increase the uptake of renewable energy in Noosa it is important to create an environment where
local people and businesses wish to invest. Although the vast majority of renewable generation will be from
solar PV, energy efficiency and demand side management are very important.
The installation of 1 MW of solar PV (for example through two hundred 5kW systems through a solar
bulk buy, or ten 100 kW systems through the Multi-site Feasibility Study approach) would create about 20
jobyears of direct employment in Noosa. A single large-scale ground-mounted PV system would create
slightly less employment. 1 MW of solar PV would also generate about 1.37 GWh of renewable electricity
each year, which would avoid about $85,000 leaving Noosa each year (as the generation component of
peoples’ electricity bills.
The following lists the major recommendations from this project. They are not listed in order of
importance, but in the order in which they appear in this report.
Recommendations
1. Energy Info Hubs
The Repower Noosa website will host information using a ‘funnel’ approach to direct enquirers to
information most relevant to their circumstances, and video testimonials relevant to installing solar PV. This
could also link to online tools such as the Solar Potential Tool and the Sunulator. Noosa Council may also
wish to establish a shop front drop-in centre, from which Energy assessors could operate.
2. Solar bulk buy
A solar bulk buy could be coordinated according to the process outlined above. It should have both a
standard and higher-end option, use local installers, provide a community benefit, and could include
batteries and SWHs.
3. Solar $avers
Noosa Council could pursue its own Solar $avers program – drawing on the experience of the various
Victorian councils who have run this type of program, as well as the Sunny Savers program being run by
the Queensland government.
4. Solar for Rentals
Information regarding the various options to overcome the ‘split incentive barrier’ are expected to be
included in the ‘Landlord Toolkit’ that ZEN is having developed as part of the Repower Noosa project
funded from Council’s Economic Development Fund.
5. Solar Access Rights
Noosa Council could develop a firm policy on how to address the issue of overshadowing of what could
be a significant financial investment in solar PV or SWHs
6. Multi-Site Feasibility Study
ZEN or Council could coordinate a Multi-Site Feasibility Study to help businesses obtain solar. The first
stage would involve a high level assessment of the viability of solar at each business. The second stage
would involve a call for tenders for installers and an assessment of those tenders, then quality assurance of
the completed installations.
xiv Oct 2018Achieving 100% Renewable Electricity in Noosa
7. Solar PPAs and Leases
As a first step, businesses and Council could be surveyed to assess their interest in these options. If
there is sufficient interest, this list could simply be made available to solar installers, or a Multi-Site
Feasibility Study approach could be taken.
8. Environmental Upgrade Agreements
Noosa Council either undertake an investigation into whether EUAs may require legislative changes in
Queensland, or lobby the state government to do this themselves
9. Embedded Networks
A survey/audit could be used to identify areas that have embedded networks, as well as their potential
interest in installing solar. The outcomes of the survey/audit could be used to attract businesses who
specialise in establishing and operating solar embedded networks.
10. Solar for Schools
ZEN could assist government schools with the Queensland government’s Advancing Clean Energy
Schools program to acquire solar systems. This support should be extended to any government schools
who are not included in the ACES program, as well as any non-government schools and the wider
educational sector.
11. Community organisations
Noosa council should complete the audits to be undertaken in conjunction with the Queensland
government’s EcoBiz program, and then implement the recommendations.
12. Large-scale solar
ZEN could explore the different approaches to community ownership of large-scale renewable energy
projects, especially the approach taken at Sapphire Wind Farm.
13. Community-Owned Renewable Energy
ZEN could facilitate the development of community-owned renewable energy projects where
appropriate. For all but the large-scale solar projects, this would most likely use either the RePower
Shoalhaven model or the Farming the Sun model, and ideally be with the assistance of these organisations.
During the preparation of this report, and partly in response to it, Zero Emissions Noosa has developed
briefs for a number of campaigns that are either underway or in the planning process. These campaigns
localise the use of the tools recommended here and include Noosa Education Campaign, Solar for Low
Income and Renter Households, Cooran Earth Rights Partnership, Local Large-scale RE Generation, Major
Consumers, Tourism Noosa Campaign, Repower Noosa Business, Noosa Community Buildings, Academic
ZEN, and Repower Noosa industry cluster. More details can be found here
https://www.repowernoosa.com/programs, and in Appendix C.
Oct 2018 xvAchieving 100% Renewable Electricity in Noosa
TABLE OF CONTENTS
EXECUTIVE SUMMARY ................................................................................................. VII
1. INTRODUCTION ......................................................................................................... 1
1.1. Background............................................................................................... 1
1.2. This Report ............................................................................................... 1
2. CURRENT ELECTRICITY GRID, USE & SOLAR...................................................... 3
2.1. Electricity Use ........................................................................................... 4
2.2. Existing Distributed Generation ................................................................ 5
3. MODELLING RENEWABLE ENERGY TECHNOLOGY OPTIONS ........................... 8
3.1. Modelling 2026 Electricity Use.................................................................. 9
3.1.1. Population Growth ........................................................................... 9
3.1.2. Smaller-scale Technology Uptake ................................................. 10
3.1.3. Final Renewable Energy Mix ......................................................... 15
4. AVAILABLE OPTIONS............................................................................................. 21
4.1. Direct ownership ..................................................................................... 22
4.1.1. Bulk buys ....................................................................................... 22
4.1.2. Solar $aver Programs .................................................................... 24
4.2. Targeted Social Housing Programs ........................................................ 25
4.3. Solar Power Purchase Agreements and Solar Leasing.......................... 25
4.4. Overcoming the split incentive barrier..................................................... 26
4.5. Community-Owned Renewable Energy projects .................................... 27
4.5.1. Donation-based projects ................................................................ 27
4.5.2. Investment-based projects............................................................. 28
4.6. Local Energy Trading.............................................................................. 30
4.6.1. Embedded networks ...................................................................... 31
4.6.2. Using Energex’s network ............................................................... 32
5. WHAT CAN NOOSA DO? ........................................................................................ 33
5.1. Information & Education.......................................................................... 33
5.1.1. Energy Efficiency ........................................................................... 33
5.1.2. Renewable Energy......................................................................... 38
xvi Oct 2018Achieving 100% Renewable Electricity in Noosa
5.2. Proposed Projects for Noosa .................................................................. 39
5.2.1. Residential ..................................................................................... 41
5.2.2. Commercial-scale .......................................................................... 44
5.2.3. Large-scale .................................................................................... 49
5.2.4. Community Ownership................................................................... 50
6. DISCUSSION AND RECOMMENDATIONS............................................................. 51
6.1. Recommendations .................................................................................. 52
6.1.1. Energy Info Hubs ........................................................................... 52
6.1.2. Solar bulk buy ................................................................................ 52
6.1.3. Solar $avers................................................................................... 52
6.1.4. Solar for Rentals ............................................................................ 52
6.1.5. Solar Access Rights....................................................................... 52
6.1.6. Multi-Site Feasibility Study............................................................. 52
6.1.7. Solar PPAs & Solar Leases ........................................................... 53
6.1.8. Environmental Upgrade Agreements............................................. 53
6.1.9. Embedded Networks...................................................................... 53
6.1.10. Community organisations ............................................................ 53
6.1.11. Solar for Schools.......................................................................... 53
6.1.12. Large-scale solar ......................................................................... 53
6.1.13. Community-Owned Renewable Energy....................................... 53
7. APPENDIX A: WHAT COUNTS TOWARDS NOOSA’S RENEWABLE
ELECTRICITY.................................................................................................................. 54
8. APPENDIX B: SAMPLE MOU FOR LANDLORD/ TENANT AGREEMENTS ......... 57
9. APPENDIX C: LOCAL NOOSA CAMPAIGNS......................................................... 58
Oct 2018 xviiAchieving 100% Renewable Electricity in Noosa
1. INTRODUCTION
1.1. Background
Over the last five to ten years the cost of renewable energy (RE) technologies, in particular
solar photovoltaics (PV), has declined significantly. Solar PV is a modular technology, meaning it
can be deployed at any scale, from smaller household systems commonly up to 15 kW, through
systems suitable for a local business, to large-scale ground-mounted systems that range from
100 kW to tens or even hundreds of MWs.
The suitability of PV for smaller systems has opened up opportunities for individuals and
communities to generate their own electricity. More recently, the price of batteries has declined
significantly, and there has been progress in the development of energy management systems,
which allows PV, batteries and other technologies such as solar water heaters to be integrated
into effective distributed energy systems.
Other renewable energy technologies such as wind, hydro, bioenergy, tidal and wave power
have also seen advances, with wind and hydro available as smaller-scale options suitable for
household and community distributed energy.
These technologies have a number of benefits beyond financial savings. They create local
employment, which can occur directly when they are installed, as well as indirectly because less
money leaves the community in the form of electricity bills – meaning that more money remains to
circulate through the local economy, which creates additional employment.
They can also provide local resilience, where the integration of batteries can provide support
to the electricity network during times of peak demand, and maintain power supplies in the event
of loss of the network. This is not only more convenient but can be critical in times of emergency
response.
1.2. This Report
Zero Emissions Noosa, Inc (ZEN) is a not-for-profit group formed in 2016 with an identified
goal of net zero community carbon emissions by 2026. That goal is to be achieved by working in
collaboration with individuals, families, community groups, business and educational institutions.
Zero Emissions Noosa has received funding from the Noosa Biosphere Reserve Foundation for
the project Roadmap to Achieving 100% Renewable Electricity for Noosa Shire. The aim of this
project is to identify the most efficient and cheapest mix of renewable energy and energy
efficiency measures needed to eliminate all carbon dioxide emissions arising from electricity
consumption in the Noosa Shire by 2026. ZEN will draw upon the findings and recommendations
of this report to develop strategies and programs for implementation through such collaboration.
In the context of this report, the term Renewable Electricity refers to electricity that is generated
from renewable sources.
Oct 2018 1Achieving 100% Renewable Electricity in Noosa
This Report aims to form the foundation of ZEN’s endeavours for renewable electricity and is
divided into the following Sections:
Section 2 (Current Electricity Grid, Use & Solar) characterises the existing electricity grid and
the total amount of electricity used in Noosa Shire as well as the current renewable energy
generation in the region.
Section 3 (Modelling Renewable Energy Technology Options) describes the modelling
undertaken to characterise the possible mixes of electricity generation and energy efficiency
required to achieve ZEN’s 100% renewable energy target by 2026.
Section 4 (Available Options) then discusses the range of business models and other
approaches which may be relevant for increasing renewable energy in Noosa. These range from
ways to drive uptake at the household level through to larger-scale options.
Section 5 (What Can Noosa do?) then recommends specific actions that the local community
and Noosa Council can undertake. After discussing how the provision of information can be used
to drive uptake of both energy efficiency and renewable energy, it proposes specific options that
can be used to enable uptake of residential-scale renewable energy, then commercial-scale, then
large-scale and some opportunities for community ownership.
Section 6 (Discussion & Recommendations) then concludes the report by summarising the
main outcomes and actions suggested for Noosa.
2 Oct 2018Achieving 100% Renewable Electricity in Noosa
2. CURRENT ELECTRICITY GRID, USE & SOLAR
Electricity is provided to the Noosa Local Government Area (LGA) via transmission lines
through zone substations and then through the distribution network. It is also provided by solar
PV systems located on the distribution network. Figure 1 shows the Energex map of the Noosa
area with the Zone Substations (ZSs) and the 132kV down to 33kV lines. Figure 2 shows a
Google Maps view of the Noosa area with the locations of the lines down to 415V.
Figure 1. Energex map of the Noosa area
Oct 2018 3Achieving 100% Renewable Electricity in Noosa
Figure 2. Types of Electricity Lines in Noosa area
Red = 132kV, Yellow = 33kV, Green = 11kV, Blue = sub 11kV
2.1. Electricity Use
The current electricity use in Noosa LGA according to Energex is 312,463 MWh, consisting of
173,091 MWh from the residential sector, 136,722 MWh from business, and 2,650 from
streetlighting. The aggregated annual demand profile is shown in Figure 3. It can be seen that the
highest peaks generally occur in summer, although there is a solid level of demand in winter.
4 Oct 2018Achieving 100% Renewable Electricity in Noosa
Households make up about 56% of electricity use in Noosa, 1 with the remainder used by
business and industry. There were 26,776 households in Noosa LGA in 2016,2 and so each
house, on average used about 15.71 kWh/day), which is very slightly higher than the South-East
Queensland average of 15.37 kWh/day.
Figure 3. Noosa LGA Annual Demand Profile for 2016/2017
2.2. Existing Distributed Generation
Solar PV is by far the most prevalent form of distributed generation in Noosa LGA. According
to the Clean Energy Regulator database there are no registered small wind or microhydro
systems in Noosa. Solar PV reduces the amount of grid electricity used (by reducing the amount
of electricity that is transmitted through the ZSs above). Therefore, to obtain the actual underlying
electricity demand for the modelling, each half hourly period of electricity use was increased by
the estimated amount of PV generation.
According to the Australian PV Institute Solar Map3, as at May 2018, there was 28,909 kW
PV installed in Noosa LGA. This consisted of 8,031 systems4 (26,064 kW) that were less than 10
kW in size (generally assumed to be residential systems), and 145 (2,845 kW) in the 10 kW to
100 kW size range (generally assumed to be commercial systems). Although there are about
1
From https://www.energex.com.au/about-us/our-commitment/to-our-customers/connecting-with-you/data-to-share
2
2016 Census, ABS.
3
http://pv-map.apvi.org.au/historical#10/-26.3156/152.9681
4
To calculate the number of systems we have used the postcode to LGA conversion method discussed in Section
3.1.2.
Oct 2018 5Achieving 100% Renewable Electricity in Noosa
26,766 dwellings in Noosa LGA, only about 23,263 of these are considered to have suitable roof
space for PV and solar water heaters (SWHs).5 Thus, with 8,031 PV systems in the sub 10 kW
size range, about 35% of suitable dwellings had PV, and the average residential system size was
about 3.25 kW. With an estimated 3,057 businesses in Noosa LGA, about 4.7% of them had solar
PV, with an average size of about 20 kW. See Table I.
Table I Solar PV Systems in Noosa LGA (May 2018)
Residential Commercial Total
(up to 10kW) (10-100kW)
PV Systems 8,031 145 8,176
PV Capacity 26,064 kW 2,845 kW 28,909 kW
Percentage 35% 4.7%
with PV
Average size 3.25 kW 20 kW
Electricity generation by distributed PV was calculated by taking the average hourly
generation of typical rooftop PV systems within Noosa LGA.6 This was then scaled according to
the number and size of PV systems to produce an estimate of the hourly generation over a year.
The same approach was used for future installations of behind the meter PV (household and
businesses) for each Scenario. The generation from in front of the meter (ground-mounted large-
scale PV) was modeled using Australian Energy Market Operator (AEMO) PV traces for the area,
which generates PV output data for a modeled single axis tracking ground mount PV system.
Thus, these PV systems generated an estimated 41,300 MWh of electricity in 2016/17, and
so the real underlying electricity used in Noosa LGA was about 353,964 MWh (and so PV
generation was about 11.7% of this underlying demand). To illustrate the impact of PV on the
daily load as seen by the substations, Figure 4 and Figure 5 show an average week in summer
and winter respectively showing the load as seen by the substations (Net load, orange) and what
the load would have been if it hadn’t been for the existing PV systems (Load, blue). The highest
peaks in summer are most likely due to a combination of higher visitor numbers and air
conditioning load, and are slightly reduced by solar. The small spikes visible in the winter
evenings are when the off-peak load is activated.7 Although there is also likely to be some small-
scale wind turbines and micro-hydro, they were not included in the baseline adjustment because
they would have a negligible effect.
The current Renewable Power Percentage under the Federal Large-scale Renewable Energy
Target for Australia is 16.06%. Thus, when the electricity generated by local solar PV is included,
it can be said that Noosa LGA has a higher percentage, with just over 26% of the electricity
5
Derived from the 2011 Census, and the APVI Solar Map.
6
PV data was sourced from publicly available PV performance database, PVOutput.org.
7
Off-peak load is generally for water heating and is activated remotely.
6 Oct 2018Achieving 100% Renewable Electricity in Noosa
currently used being renewable. However, very little of that 16.06% is currently generated in
Queensland, with only 1.42% of the grid electricity used in Queensland in 2015/16 being
renewable. Thus, it can also be argued that only around 12-13% of the actual electricity used in
Noosa is currently renewable.
Figure 4. Representative Week for Noosa LGA Demand Profile, Showing Net Load
(after PV) and Original Load (before PV), Summer
Figure 5. Representative Week for Noosa LGA Demand Profile, Showing Net Load
(after PV) and Original Load (before PV), Winter
Oct 2018 7Achieving 100% Renewable Electricity in Noosa
3. MODELLING RENEWABLE ENERGY TECHNOLOGY
OPTIONS
Together with ITP Renewables, Zero Emissions Noosa has developed two scenarios for
2026.8 These scenarios are firstly summarised, then are described below in more detail. They are
also shown in Table II. Note that scenarios are not predictions: they are simply used to illustrate
the impact of different levels of electricity demand and electricity generation options.
Scenario 1 Base Case: This is intended to result in a greater amount of large-scale PV being
needed to reach 100% renewable electricity – largely because it has a relatively modest uptake of
‘behind the meter’ renewable energy and energy efficiency options, which are based on the
continuation of BAU levels of uptake. Household PV increases from 26.1MW to 48.1 MW, while
commercial PV increases from 2.7 MW to 30.7 MW. Solar water heaters/heat pumps increase
from being on 17.1% of houses to being on 26.4%. This scenario assumes no additional
bioenergy, wind or hydro. The population increases by 8.44%, 10% of vehicles are assumed to be
EVs and there is only a 5% reduction in average per capita electricity use because of energy
efficiency. As a result, 119 MW of large-scale ground-mounted PV is required to achieve the
100% renewable target. A quarter of households and businesses that install PV are assumed to
have batteries, but the main impact of this is to help smooth the load profile by reducing evening
peaks.
Scenario 2 Stretch: Is intended to result in a smaller amount of large-scale PV being
required to reach 100% renewable electricity. It represents a realistic but ambitious level of
uptake of renewable energy and energy efficiency in the general community. Total residential and
commercial PV increase to 80.5 MW and 43.1 MW respectively, and SWHs/heat pumps are on
50% of houses, however only 1 MW of bioenergy is installed. Population growth is the same
(8.44%) and energy efficiency reduces average per capita electricity use by 17%. However, in
keeping with the community’s increased interest in behind-the-meter PV and energy efficiency,
there is also increased interest in EVs (20% of vehicles), which offsets the effects of lower
population growth and increased energy efficiency. In this case, 67 MW of large-scale PV is
required. Of households and businesses that install PV, 40% take up batteries, which smoothes
the load profile more than in Scenario 1.
8
The rationale behind these scenarios can be found at https://www.repowernoosa.com/roadmap-project-
blog/2018/07/16/modelling-scenarios
8 Oct 2018Achieving 100% Renewable Electricity in Noosa
Table II Summary of Scenarios for 2026
2016 Base case Stretch
Population growth 53,638 58,164 +8.44% 58,164 +8.44%
SWHs/heat pumps 4,020 6,500 -1.3% 13,795 -5.2%
General energy efficiency -5% -17%
Electric Vehicles 0 3,630 2.5% 7,250 5.1%
Distributed PV 29 MW 79 MW -31% 116 MW -48.5%
Bioenergy 0 MW 0 MW 0% 1 MW -2.5%
GreenPower 0.35% 0.5% -0.5% 1% -1%
OVERALL TOTAL -26.9% -60.7%
a: Where units are not indicated, the values are for total numbers
b: The percentage values are changes as a percentage of Noosa LGA’s 2016/17 underlying
electricity use
3.1. Modelling 2026 Electricity Use
The modelling was performed for the year 2026 using NEMO (National Electricity Market
Optimiser), an open source electricity sector model (https://nemo.ozlabs.org). It was used to
model the hour-by-hour dispatch of a range of electricity generation technologies according to the
scenarios described below. Only technologies that are commercially available in Australia are
used.
This firstly involved projecting electricity use from 2016/17 allowing for population growth,
uptake of SWHs, and the uptake of energy efficiency options in general. Different levels of uptake
of distributed smaller-scale PV, large-scale PV, wind, bioenergy and GreenPower purchase were
then programmed into the model according to the following scenarios. It was assumed that
electricity could be drawn from the National Electricity Market (NEM) when required (most likely
overnight), then exported to the NEM when in excess (most likely during the day).
3.1.1. Population Growth
Based on information provided by Noosa Council, Zero Emissions Noosa has estimated that
the Noosa population will grow by 8.44% between 2016 and 2026. This population increase is
based on the projected increase in the permanent population,9 and for the purposes of modelling
it assumes that electricity usage by visitors and the non-residential sector grows at the same rate.
We assume that the number of dwellings suitable for PV and SWHs also increases by 8.44%,
resulting in 25,225 houses.
9
See https://www.noosa.qld.gov.au/documents/40217326/41514433/1.Noosa-LGIP-Part-15_v2_Draft-02.03.2018.pdf
Oct 2018 9Achieving 100% Renewable Electricity in Noosa
3.1.2. Smaller-scale Technology Uptake
The following discusses the various options that can affect electricity use. They can be
divided into those that (i) decrease electricity use (energy efficiency, including solar water heaters
and air-sourced heat pumps, behaviour change), (ii) increase electricity use (electric vehicles), (iii)
generate renewable electricity (PV, wind turbines, bioenergy), and (iv) GreenPower.
Decreasing Electricity Use
Decreasing electricity use through energy efficiency measures (also known as negawatts) is
generally by far the cheapest way to reduce the amount of electricity drawn from the grid, and
therefore greenhouse gas emissions. Load management is similar, but includes simply shifting
loads from one time to another, without necessarily decreasing electricity use.
They can provide value by (i) reducing the annual need for electricity, which makes meeting
renewable energy targets easier, (ii) reducing demand at peak times, which reduces the amount
of local renewable energy and network capacity needed at any one time, and (iii) reducing
demand at times of low local renewable energy generation, which would reduce the amount of
electricity that needs to be imported into Noosa LGA (for example, where large amounts of solar
PV is used to meet electricity demand, overnight loads, such as off peak water heaters, should be
moved to day time boosting).
Solar water heaters and air-sourced heat pumps
Information is available on the number of SWHs and air-sourced heat pumps by postcode
from the Clean Energy Regulator. Noosa LGA includes the postcodes 4563, 4565, 4566, 4567,
4568, 4569, 4571, and 4573. Of these, postcodes 4563 and 4573 include a proportion outside
Noosa LGA. The Australian Bureau of Statistics provides Australian Statistical Geographic
Standard Correspondences that are a mathematical method used to assign data from one
geographic region to another. 10 We have used these to assign the SWH uptake from these
postcodes to Noosa LGA. Thus, about 13% of suitable dwellings have SWHs, and about 4% of
dwellings use air-sourced heat pumps for heating water, making a total of 17%. For Scenario 1
we assume that the uptake occurs at the same rate as the last two years (4.3% per year for
SWHs and 6.8% per year for heat pumps). For Scenario 2 we assume 10% per year for SWHs
and 20% per year for heat pumps.
The amount by which SWHs reduce electricity use can vary greatly (eg. from 20% to 90%)11
depending on the orientation of the system, the amount of shading, the efficiency of the system,
the design of the system (eg. flat plate or evacuated tube), the climate, the hot water demand, the
boosting type and the time of day that hot water is used. Some of these issues do not affect heat
pumps, for example, they are unaffected by orientation or shading and their efficiency is generally
unaffected by hot water demand. SWHs and air-sourced heat pumps are often assumed to, on
10
These can be obtained from
http://www.abs.gov.au/AUSSTATS/abs@.nsf/DetailsPage/1270.0.55.006July%202011?OpenDocument
11
Gill, N., Osman, P., Head, L., Voyer, M., Harada, T., Waitt, G. and Gibson, C., 2015, ‘Looking beyond installation:
Why households struggle to make the most of solar hot water systems’, Energy Policy, 87, p83-94.
10 Oct 2018Achieving 100% Renewable Electricity in Noosa
average, reduce the electricity used for the average hot water system by 70%12 and a study of
residential water heaters in Brisbane reported an average reduction from 7.95kWh/day to
2.74kWh/day (66%). 13 Thus, for the modelling conducted here, we have assumed that the
average SWH or heat pump reduces electricity use by 5.2 kWh/day on average through the year.
We apply this reduction between 10pm and 7am.14 The SWHs and heat pumps currently installed
in Noosa LGA avoid the use of about 7,550 MWh of electricity per year (meaning that, without
them, electricity use would be about 2.1% higher).
SWHs and heat pumps offset the use of off-peak electricity, which costs less than standard
electricity, which means they have a longer payback time than PV systems. We don’t distinguish
between SWHs and heat pumps because we have no data on the likely future split in uptake and
it is likely they will have similar impacts on electricity use. Table III shows the estimated uptake of
residential SWHs and heat pumps taking into consideration the projected population growth.
Table III Uptake of SWHs and Air-sourced Heat Pumps in Noosa LGA (2026)
% of SWH & Heat pumps MWh % decrease
a b
Dwellings decrease cf baseline
Additional Total
Base case 26% 2,485 6,500 4,720 1.3%
Stretch 55% 9,775 13,795 18,575 5.2%
a: Decrease due to additional units
b: As a percentage of Noosa LGA’s 2016/17 underlying electricity use
Other energy efficiency options
There is a wide variety of energy efficiency options available for households as well as
businesses. Behaviour change (such as turning off lights, wearing warmer (or cooler) clothing,
adjusting thermostats etc) is also a very significant contributor to energy efficiency outcomes.15
The uptake of these options has been modelled as a general reduction in load between 7am and
10pm.
In order to create each Scenario we assume that these other energy efficiency options
reduce Noosa LGA’s electricity use in 2026 by the amounts shown in Table IV. Then, when
combined with the impact of population growth and residential SWHs/heat pumps, the final
12
http://www.energyrating.gov.au/products/water-heaters/solar-water-heaters
13
Vieira A.S., Beal, C.D. and Stewart, R.A. (2014) ‘Residential water heaters in Brisbane, Australia: thinking beyond
technology selection to enhance energy efficiency and level of service’, Energy & Buildings, 82, 222-236.
14
SWHs and heat pumps would be much more effective in reducing electricity use during summer than in winter, and
not all electric water heaters operate only between 10pm and 7am, however given the other estimates used here (such
as uptake of these technologies), these assumptions are reasonable.
15
Strictly speaking, behaviour change is an energy conservation measure, not an energy efficiency measure.
Oct 2018 11You can also read