THE ROLE OF CORPORATE RENEWABLE POWER PURCHASE AGREEMENTS IN SUPPORTING US WIND AND SOLAR DEPLOYMENT - BY JAMES KOBUS, ALI IBRAHIM NASRALLAH, AND ...
←
→
Page content transcription
If your browser does not render page correctly, please read the page content below

THE ROLE OF CORPORATE
RENEWABLE POWER PURCHASE
AGREEMENTS IN SUPPORTING US
WIND AND SOLAR DEPLOYMENT
  BY JAMES KOBUS, ALI IBRAHIM NASRALLAH, AND JIM GUIDERA
  MARCH 2021
ABOUT THE CENTER ON GLOBAL ENERGY POLICY
The Center on Global Energy Policy at Columbia University SIPA advances smart, actionable
and evidence-based energy and climate solutions through research, education and dialogue.
Based at one of the world’s top research universities, what sets CGEP apart is our ability to
communicate academic research, scholarship and insights in formats and on timescales that
are useful to decision makers. We bridge the gap between academic research and policy —
complementing and strengthening the world-class research already underway at Columbia
University, while providing support, expertise, and policy recommendations to foster stronger,
evidence-based policy. Recently, Columbia University President Lee Bollinger announced
the creation of a new Climate School — the first in the nation — to tackle the most urgent
environmental and public health challenges facing humanity.

Visit us at www.energypolicy.columbia.edu

            @ColumbiaUEnergy

ABOUT THE SCHOOL OF INTERNATIONAL AND PUBLIC AFFAIRS
SIPA’s mission is to empower people to serve the global public interest. Our goal is to foster
economic growth, sustainable development, social progress, and democratic governance
by educating public policy professionals, producing policy-related research, and conveying
the results to the world. Based in New York City, with a student body that is 50 percent
international and educational partners in cities around the world, SIPA is the most global of
public policy schools.

For more information, please visit www.sipa.columbia.edu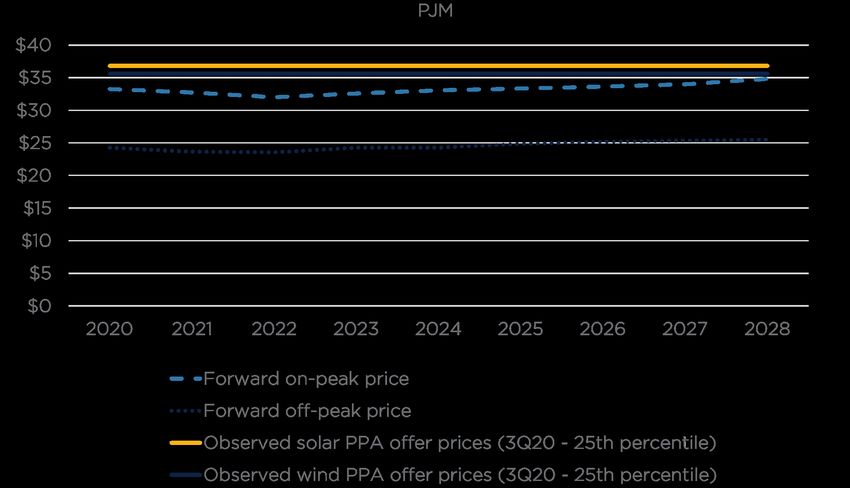
THE ROLE OF CORPORATE
RENEWABLE POWER
PURCHASE AGREEMENTS IN
SUPPORTING US WIND AND
SOLAR DEPLOYMENT
BY JAMES KOBUS, ALI IBRAHIM NASRALLAH, AND JIM GUIDERA
MARCH 2021

Columbia University CGEP
1255 Amsterdam Ave.
New York, NY 10027
energypolicy.columbia.edu

          @ColumbiaUenergy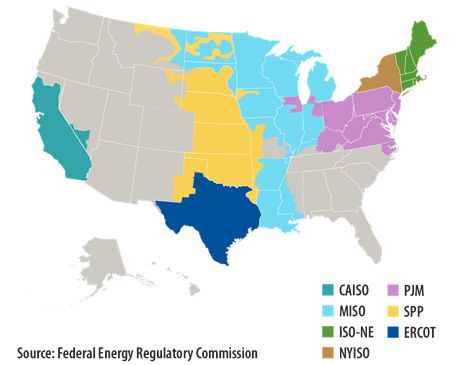
THE ROLE OF CORPORATE RENEWABLE POWER PURCHASE AGREEMENTS IN SUPPORTING US WIND AND SOLAR DEPLOYMENT

ABOUT THE AUTHORS
James Kobus is a research analyst at LNZ Capital LP, where he focuses on investments in the
power and clean technology industries. Prior to his work at LNZ Capital, James was a research
assistant at the Columbia SIPA Center on Global Energy Policy. James has also worked as a
power sector investment analyst at both The D. E. Shaw Group and Morgan Stanley. Through
his work at GreenMax Capital Advisors, James has contributed to international development
finance efforts including the World-Bank-funded Regional Off-Grid Electrification Project,
aimed at scaling the off-grid solar market in West Africa. James holds a master of
international affairs from Columbia SIPA, with a concentration in energy and environmental
policy. He also holds a bachelor’s degree from the University of Michigan, where he studied
finance and philosophy.

Ali Nasrallah graduated from Columbia University with a master of public administration
in development practice, where he focused on renewable energy and climate change. He
also received a bachelor’s degree in electrical engineering from the University of Jordan
in Amman. Ali has worked in the energy industry in different roles with the private sector,
business associations, academia, and as a consultant for public agencies. His experience spans
regions such as the Middle East, Africa, South America, and North America.

Jim Guidera has been an adjunct professor of international energy project finance at
Columbia SIPA since 2014. He has had a long career as an energy banker, including 20 years
as the project finance group head at Credit Agricole CIB in New York, a leading lender to
renewables and other energy projects in the North American market. He continues to consult
on energy financing though Ghent Associates LLC.

                                                                           ENERGYPOLICY.COLUMBIA.EDU | MARCH 2021 | 3
THE ROLE OF CORPORATE RENEWABLE POWER PURCHASE AGREEMENTS IN SUPPORTING US WIND AND SOLAR DEPLOYMENT ACKNOWLEDGMENTS The authors would like to thank several anonymous reviewers who provided useful comments and feedback. The authors would also like to acknowledge Dr. Melissa Lott, Matthew Robinson, Christina Nelson, and Sarah La Monaca for their overall guidance and contributions to this paper. Finally, the authors would like to thank the numerous renewables PPA market participants and analysts whose input informed this study. This policy paper represents the research and views of the authors. It does not necessarily represent the views of the Center on Global Energy Policy. The paper may be subject to further revision. This work was made possible by support from the Center on Global Energy Policy. More information is available at https://energypolicy. columbia.edu/about/partners. 4 | CENTER ON GLOBAL ENERGY POLICY | COLUMBIA SIPA
THE ROLE OF CORPORATE RENEWABLE POWER PURCHASE AGREEMENTS IN SUPPORTING US WIND AND SOLAR DEPLOYMENT
TABLE OF CONTENTS
Executive Summary 07
A. Background 09
B. Recent Trends in the US Corporate Renewable PPA Market 12
Sustainability Goal Setting 12
The Matching Concept 12
A Focus on “Additionality” 12
A Partial Hedge of the Buyer’s Power Costs 13
C. Impact of COVID-19 on the US Renewables PPA Market 15
Negative Drivers 15
Positive Offsets 16
Overall Takeaways 16
D. Growth Drivers in the Corporate Renewables PPA Market through 2030 17
Growth Driver #1: A Vast and Largely Untapped US C&I Power Demand Pool 17
Growth Driver #2: An Increased Focus on the Sustainability Profiles of US
Corporations 19
Growth Driver #3: Rapid Growth in Technology-Sector Power Demand 20
Growth Driver #4: Continued Cost Declines for Wind and Solar 25
E. Constraints on the Corporate Renewables PPA Market Size 27
Constraint #1: Regulation That Limits the Feasibility of PPAs in Some Regional
Markets 27
Constraint #2: The Need for Renewable PPA Prices to Be Competitive with
Wholesale Power Prices 29
Constraint #3: Scale and Creditworthiness Requirements 33
Constraint #4: Financial Risks and Alternative Emissions Reduction Mechanisms 35
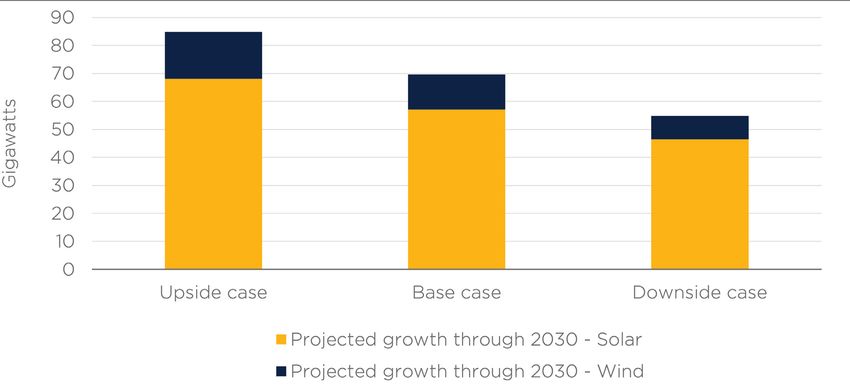
F. Putting It All Together: Sizing the Corporate Renewables PPA Market over the
Next Decade 37
Base Scenario 38
Upside Scenario 39
ENERGYPOLICY.COLUMBIA.EDU | MARCH 2021 | 5THE ROLE OF CORPORATE RENEWABLE POWER PURCHASE AGREEMENTS IN SUPPORTING US WIND AND SOLAR DEPLOYMENT
Downside Scenario 40
G. Policy Implications 41
Federal Policy Implications 41
State-Level Policies 43
H. Conclusion 45
I. Appendix 46
How PPAs with Renewables Work 46
Case Studies: Comparing Forward Prices with the PPA Price Offers from Wind
and Solar Sources 47
Expanding on Constraint #4: Financial Risks and the Existence of Alternative
Emissions Reduction Mechanisms 55
Overview of Projections for Base, Upside, and Downside Scenarios 58
Notes 60
6 | CENTER ON GLOBAL ENERGY POLICY | COLUMBIA SIPATHE ROLE OF CORPORATE RENEWABLE POWER PURCHASE AGREEMENTS IN SUPPORTING US WIND AND SOLAR DEPLOYMENT
EXECUTIVE SUMMARY
In recent years, many of the world’s biggest corporations, including Google, Facebook,
Microsoft, and Apple, have pledged to power their businesses with increasing amounts of
renewable energy in order to reduce their carbon footprints and contribute to efforts to
address climate change. Such efforts have had an encouraging impact on US power sector
decarbonization, with a material and increasing share of US wind and solar deployments
now driven by the procurement preferences of corporate customers. The vast majority
of corporate procurement of renewable energy has been secured via power purchase
agreements (PPAs).
Going forward, a wider universe of companies is expected to look to such PPA agreements as
a means of contributing to a low-carbon future, raising the question of how substantial these
initiatives might be in supporting the overall transition to zero-carbon electricity. Indeed, a
number of positive underlying trends are likely to facilitate continued growth in the corporate
renewables PPA market. For example, electricity demand in the technology sector continues
to grow rapidly, while renewables PPA penetration in the commercial and industrial sectors
more broadly remains low, with room to grow. Additionally, expectations of continued declines
in the costs of solar and wind technologies are likely to facilitate more procurement. Lastly,
US companies are facing increased pressure from customers, employees, and institutional
investors to improve their greenhouse gas emissions profiles.
At the same time, certain factors may constrain the size of the PPA market, such as market
regulations that limit the feasibility of PPAs in certain regions and the need for renewable
PPA prices to be competitive relative to wholesale power prices. Scale and creditworthiness
requirements can also limit the universe of potential corporate buyers, and the financial risks
brought about when signing long-term contracts may further deter some market participants.
Finally, companies increasingly have alternative emission reduction mechanisms at their
disposal, such as renewables energy credits (RECs), carbon offsets, and green tariff programs.
This student-led paper, from the Power Sector and Renewables Research Initiative at
Columbia University’s Center on Global Energy Policy, explores the drivers influencing the
renewables PPA market and assesses whether these procurement initiatives by nonutility
corporations are likely to continue growing in the United States at a rapid enough pace to
support power sector deep decarbonization goals. The analysis finds that while robust private
sector participation in recent years has been encouraging, the potential market size going
forward may be smaller than previously projected, highlighting the need for comprehensive
policy frameworks to support power sector decarbonization.
More specifically, the findings are as follows:
● Under current policy conditions, the corporate renewables PPA market could
drive between 218 and 296 TWh of demand equating to 55–85 GW of incremental
solar and wind capacity additions in the United States through 2030 across
ENERGYPOLICY.COLUMBIA.EDU | MARCH 2021 | 7THE ROLE OF CORPORATE RENEWABLE POWER PURCHASE AGREEMENTS IN SUPPORTING US WIND AND SOLAR DEPLOYMENT
three scenarios. While this range implies significant growth, the base case scenario
suggesting additions of around 70 GW is below other projections and implies that
recent procurement rates could slow.
● These results, showing a wide range of potential outcomes and the possibility that
PPAs may not drive as much renewable capacity additions as has been projected
by other organizations, highlight the risk in overreliance on private sector actors to
voluntarily address unpriced greenhouse gas externalities. While renewables costs
have fallen dramatically in recent years and the actions of many large US corporations
have led to significant additions of zero-carbon generation resources, the market may
not be deep enough to sustain its recent pace of annual procurements without further
policy incentives.
● More comprehensive policy frameworks are needed if US policy makers wish to
achieve the rapid growth in renewable electricity that is needed to support broader
decarbonization of the nation’s economy.1 Effectively designed decarbonization
policies could drive greater growth from traditional sources of renewable energy
demand (e.g., utilities) while also making emissions reduction initiatives a more
straightforward business decision for corporations. These could include federal carbon
pricing, clean electricity standards, increased research and development (R&D)
spending, green infrastructure investment, and the extension of federal tax credits.
Initiatives to expand zero-carbon targets, corporate green tariff offerings, and firm
REC values at the state and regional level could also accelerate renewable adoption.
● The US corporate PPA market has been impacted by the COVID-19 pandemic, with
some projects facing supply chain disruptions, financing bottlenecks, and higher
offer prices. As a result, 2020 renewables PPA transactions tracked below 2019 levels.
It remains to be seen whether the pandemic will have any long-term impacts on
corporate procurement initiatives.
8 | CENTER ON GLOBAL ENERGY POLICY | COLUMBIA SIPATHE ROLE OF CORPORATE RENEWABLE POWER PURCHASE AGREEMENTS IN SUPPORTING US WIND AND SOLAR DEPLOYMENT
A. BACKGROUND
The Intergovernmental Panel on Climate Change estimates that, relative to 2010 levels, a 45
percent reduction in net carbon dioxide (CO2) emissions is needed by 2030 in order to limit
global temperature rises to 1.5°C. Over the same period, a 25 percent reduction in emissions
is required to keep the world on track for a 2.0°C increase.2 The US power sector has made
significant progress toward these targets, with 2018 CO2 emissions having declined about 21.5
percent compared to 2010 levels.3 This reduction has been largely due to reductions in coal
power and switching to natural gas for power generation, and an increased use of renewables.
However, economy-wide progress toward emissions reductions has been much slower,
decreasing by roughly 6.5 percent from 2010 to 2018.4
Decarbonization scenario projections typically include increased levels of end-use
electrification (e.g., of cooking, driving, and space heating and cooling) in parallel with the
decarbonization of power sector supply. For example, in 2019, Evolved Energy Research
(EER), in partnership with the UN-affiliated Deep Decarbonization Pathways Project, released
a report titled 350 PPM Pathways for the United States, which presented six different
pathways to reduce CO2 concentrations in the atmosphere to 350 parts per million (350
ppm) in 2100, which would likely allow warming to peak below 1.5°C and not exceed 1.0°C by
century’s end.5 In these scenarios, the authors applied different assumptions across four key
pillars of economy-wide decarbonization: power sector decarbonization, energy efficiency,
end-use electrification, and carbon capture. EER has since updated its scenario projections
internally and has shared the data with the authors of this report. Across their updated
scenarios, EER modeling suggests that on average roughly 45 GW of combined wind and
solar additions will be required annually through 2030 to meet decarbonization targets.6
So far renewables additions in the United States materially lag the levels suggested by the
EER models. According to estimates from BloombergNEF (BNEF), the United States added
an estimated 21 and 33.8 GWs of new renewables capacity, respectively, in 2019 and 2020.7
NextEra Energy, the world’s largest private wind and solar energy developer, projects that
annual installations will grow to 30–35 GW later in the decade.8 Even if this robust growth
transpires, however, the United States would still be tracking significantly below the levels
needed to support global efforts to limit warming to below 2°C.
Achieving these levels of renewables deployment will require large amounts of capital.
In some regions of the United States, regulated utilities are able to integrate renewables
investments into their regulated cost structures, recouping a low-risk return over time from
their ratepayers. Additionally, state-level renewable portfolio standards (RPS) that require
utilities9 to source a minimum defined share of their power from renewable sources have
historically been a major driver of US renewable energy deployment.10 While some states have
been raising their RPS goals, many states have already met or are close to meeting their goals,
moderating a historically important source of demand in many regions.11
For nonutility investors, a PPA or some other form of long-term revenue hedge has frequently
ENERGYPOLICY.COLUMBIA.EDU | MARCH 2021 | 9THE ROLE OF CORPORATE RENEWABLE POWER PURCHASE AGREEMENTS IN SUPPORTING US WIND AND SOLAR DEPLOYMENT
been a routine requirement for their investments. Historically, the vast majority of PPAs have
been signed with utility companies as buyers. However, in recent years a trend has emerged:
for-profit corporate entities with material power loads have been entering into long-term
PPAs directly with renewable developers of onshore wind and solar generation assets.
Figure 1 demonstrates the recent increase in corporate renewables procurement by tracking
yearly announcements of corporate PPAs signed as well as green tariff commitments.12 Since
project completions tend to lag PPA signing, these procurements are a leading indicator
of the increased renewables deployment to be enabled by corporate PPAs. While 2020
procurement was negatively impacted by the COVID-19 pandemic, as discussed in Section B
of this report, the strong growth of US corporate procurement is clearly visible.
Figure 1: Corporate-driven renewable energy procurement since 2009
15 45
13.6
11.9
12 36
Cumulative (GW)
Annual (GW)
8.5 8 27
9
10
6 18
4.3
3.3
3.4
3 2.4 0.6 9
1.0 5.6
1.5 0.7 4.2
0.3 0.1 0.2 0.1 0.4 2.4 2.7 1.9
1.4 1.7
0 0
2009 2010 2011 2012 2013 2014 2015 2016 2017 2018 2019 2020
Wind Solar Other Cumulative
Source: “Sustainable Energy in America Factbook,” Business Council for Sustainable Energy, Bloomberg
New Energy Finance (BNEF), 2021 43, https://bcse.org/factbook/.
Note: Corporate procurement includes all categories of corporate procurement, including PPAs and
green tariffs.
Further growth in the corporate PPA market is frequently projected as an important future
driver of renewable capacity additions.13 In 2019, Wood Mackenzie, for example, published
a report in conjunction with the American Wind Energy Association, forecasting 85 GW of
incremental US corporate renewable energy procurement through 2030.14 On a global level,
BNEF conducted a bottom-up assessment of the over 280 companies that have signed the
RE100 pledge, committing to sourcing 100 percent renewable electricity by no later than
2050. Overall, BNEF estimated that demand from these companies alone will drive 93 GW
10 |CENTER ON GLOBAL ENERGY POLICY | COLUMBIA SIPATHE ROLE OF CORPORATE RENEWABLE POWER PURCHASE AGREEMENTS IN SUPPORTING US WIND AND SOLAR DEPLOYMENT
of corporate wind and solar procurement by 2030.15 The International Renewable Energy
Agency (IRENA) has projected that global corporate renewable energy procurement would
grow to a staggering 2,150 TWh by 2030,16 which would suggest over 700–800 GW of new
capacity globally depending on the assumed split between wind and solar and respective
capacity factors.
Not all forecasts have been as optimistic. IHS Markit, in a recent October 2020 report, arrived
at a lower forecast. The report forecasts that corporate contracting, in the defined “planning
case,” is likely to amount to between 200 and 225 TWh by 2030, enabling 44–72 GW of US
wind and solar additions from 2021 to 2030.17
This paper arrives at scenario projections that are similarly below previous expectations. The
2030 scenario projections outlined suggest a range of 218–296 TWh, equating to 55–85 GW
of capacity additions from 2021 to 2030. Differences in the TWh to GW conversion rates
between reports are likely explained by differences in assumed capacity factors.
ENERGYPOLICY.COLUMBIA.EDU | MARCH 2021 | 11THE ROLE OF CORPORATE RENEWABLE POWER PURCHASE AGREEMENTS IN SUPPORTING US WIND AND SOLAR DEPLOYMENT
B. RECENT TRENDS IN THE US CORPORATE
RENEWABLE PPA MARKET
This section summarizes recent overarching trends in the US corporate renewable PPA market
to provide context for the subsequent discussion of potential future trends. For a detailed
discussion on the mechanics of corporate PPAs, please see the appendix. Corporate PPAs are
typically described as physical or virtual. This report’s main focus is on virtual PPAs (VPPAs),
which currently represent the vast majority of PPAs between corporations and renewable
generation projects.18 In contrast to physical PPAs, virtual PPAs do not require the physical
delivery of the electricity produced by the renewable generator to the corporate buyer.
Rather, a VPPA is a purely financial transaction in which the buyer agrees to virtually purchase
electricity that is generated by the renewables project at a fixed price.19
Sustainability Goal Setting
Companies that are leading the movement to reduce greenhouse gas emissions have, in many
cases, set public goals for increasing the percentage of their electricity consumption that can
be matched by renewable sources. This percentage has become a key metric for measuring a
corporate entity’s commitment to sustainability. The number of companies with these types
of targets has been steadily increasing over the past three years. Positive momentum for 100
percent renewable energy commitments among corporate entities has been enhanced by the
public reporting of the Climate Group’s RE100 initiative together with the Carbon Disclosure
Project, among others. As one example, RE100 is a global initiative of influential businesses
committed to 100 percent renewable electricity that was launched in 2014.20
The Matching Concept
These corporate goals are predominantly structured so that the corporation’s aggregate
annual electricity consumption is matched with renewable energy production that is not
physically consumed by that corporation.21 For example, when a corporation with an annual
electricity load of 500,000 MWhs reports that its consumption is 50 percent renewable, it
means that it has contracted for 250,000 MWhs of renewable electricity that is generated
into the broader national electricity grid. In a VPPA, these electrons do not actually reach
the corporation’s facilities or match its demand curve on a subannual basis. Rather, the
corporation’s operations receive electricity from its local utility. The supply profile of
the matching renewable electricity source has its own generation profile, not that of the
corporation’s load.
A Focus on “Additionality”
Corporations have been able to take credit for supporting renewable energy through four
primary methods:
1. Deploying distributed renewable generation on-site, such as rooftop solar
2. Purchasing unbundled renewable energy certificates (RECs) that are generated by
renewable electricity generation sources and sold separately from electricity
12 |CENTER ON GLOBAL ENERGY POLICY | COLUMBIA SIPATHE ROLE OF CORPORATE RENEWABLE POWER PURCHASE AGREEMENTS IN SUPPORTING US WIND AND SOLAR DEPLOYMENT
3. Purchasing electricity from local utility distribution companies via green tariff
programs designed to provide compensation for renewable energy sources, such as
hydro, wind, and solar, that the utilities have procured
4. Entering into PPAs directly with new renewable electricity generation suppliers (with
the accompanying RECs included for retirement)
Advocates for increasing the pace of renewables deployment have increasingly discounted
the purchase of unbundled RECs as the least impactful of these methods.22 This is largely
because existing renewable sources can continue to accrue RECs for sale to the market. In
turn, REC purchases among green-minded corporations do not, in isolation, ensure that new
additional renewable sources are being deployed. This additionality principle has become a
priority among leading stakeholders in the energy transition, as highlighted by Google in its
December 2016 white paper.23
Nonetheless, purchasing RECs continues to be an important method for companies that are
not in the power sector to support renewable energy. REC sales provide an additional revenue
stream for renewable electricity suppliers, apart from the power sales, usually through a
state-administered auction process. When corporate entities seeking to be “green” participate
in the REC market, they support REC values, and when they enter into long-term REC
purchases, they add to the REC revenue streams. So, while not additional to the same degree
as a corporation serving as an anchor offtaker on a PPA, the purchase of RECs still provides
support for renewable generators.
“Green tariffs” refer to optional programs offered by utilities and approved by state public
utility commissions. They allow larger commercial and industrial customers to buy bundled
renewable electricity from a specific project through a special utility tariff rate. Under a
green tariff, a distribution utility supplies an interconnected corporation with up to 100
percent renewable power and bundled RECs from projects either owned or contracted
by the utility.24 The corporations that participate in these tariff programs can claim to be
contributing to additionality, where new projects are being constructed as a result. These
tariffs require state regulatory approval and are currently available in 17 states (see the
“State Policy Implications” section for more details).
Where a green tariff program is not available, a PPA creates certainty both in terms of
power sales and REC sales for a renewables project. The resulting long-term revenue
stream is often the critical piece that allows a renewable energy asset to raise the financing
necessary to fund the large upfront capital costs inherent in such projects. Because PPAs
directly enable new capacity that otherwise might not have been constructed, these
projects are considered additional.25
A Partial Hedge of the Buyer’s Power Costs
In addition to allowing corporations to meet their sustainability goals, VPPAs provide a
hedge against market risk for both the generator’s power sales revenues and the purchaser’s
power costs. The VPPA arrangement partially hedges the volumetric energy component of
the purchaser’s utility bill, which is largely based on the distribution utility’s variable energy
ENERGYPOLICY.COLUMBIA.EDU | MARCH 2021 | 13THE ROLE OF CORPORATE RENEWABLE POWER PURCHASE AGREEMENTS IN SUPPORTING US WIND AND SOLAR DEPLOYMENT procurement costs. A VPPA does not, however, impact or provide a hedge against the other nonenergy components of the buyer’s power bill (i.e., demand charges). How effective a VPPA may be as an energy hedge for the purchaser will depend on how the contract is structured along with other issues explained more fully in the appendix. A physical PPA does have the potential to reduce the demand charge portion of a buyer’s utility bill by reducing the buyer’s peak demand as measured by its provider. However, logistical and regulatory issues limit the potential for these arrangements.26 14 |CENTER ON GLOBAL ENERGY POLICY | COLUMBIA SIPA
THE ROLE OF CORPORATE RENEWABLE POWER PURCHASE AGREEMENTS IN SUPPORTING US WIND AND SOLAR DEPLOYMENT

C. IMPACT OF COVID-19 ON THE US
RENEWABLES PPA MARKET
The scenarios presented in the next section of this report focus on long-term structural trends
in the renewables PPA market in the United States. However, it is worth first discussing the
near-term impact of the ongoing COVID-19 pandemic.

Negative Drivers
   1.   Supply Chain Impacts: Renewable energy supply chains are highly globalized. US
        wind projects often source blades and turbines from international suppliers, and the
        ever-increasing size of wind structures necessitates intricate transportation processes.
        Moreover, the solar photovoltaic (PV) supply chain is highly exposed to the US-
        China trade relationship. Supply chain disruptions and in some cases sourcing from
        secondary suppliers has increased the costs of renewable energy projects. Many US
        projects have faced delays as a result of these dynamics, and some developers have
        faced force majeure notices.27

   2. Weak Demand Growth and Lower Wholesale Prices: Recessionary conditions have
      led to weak commercial and industrial (C&I) electricity demand and lower wholesale
      electricity prices in some regions, both of which negatively impact demand for PPAs.
      The COVID-19 pandemic and subsequent economic lockdowns in early 2020 drove
      down weekday electricity demand in the central region of the United States and New
      York 9–13 percent in March and April. The demand in MISO (Midcontinent Independent
      System Operator) areas 2 and 7, which cover most of Michigan and Wisconsin and
      include a high concentration of industrial customers such as car manufacturers,
      dropped between 11 percent and 16 percent. Notably, Florida—which has a higher
      percentage of residential load (53 percent versus 36 percent for the aforementioned
      regions) and warmer temperatures—did not witness weekday electricity demand
      decreases.28 While industrial demand has generally improved from these initial
      declines, commercial weakness has persisted in many regions of the United States.29

   3. Shifting Priorities and Financing Availability: The decline in 2020 corporate
      procurement may have also been driven in part by government and business priorities
      shifting away from sustainability initiatives to more immediately pressing concerns.
      Additionally, some corporations may have become more risk averse when it comes to
      discretionary investments and long-term commitments. Businesses may also be more
      hesitant to pay a “green premium” for indirect, less tangible benefits during a recession
      or depression. Lastly, the recession has lowered the profits and resulting incentives for
      banks and other financial players to provide tax equity financing, which is an essential
      part of the capital structure for most renewable projects.

   4. Declining Credit Ratings: Declining credit ratings among businesses resulting from the
      economic downturn could reduce the number of organizations that could realistically
      enter into long-term PPAs.

                                                                           ENERGYPOLICY.COLUMBIA.EDU | MARCH 2021 | 15
THE ROLE OF CORPORATE RENEWABLE POWER PURCHASE AGREEMENTS IN SUPPORTING US WIND AND SOLAR DEPLOYMENT
Positive Offsets
1. Green Stimulus Packages: Economic stimulus packages have provided incremental
support for renewable energy projects. The US government passed a $2.2 trillion
economic relief stimulus package in late March 2020, the largest stimulus in the
history of the United States.30 Although Democrats initially lobbied for the inclusion of
renewable energy support, these provisions did not make it into the final bill.31 However,
on December 21, 2020, Congress passed the Consolidated Appropriations Act, 2021
which included a one-year extension of the wind production tax credit (PTC) at 60
percent of its original value and a two-year extension of the solar investment tax credit
(ITC) at a level of 26 percent.32 Further extensions or new incentives may result from the
shift to Democratic control of the congressional and executive branches in 2021.
2. Low Interest Rates: Interest rates for low-risk assets have fallen to record lows as
investors fled to safe haven assets in the midst of economic uncertainty. This drop
could allow renewable energy projects to raise greater amounts of debt financing at
more attractive rates.
3. Increased Interest in Infrastructure Investments: The recent volatility in financial
markets could lead to an increased appetite by investors for infrastructure projects,
including renewables, that have been described as “low-risk, stable-yield opportunities
at a time of extraordinary market volatility.”33
Overall Takeaways
In light of these drivers, several market forecasting firms lowered their overall renewables
capacity forecasts at the onset of the pandemic.34 However, the negative impacts of the
pandemic on renewables deployment overall appear to have been less than initially feared.
As noted earlier, BNEF data show that overall renewables deployment in the United States in
2020 exceeded that of 2019 despite the pandemic, which did not suppress the large volume
of projects already on track for 2020 completion.
Corporate renewables procurement, however, was in fact negatively impacted by the
pandemic, at least relative to record 2019 levels. BNEF reports that corporate procurements
totaled 11.9 GW in 2020, below 2019’s total of 13.6 GW and the first year-over-year reduction
since 2016.35 Additionally, LevelTen Energy has noted that solar and wind PPA offer prices rose
11.5 percent and 24.3 percent, respectively, in part due to COVID-19 disruptions.36
The essential question is whether corporate procurement initiatives impacted by COVID-19 will
shift into later years or if overall deployment will decline over the long run. This paper seeks to
look past these short-term disruptions to instead focus on the longer-term structural drivers
of the US renewables PPA market.
16 |CENTER ON GLOBAL ENERGY POLICY | COLUMBIA SIPATHE ROLE OF CORPORATE RENEWABLE POWER PURCHASE AGREEMENTS IN SUPPORTING US WIND AND SOLAR DEPLOYMENT
D. GROWTH DRIVERS IN THE CORPORATE
RENEWABLES PPA MARKET THROUGH 2030
US C&I electricity demand totaled about 2,307 TWh in 2019.37 This pre-pandemic figure
represents the total addressable corporate renewables PPA market in the widest sense.
The rest of this section explores a number of positive and negative drivers that can, when
combined, facilitate a more refined estimate of the longer-term addressable market. The
authors explore the following drivers and constraints:
Factors driving growth in the corporate renewables PPA market:
1. A vast and largely untapped US C&I power demand pool
2. An increased focus on the sustainability profiles of US corporations
3. Rapid growth in technology-sector power demand
4. Continued cost declines for wind and solar
Constraints on the corporate renewables PPA market size:
1. Regulation that limits the feasibility of PPAs in some regional markets
2. The need for renewable PPA prices to be competitive relative to wholesale power prices
3. Scale and creditworthiness requirements
4. Financial risks and the existence of alternative emissions reduction mechanisms
Growth Driver #1: A Vast and Largely Untapped US C&I Power
Demand Pool
The nascent corporate renewable PPA market is about 10 years old. Corporate demand
accelerated rapidly from 2013 onward, and unprecedented growth took place in 2018 and
2019, as shown in Figure 2. According to publicly available BNEF data, at the end of 2019, the
cumulative PPA capacity contracted from renewable energy sources (excluding green tariffs)
was approximately 27.2 GW, with higher penetration of wind energy in comparison to solar.38
The 11.2 GW of additional PPAs signed in 2019 alone represents more than 40 percent of the
total corporate-contracted capacity since 2009.39
ENERGYPOLICY.COLUMBIA.EDU | MARCH 2021 | 17THE ROLE OF CORPORATE RENEWABLE POWER PURCHASE AGREEMENTS IN SUPPORTING US WIND AND SOLAR DEPLOYMENT Figure 2: Growth in the US PPA market has been rapid Source: Created by authors using annual BNEF Corporate Clean Energy press releases. Note: These totals differ from Figure 1 due to the exclusion of green tariffs and other non-PPA corporate procurement initiatives from the total, leaving only PPA transactions. 2020 breakdown of corporate procurement not yet available. See Table 9 for full citation and calculations. Assuming average capacity factors for solar and wind of 27 percent and 37 percent, respectively, these corporate PPAs would produce close to 80 TWh of electricity per year.40 Given that total US commercial and industrial electricity demand was about 2,300 TWh in 2019, corporate renewable energy PPAs would represent only about 3.3 percent of US C&I electricity demand (Table 1). While the realistic total addressable market for corporate renewable PPAs is materially smaller than total C&I electricity demand—as discussed in this analysis—it is clear that there is still significant room for corporate renewables PPA penetration to increase.41 18 |CENTER ON GLOBAL ENERGY POLICY | COLUMBIA SIPA
THE ROLE OF CORPORATE RENEWABLE POWER PURCHASE AGREEMENTS IN SUPPORTING US WIND AND SOLAR DEPLOYMENT

Table 1: Estimated renewable PPA penetration of annual C&I demand

 Cumulative US solar PPA capacity (GW)                                       12.3
 Assumed solar capacity factor                                               27%
 Estimated annual US solar PPA generation (TWh)                              29.0
 Cumulative US wind PPA capacity (GW)                                        14.8
 Assumed wind capacity factor                                                37%
 Estimated annual US wind PPA generation (TWh)                               47.9
 2019 US C&I electricity demand (TWh)                                        2,307
 Solar corporate PPA penetration                                             1.3%
 Wind corporate PPA penetration                                              2.1%
 Total corporate PPA penetration                                             3.3%

Source: Calculations by authors using data from the EIA and BNEF.42

Growth Driver #2: An Increased Focus on the Sustainability Profiles of
US Corporations
A broad survey recently completed by RE100 compiled a variety of self-reported reasons
that corporations are committing to 100 percent renewable electricity targets. Some of the
explanations, such as cost savings and risk management, can directly enhance the bottom
line of these businesses. Other cited reasons, however, may benefit these corporations
more indirectly, such as by improving customer or employee retention. As more consumers
incorporate broader societal concerns into their purchasing decisions, for example, it could
make economic sense for a business to incur additional costs for sustainability initiatives
in order to increase its sales. Moreover, employees are also increasingly seeking to work
at businesses that emphasize sustainable values.43 Corporations seeking to attract highly
skilled employees may gain an advantage by crafting an image as a sustainable brand.44

Additionally, companies are facing increasing pressure from institutional investors to
improve their sustainability performance, with 76 percent of RE100’s respondents indicating
that shareholder requests are an important driver for their efforts to source renewable
electricity.45 Overall, the Global Sustainable Investment Alliance estimates that “sustainable”
investing assets under management totaled $30.7 trillion at the start of 2018, representing
a 34 percent increase over the preceding two years.46 And this total is widely anticipated
to grow further. As sustainability factors are increasingly incorporated into investing
decision criteria, companies that perform poorly on these metrics may face a cost of capital
disadvantage. This provides another economic, self-interested incentive for corporations’ to
improve their sustainability profiles.

A number of other new platforms and alliances support corporate commitments to “green”

                                                                           ENERGYPOLICY.COLUMBIA.EDU | MARCH 2021 | 19
THE ROLE OF CORPORATE RENEWABLE POWER PURCHASE AGREEMENTS IN SUPPORTING US WIND AND SOLAR DEPLOYMENT
their operations, with a significant focus on renewable electricity. Examples include the
Carbon Disclosure Project, Corporate Renewable Buyers’ Principles at the World Resources
Institute, Renewable Energy Buyers Alliance (REBA), and the Business Renewables Center at
the Rocky Mountain Institute.
Finally, as more companies commit to sourcing their electricity from renewables, the pressure
is likely to rise for other players in their sector to follow suit. If there are cost savings for
renewable procurement, companies that do not procure renewable electricity may be at
a disadvantage. Further, as discussed, maintaining a corporate image of sustainability is
becoming increasingly important for customer and employee retention. These reinforcing
pressures may drive a positive feedback loop: as more companies become sustainable, those
who lag behind could be put at a competitive disadvantage. This effect could push companies
in the United States to be more aware of their relative sustainability portfolios and pursue
renewable electricity procurement.
Growth Driver #3: Rapid Growth in Technology-Sector Power Demand
Information technology companies tend to have large and growing electricity loads, and many
of these businesses already exceed 1 TWh of annual demand.47 For example, Google’s power
usage doubled from around 5 TWh in 2014 to 10 TWh in 2018 (see appendix). Facebook’s
total electricity usage nearly doubled from 1.8 TWh to 3.4 TWh between 2016 and 2018 (see
appendix). Microsoft saw its electricity usage more than double from 2014 to 2018, rising from
3.5 TWh to 7.6 TWh.
Table 2: Electricity consumption growth in the information technology sector
Electricity Electricity Electricity Compound
usage usage usage Addition Addition annual YoY
2014 2017 2018 (TWh) (TWh) growth growth
Company (TWh) (TWh) (TWh) 14-18 17-18 14-18 17-18
Google 4.5 7.5 10 5.5 2.5 22.10% 33.30%
Facebook 1.04 2.46 3.42 2.38 0.96 34.70% 39.00%
Microsoft 3.5 6.3 7.6 4.1 1.3 21.40% 20.60%
Total 9.04 16.26 21.02 11.98 4.76 23.50% 29.30%
Source: Google’s Environmental Report 2019; Facebook’s Sustainable Data Centers; Microsoft’s 2019 and
2016 Data Factsheets: Environmental Indicators.48
This growth in electricity usage has largely been driven by data centers, which consume 10–50
times the amount of electricity per unit of floor space of a typical commercial office building.
Collectively, these data centers account for approximately 2 percent of the total US electricity
use, and this total is expected to grow.49 This large electricity demand growth from the big
tech players is already driving renewables deployment as these companies work to meet not
only increasing demand but also to work toward their sustainability commitments. Based on
these trends, electricity demand growth from these data centers in the United States could
20 |CENTER ON GLOBAL ENERGY POLICY | COLUMBIA SIPATHE ROLE OF CORPORATE RENEWABLE POWER PURCHASE AGREEMENTS IN SUPPORTING US WIND AND SOLAR DEPLOYMENT
drive continued renewable PPA demand, even from the existing players in the market. While
recent 30 percent-plus annual growth rates might not be indicative of long-term trends,
strong growth in this arena is still considered likely.50
A small number of technology companies have dominated the US corporate renewables PPA
market to date. According to data from REBA, in 2019 seven companies (including Facebook,
Google, AT&T, Microsoft, T-Mobile, Walmart, and Amazon) accounted for over 60 percent of total
reported renewable energy purchases tracked by the organization.51 This figure illustrates how
the procurement decisions of a small number of large electricity consumers can significantly
impact the market, a dynamic to be discussed in greater detail elsewhere in this report.
Alphabet Inc.’s subsidiary Google has been a particularly visible and significant leader in
driving the deployment of new renewable energy generation sources and pushing the
conversation of what it means to claim that a company’s operations are powered with
renewable electricity. In 2012, the company announced its goal of matching its annual power
load with 100 percent renewable electricity procured. The company achieved this objective in
2017 through a combination of VPPAs, physical PPAs, and green tariffs. In many cases, Google
actively collaborated with its local utilities to establish the green tariff program that it utilizes.
Since 2017 the company has articulated a more ambitious goal of more closely matching
its load with carbon-free supplies on an hourly basis. In this regard, the company has been
measuring and reporting on its progress toward the “24 × 7” carbon-free energy goal, taking
into account both the renewable electricity that it has procured through PPAs and green
tariffs and also from carbon-free electricity drawn from the local electricity generation mix.
Furthermore, the company has signaled that it considers the availability of such sources in
locating new facilities. Google has pledged to support R&D into innovative technologies,
along with policies and market reforms that enable access to carbon-free infrastructure.52 For
example, Google has recently announced a new green tariff arrangement with Nevada Power
that would enable the utility to provide new solar power combined with a battery storage
hybrid project, which it claimed to be the biggest of its kind for a corporate customer when
announced, to power a new Google data center.53
Other corporate decarbonization trends could also support increased demand for renewable
electricity, as companies work to increasingly electrify (e.g., using electric fleet vehicles
and equipment). Amazon, for example, recently revised its 100 percent renewable energy
procurement commitment to be achieved by 2025, five years ahead of the previous schedule,
and committed to a goal to be net-zero carbon by 2040.54 To achieve these goals, the
company has announced that it will procure 100,000 fully electric delivery vehicles worldwide,
the largest order of electric delivery vehicles to date. Of these vehicles, 10,000 will start
operations in 2021 with the full rollout being achieved by 2030.55
The Telecommunications Industry: A Historical Laggard, a Possible Big Player
Green America has estimated that the four largest companies in the telecommunications
industry consume more than 30 TWh56 of electricity each year on a combined basis (now
the three largest companies, following the merger of T-Mobile and Sprint). This equates to
around 1.3 percent of the total C&I electricity consumption in the United States when overlaid
ENERGYPOLICY.COLUMBIA.EDU | MARCH 2021 | 21THE ROLE OF CORPORATE RENEWABLE POWER PURCHASE AGREEMENTS IN SUPPORTING US WIND AND SOLAR DEPLOYMENT
to the EIA figures referenced in Table 1. According to publicly available information, AT&T
and Verizon represent around 25 TWh (83 percent) combined, T-Mobile represents 3.3 TWh
(around 10 percent), and Sprint is responsible for the balance (2 TWh, 7 percent).57 In the
past the industry has been highlighted as a laggard when it comes to renewable electricity
contracting,58 but several telecommunications companies have recently made encouraging
progress. T-Mobile, for example, has made public commitments to move to 100 percent
renewable electricity and joined RE100, estimating that it will save $100 million in the next
15 years through their renewable electricity contracting.59 Additionally, Verizon recently
announced that it has entered into 13 VPPAs enabling approximately 1.7 GW of renewables
capacity as a part of the company’s efforts to achieve carbon neutrality by 2035.60
At the same time, the rollout of 5G equipment is expected to materially increase
telecommunications companies’ electricity demand. It has been estimated that between 2020
and 2030 the global electricity consumption from mobile networks will increase from 98 TWh
to 316 TWh.61 This growth could drive further demand for renewable electricity contracting.
Depending on how aggressive the industry pursues sustainability initiatives, and PPA
projects specifically, this industry could drive an additional 4–15 GW of renewable electricity
procurement in the United States alone.
Table 3: Estimated additional growth in VPPAs that could be driven by telecommunications
industry in the US
% of demand met with renewables PPAs
25% 50% 75% 100%
Estimated Big 4 telecomm 2018 electricity usage (TWh) 30 30 30 30
Estimated Big 4 telecomm 2030 electricity usage 38 38 38 38
(TWh)
Assumed percentage solar 65% 65% 65% 65%
Solar generation needed (TWh) 6.2 12.4 18.5 24.7
Solar generation needed (GWh) 6,183 12,365 18,548 24,731
Assumed solar capacity factor 27% 27% 27% 27%
Estimated incremental solar capacity (GW) 2.6 5.2 7.8 10.5
Assumed percentage wind 35% 35% 35% 35%
Wind generation needed (TWh) 3.3 6.7 10.0 13.3
Wind generation needed (GWh) 3,329 6,658 9,987 13,317
Assumed wind capacity factor 37% 37% 37% 37%
Estimated incremental wind capacity (GW) 1.03 2.05 3.08 4.11
Total estimated incremental solar and wind capacity 3.6 7.3 10.9 14.6
(GW)
Source: Authors’ calculations. 30 TWh figure cited from endnote 56.
22 |CENTER ON GLOBAL ENERGY POLICY | COLUMBIA SIPATHE ROLE OF CORPORATE RENEWABLE POWER PURCHASE AGREEMENTS IN SUPPORTING US WIND AND SOLAR DEPLOYMENT
Which Industries Will Drive Demand Growth From Here?
Conceptually, future growth could come from either (1) continued load growth from
corporations that have already met their sustainability goals or (2) new businesses entering
the PPA market. As will be discussed later in this paper, most corporations do not have
sufficient loads to do repeated PPA deals. This means that a stream of new entrants may be
required to sustain growth.
Growth could reasonably be expected to continue in the information technology sector, even
as major players approach their sustainability goals. Increases in data use and computing
power stemming from new technologies such as 5G could drive additional load growth in
the United States. On the other hand, energy efficiency gains for data centers and other
equipment, new methods of contracting renewable energy other than PPAs, and migration of
data centers abroad could temper growth.
With regards to new businesses entering the PPA market, as previously discussed, the
telecommunications industry could become an important source of growth going forward. The
four largest companies in this industry consume more than 30 TWh and could mobilize up to
14.6 GW in renewable energy PPA deployment, as estimated in Table 3.
Furthermore, nontechnology companies (e.g., retail, food production, oil and gas, health care,
and real estate) could play an increasingly important role moving forward. In 2013, Walmart
announced an objective of sourcing 7 TWh of renewable electricity.62 AB InBev, the global
parent of Anheuser-Busch, has also announced a target to match its worldwide load (6 TWh)63
with 100 percent renewables by 2025. This company’s US subsidiary is on its way to achieve
its goal of purchasing 100 percent renewable electricity for the production of domestic brands
through a sequence of PPAs, with three projects between 2017 and 2019. These projects include
3 MW of solar in New York, 152 MW of wind in Oklahoma, and 222 MW of solar in Texas.64
The oil and gas industry has also become a potential source of PPA growth. In 2019,
companies including Occidental Petroleum, Chevron, and Energy Transfer Partners signed
renewable electricity PPA agreements. In the previous year, ExxonMobil signed two PPA deals
totaling 575 MW.65 The significant electricity load profiles of these companies, combined with
their experience in project finance and growing pressure from divestment movements, could
drive these companies to increase their activity in this area.
ENERGYPOLICY.COLUMBIA.EDU | MARCH 2021 | 23THE ROLE OF CORPORATE RENEWABLE POWER PURCHASE AGREEMENTS IN SUPPORTING US WIND AND SOLAR DEPLOYMENT
Figure 3: Historical renewable energy procurement by industry
100%
80%
60%
40%
20%
0%
2014 2015 2016 2017 2018 2019
Consumer discretionary Industrials
Consumer staples Information technology
Energy Materials
Financials Telecommunications
Healthcare
Credit: Graphic recreated with permission from Renewable Energy Buyers Alliance (REBA).
Source: REBA, as cited in BofA Global Research, US Alternative Energy, “C&I offtake: More sophistication,
more solar, more new corporates,” BofA Securities, February 18, 2020.
Opportunities for Smaller Loads, Aggregations
Companies with smaller, less concentrated loads are also finding ways to participate in
corporate renewable PPAs. Aggregations can expand the universe of practically eligible
corporate counterparts to companies with regional loads of less than 100 GWh, enabling
renewables projects in the range of 50–100 MWs. These types of transactions have the
potential to expand the VPPA market to engage with smaller corporations, moving beyond
the large-load players that have dominated this market to date.
As one example, Starbucks has committed to 100 percent renewable energy by joining the
RE100 group and already achieved that goal for its operations in the United States and
Canada.66 In 2019, Starbucks announced that it had entered into VPPAs with three projects,
including 50 MW of wind in Oklahoma, 50 MW of solar in Texas, and 46 MW of solar in North
24 |CENTER ON GLOBAL ENERGY POLICY | COLUMBIA SIPATHE ROLE OF CORPORATE RENEWABLE POWER PURCHASE AGREEMENTS IN SUPPORTING US WIND AND SOLAR DEPLOYMENT
Carolina. In this arrangement, Starbucks contracted for a sufficient portion of the annual
production of these three projects to match the annual loads of 3,000 Starbucks stores.67 The
remaining production was marketed to other buyers.68
Another shared transaction from 2019 included a group of five corporations—Bloomberg, Cox
Enterprises, Gap, Salesforce, and Workday—with an aggregated 42.5 MW annual electricity
load. This group of corporations utilized a single shared legal counsel and jointly signed a
single VPPA, pooling their risk and reducing transaction costs.69
The scalability and replicability of these aggregation deals are still unclear. On one hand,
technological platforms and legal framework innovations that help to aggregate interested
buyers can help corporations with smaller loads to achieve economies of scale in VPPAs. On
the other hand, these aggregations might prove themselves to be problematic and risky for
the companies involved. For example, the risk of default by individual parties could shrink
the pool of possible partners, leading corporations to only partner with well-established
companies with high trustworthiness of continued operations and financial health.
Growth Driver #4: Continued Cost Declines for Wind and Solar
Growth in renewable energy deployment among corporate players has been largely preceded
by drops in both wind and solar system costs. Utility-scale wind energy costs fell by 70 percent,
while solar energy costs fell by 89 percent during the time period between 2009 and 2019,
according to Lazard.70 Additionally, the PTC and investment tax credit (ITC) have been essential
in improving the economics of C&I contracting for renewable electricity.
According to IRENA, the global levelized cost of electricity (LCOE)71 of utility-scale solar PV
is projected to drop further, from $0.055–$0.22 per kWh in 2018 to $0.02–$0.08 per kWh in
2030.72 As for wind, IRENA projects that the global LCOE for onshore systems will drop from
$0.045–$0.10 per kWh in 2018 to $0.03–$0.05 per kWh in 2030. During the same period, IRENA
envisions global offshore wind LCOE decreasing from $0.10–$0.195 to $0.05–$0.09 per kWh.73
It should be noted that potential benefits from further cost reductions will, based on current
law, be offset to some degree by the phaseout of key federal tax credits in the United States.
Historically, the federal ITC and PTC have been key enablers of renewable energy economics.
The ITC has historically equated a tax credit equal to 30 percent of the capital costs of solar
energy assets. The PTC provides an escalating $23 per MWh tax credit for the first 10 years of
electricity generated by wind energy assets.74 These benefits are meaningful and have allowed
wind and solar projects to offer lower VPPA prices than would have been possible in absence
of these credits. The final verdict on the degree to which the loss of tax credits will offset
projected cost declines is still unclear. NextEra Energy, the world’s largest private developer
of wind and solar energy, forecasts that cost declines will fully offset the lost tax credits for
solar energy but not for wind energy. The company projects that the roughly $20 per MWh
levelized benefit of the PTC will be partially offset by about $10 per MWh of efficiency gains
by 2024. For solar, the company estimates the approximately $13 per MWh levelized impact
from the ITC phasedown to be more than offset by about $15 per MWh of efficiency gains.75
Of note is that projects deemed to have “commenced construction” (i.e., spending at least 5
ENERGYPOLICY.COLUMBIA.EDU | MARCH 2021 | 25THE ROLE OF CORPORATE RENEWABLE POWER PURCHASE AGREEMENTS IN SUPPORTING US WIND AND SOLAR DEPLOYMENT
percent of the project’s total capital costs) are able to qualify for the full tax credit level in a
given year so long as the developer completes the project within four years of “safe harbor-
ing” the project.76 This in effect grants developers several years of tax credit eligibility beyond
the formal phaseout schedule. Further, in light of the COVID-19 pandemic, the IRS issued
Notice 2020-41 on May 27, 2020, which granted wind developers an extra year to finish con-
struction work while still receiving the wind PTC per its original phaseout schedule. Table 4
below presents the formal tax credit phaseout schedules as well as the effective phaseout for
developers that take advantage of the safe harbor policy. This table reflects the Consolidated
Appropriations Act, 2021, passed on December 21 2020, which included a one-year extension
of the wind PTC at 60 percent of its original value and a two-year extension of the solar ITC at
a level of 26 percent relative to the previous phaseout schedule.77
Table 4: Scheduled phaseouts of the ITC and PTC
Scheduled phaseout Phaseout with safe harbor
PTC
Year ITC (% of 2.3c / KWh) ITC PTC
2016 30% 100% 30% 100%
2017 30% 80% 30% 100%
2018 30% 60% 30% 100%
2019 30% 40% 30% 100%
2020 26% 60% 30% 100%
2021 26% 60% 30% 100%
2022 26% 0% 30% 80%
2023 22% 0% 30% 40%
2024 10% 0% 26% 60%
2025 10% 0% 26% 60%
2026 10% 0% 26% 0%
2027 10% 0% 22% 0%
Source: McGuireWoods, SEIA, IRS.78
26 |CENTER ON GLOBAL ENERGY POLICY | COLUMBIA SIPAYou can also read