Smart grid governance: An international review of evolving policy issues and innovations - Our Energy Policy
←
→
Page content transcription
If your browser does not render page correctly, please read the page content below
Received: 22 November 2017         Revised: 5 January 2018   Accepted: 8 January 2018
DOI: 10.1002/wene.290

UPDATE

Smart grid governance: An international review of evolving
policy issues and innovations
Marilyn A. Brown | Shan Zhou | Majid Ahmadi

School of Public Policy, Georgia Institute of
Technology, Atlanta, Georgia                            The electric power systems of many industrialized nations are challenged by the
Correspondence                                          need to accommodate distributed renewable generation, increasing demands of a
Marilyn A. Brown, School of Public Policy,              digital society, growing threats to infrastructure security, and concerns over global
Georgia Institute of Technology, 312, D.M. Smith
                                                        climate disruption. The “smart grid”—with a two-way flow of electricity and
Building, 685 Cherry Street, Atlanta, GA 30332-
0345                                                    information between utilities and consumers—can help address these challenges,
E-mail: marilyn.brown@pubpolicy.gatech.edu              but various financial, regulatory, and technical obstacles hinder its rapid deploy-
Funding information                                     ment. An overview of experiences with smart grids policies in pioneering coun-
Brook Byers Institute of Sustainable Systems,           tries shows that many governments have designed interventions to overcome these
Georgia Institute of Technology
                                                        barriers and to facilitate grid modernization. Smart grid policies include a new
                                                        generation of regulations and finance models such as regulatory targets, require-
                                                        ments for data security and privacy, renewable energy credits, and various inter-
                                                        connection tariffs and utility subsidies.
                                                        This article is categorized under:
                                                          Energy Infrastructure > Economics and Policy
                                                          Energy Policy and Planning > Economics and Policy
                                                          Energy Infrastructure > Climate and Environment

                                                        KEYWORDS

                                                        cyber security, grid resilience, policy innovations, policy review, smart grid

1 | INTRODUCTION

The electric grid in most industrialized countries was designed to deliver electricity from large power plants via a high voltage
network to local electric distribution systems that served individual consumers. Both electricity and information flowed predomi-
nantly in one direction, from generation and transmission to distribution systems and consumers. One of the original rationales
for this system design was the assumption that electricity production and supply is a natural monopoly, where a single firm can
produce the total market output at a lower cost than a collection of competing firms. Massive power stations with industrial
boilers, turbines generators, pumping stations, and cooling towers benefited from unbeatable scale economies. But with the
advancement of distributed energy resources (DERs), the information and communication revolution of a digital society, growing
threats to infrastructure security, and concerns over global climate disruption, the current electricity infrastructure needs to be
transformed. By moving toward a “smart grid,” numerous distributed assets can be integrated, aggregators and intermediaries can
add value, and consumers can better manage their electricity consumption so that their “load” enhances grid reliability.
    Smart grid architectures can integrate a diverse set of electricity resources, including central station power plants as well
as distributed renewable resources, energy storage, demand response, energy efficiency, and electric vehicles (Litos Strategic
Communication, 2014). Figure 1 portrays a complex smart grid system with both central and regional controllers managing
the two-way flow of electricity and information between utilities and consumers. The actual mix of controls and technologies
will depend upon a region's transmission and distribution system, its electricity governance and business model, and the
nature of the customers being served. By implementing a smart grid, electric systems can operate at higher levels of power

WIREs Energy Environ. 2018;7:e290.                               wires.wiley.com/energy                      © 2018 Wiley Periodicals, Inc.   1 of 26
https://doi.org/10.1002/wene.290
2 of 26                                                                                                                      BROWN   ET AL.

                                                                                            Industrial plant with
                        Microgrid                                                           combined heat and
                                                                                            power

                                                                                                                      Office
                                                                                                                      buildings

     Wind farm

                                   Energy
                                   storage                                              Distribution
                                                 Transmission                           substation
                                                  substation

                                                                                                        Demand
                                                                                                        response
                   Regional
                   controller                                   Central
                                                                controller

                                                  Regional
                                                  controller

    Conventional                                                     Homes
    power plant                                                                         Energy
                                                                                        storage
                                                                                                                Solar powered
                                                                                                                charging station
                                                                                                                for EVs
              Distributed
              generation                  Solar panels

                                                                             Electric vehicles

FIGURE 1   Smart grid: A vision for the future

quality and system security (The European Smart Grid Task Force, 2010). The efficiency of power delivery can be promoted
by dynamic pricing and smart meters that enable consumers to play an active role in managing their demand for electricity.
Payment systems can be made more efficient with digital communications and can reduce nontechnical losses that undermine
grid economics in many developing countries. Without a smart grid, the full value of individual technologies such as distrib-
uted solar photovoltaics (PV), electric cars, demand-side management, and large central station renewables such as wind and
solar farms cannot be fully realized.
    The electric power industry is experiencing a significant transformation in the way electricity is generated and delivered
throughout the grid. DERs are attracting a growing amount of capital investment and will become more important as con-
sumers and states increasingly value choice, resilience, and clean energy resources (Electricity Advisory Committee, 2017).
For example, in the United States, today:

 • More than 14 million electric customers are supplying power back into the grid, out of the total 160 million electric cus-
   tomers in 2015 (Energy Information Administration, 2017).
 • More than 80 GW of combined heat and power (CHP) generation facilities, accounting for more than 8% of total
   U.S. generating capacity, are operated by commercial and industrial customers in 2016 (U.S. Department of
   Energy, 2016).
 • Distributed solar capacity nearly doubled from 7.3 GW in 2014 to 13.8 GW in February 2017 (Energy Information
   Administration, n.d.).
 • Out of the total 147 million electric customers, more than 9 and 6 million customers participate in incentive-based and time-based
   demand response programs, respectively, in 2014 (EIA, 2017; Federal Energy Regulatory Commission [FERC], 2016a).
 • More than 12 million generators have been installed in the United States, among these 9 million are designed for back-
   up generation. The total generation capacity of these generators was estimated to be over 200 GW in 2007
   (Pentland, 2013).
BROWN ET AL. 3 of 26
• The charging cycles of roughly 542,000 electric vehicles are being managed in 2016, providing yet another DER
(Bhuiyan, 2016).
Additionally, a growing number of utilities are relying on distributed generation or storage to avoid more costly grid
investments (Reilly, 2018). Some are also relying on distributed power electronics, operating on a subcycle basis, to optimize
voltage and reduce generation requirements.
This is a period of significant power system innovation and technology transformation. Still, established T&D systems
remain the backbone of the ability to deliver electricity in most countries. Households, businesses, and other organizations
rely on this essential public service to live, study, produce goods/services and, ultimately, to thrive. Safety, reliability, afford-
ability, and environmental stewardship are still the core principles that guide decisions on electricity generation, transmission,
and delivery. In this era of transformation, these core principles remain guideposts for decision-making, even as the ability to
satisfy them becomes more complex.
The growth of DERs presents opportunities to improve power systems; however, it also introduces key challenges. For
example, ensuring the cybersecurity of the grid has grown more complex given the development of the “Internet of things
(IoT)” and increasingly global supply chains (Cerf, 2017; Sanders, 2017). Further, the notion of reliable service has
expanded to include the importance of a resilient grid, particularly in response to extreme weather conditions and widespread
and sustained outages that are becoming more common with global climate change. Affordability is a constant concern, even
in an era of declining or stable energy prices. For customers, the cost pressures of repairing and replacing aging infrastructure
is coupled with the capital needed to incorporate “smart” technologies and DERs into an existing system while simulta-
neously ensuring the system remains safe, cyber-secure, and reliable.
In this vibrant era, there are countless new business ideas and technologies competing for attention and customer dollars.
Not every new technology or potential resource can or should be adopted. Yet, it is recognized that many DERs can provide
real value to the operation of the electric grid, as well as to customers and to providers themselves. Appropriate valuation of
DERs and the smart grid is a key concern and essential building block for ensuring that they do in fact provide net value to
the system.
Despite their numerous benefits, various obstacles hinder smart grids from gaining rapid and widespread market share. A
wide array of policies have emerged worldwide to overcome these obstacles and protect the public's interest in affordable,
dependable, and clean electric power by promoting the deployment of smart grids.
This paper begins by providing an overview of barriers and concerns that hinder smart grid deployment and the drivers
and motivations that promote it. We then review experiences with smart grid policies in the United States, at both the federal
and state levels. In particular, activities of four states (California, Georgia, New York, and Texas) are examined in detail.
This paper also provides insights into European Union (EU) smart grid policies, with a special focus on the United Kingdom
and Italy. To illustrate the smart grid policies used in other hemispheres, we also describe policy initiatives in China, South
Korea, India, and Japan, and we discuss the unique value proposition for the smart grid in nations with substantial electricity
poverty. Acknowledging that the transition to a smart grid is only beginning, this paper ends with a brief discussion of les-
sons learned and recommended future directions.
2 | BA RR IE RS A N D D RIV ERS IMP AC TING T HE DE PLO Y M EN T O F S M AR T G RI D S
Many smart grid technologies are available today, and their market penetration is accelerating. Nevertheless, the public bene-
fits that could result from deep smart grid deployment are still largely theoretical because the market transformation is still in
an early stage. To accelerate this transition, smart grid policies must address the key barriers that hinder deployment and
leverage the drivers that motivate smart grid investments.
2.1 | Smart grid barriers and concerns
2.1.1 | Financial concerns
Large upfront cost and lack of access to capital is one of the greatest challenges to the deployment of smart grids (U.S.
Department of Energy, 2009). Like many other green technologies, deployment requires significant initial investment, while
the resulting benefits may not be fully realized for many years (Electricity Advisory Committee, 2017). For example, the
Electric Power Research Institute estimates that smart grid investments needed in the United States would cost the average
residential customer $1,000 to $1,500; amortized over a 10-year period, this would cause residential electricity bills to
increase by 8 to 12% (The Electricity Advisory Committee, 2008). Although the benefits could be 3 to 6 times larger than
these costs, such as lower meter reading costs, improved billing processes, reduction of nontechnical losses, enhanced4 of 26 BROWN ET AL.
reliability, improved power quality, increased national productivity and enhanced electricity service, the uncertainty in long-
term benefits, and short-term costs in infrastructure and personnel training may create financial barriers to private sector
investment in smart grid technologies. Without guaranteed cost-recovery timelines or sound business mechanisms to reduce
risks for smart grid investment, utilities, policymakers, and other investors are reluctant to move toward a smart grid (U.S.
Department of Energy, 2009).
2.1.2 | Regulation and market structure
Although electricity market reforms have been pursued in many countries, the utility business model in most modern econo-
mies is typically based upon a negotiated rate-of-return that adequately recovers utilities' capital investments. When their
profits are linked with sales, utilities have a financial incentive to maximize the throughput of electricity across their wires;
hence they are often reluctant to adopt technologies that improve the efficiency of power supply (Natural Resources Defense
Council, 2012). Moreover, rate-of-return regulation requires that utility rates are set to provide a “reasonable” return on
invested capital, and any added investments must be demonstrated to be cost-effective. As many societal benefits associated
with smart grids are not fully rewarded by markets or regulators, utilities that bear all the cost of smart grid investments have
little incentive to invest in these technologies.
From a consumer's perspective, electricity rates generally reflect the average and not the marginal cost of electricity pro-
duction (National Energy Technology Laboratory, 2007a). Without dynamic pricing that reflects the time-dependent cost of
electricity generation, customers are less likely to be interested in smart grid technologies or end-use efficiency (Brown &
Salter, 2010).
Under current policy schemes, smart grid technologies face disadvantages when competing with conventionally regulated
power systems. To ensure system reliability, utilities and regulators often impose strict and discriminating rules on intercon-
nection and DERs. The FERC's November 17, 2016 Notice of Proposed Rulemaking (NOPR) has indicated that market rules
have created undue discrimination against DERs aggregations, and regulatory actions are still needed to eliminate these regu-
latory barriers (Department of Energy and Federal Energy Regulatory Commission, 2016). Incumbent electricity providers,
especially vertically integrated utilities have incentives to discourage the deployment of smart grids in light of their potential
to increase competition in the electricity market. A lack of consistency among policies at different levels of governments,
together with outdated codes and standards has also prevented effective collaboration and integration across regions
(National Energy Technology Laboratory, 2007a).
2.1.3 | Cybersecurity, reliability, and data privacy
Network operators tend to be conservative and risk averse. Widespread and prolonged blackouts are costly and can threaten
political stability in some nation–states. The high-level penetration of DERs on existing infrastructure can threaten system
stability (National Academy of Sciences, 2017; U.S. Department of Energy, 2009, 2017). Developing complex-integrated
systems also places demanding requirements on a wide range of technologies, especially advanced metering infrastructure
(AMI) and energy storage systems (U.S. Department of Energy, 2009). Because the electric grid is an inherently open sys-
tem, changes on the customer side of the meter—such as demand fluctuations and the output of distributed resources—can
disrupt system operations. As a result, grid vulnerability is increasing as more devices connect to the Internet and with
growth in DERs. In addition, many of the technologies that enable the deployment of smart grids, such as smart meters and
sensors, can increase the vulnerability of the grid to cyberattacks (The Electricity Advisory Committee, 2008). As the number
of participants and distributed generators in the electric system increases, so does the complexity of maintaining cybersecu-
rity (National Academy of Sciences, 2017; National Energy Technology Laboratory, 2007b). Recent assaults to the grid com-
bined simultaneous attacks on the power systems and communications infrastructure (e.g., Metcalf, CA; Metcalf Sniper
Attack, n.d.) The virus that caused substations to be disconnected from the grid on December 23, 2015 in the Ivano-
Frankivsk region of Ukraine caused loss of power to 225,000 customers (Lee, Assante, & Conway, 2016). Sources have
reported a cyberattack on Irish power grid (EirGrid) on April 20, 2017, where attackers were able to access routers and ulti-
mately unencrypted communications (McMahon, 2017). There are reports of similar attacks on the Wolf Creek Power plant
near Burlington, Kansas (Walton, 2017).
The potential cost of such attacks is very large—as high as $243B to $1 T (Lloyds, 2015). The use of sensors and devel-
opment of microgrids could reduce the grid's vulnerabilities (National Academy of Sciences, 2012). While it is doubtful that
microgrids by themselves will provide sufficient “firewalls” against cyberattacks, work on the smart grid has helped develop
grid technologies and cybersecurity architecture for the grid (Electricity Advisory Committee (EAC), 2015a).
The tension between protection of consumer privacy and development of the smart grid can challenge privacy protection
rules. It is essential for both customers and smart grid service providers to have access to energy consumption data in order
to optimize the use of smart grid technologies. This can be difficult when incumbent utilities that are currently controllingBROWN ET AL. 5 of 26
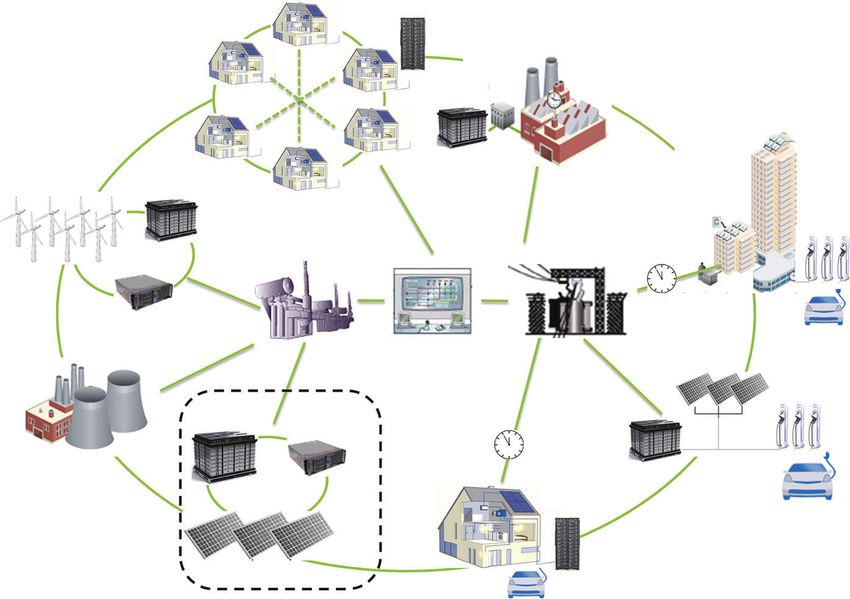
Grid to vehicle (G2V) Vehicle to buildings (V2B) Vehicle to grid (V2G)
Demand Demand Capacity
response charge firming
reduction
Valley Voltage
filling Reserves
control
Negative Negative
demand demand Reserves
response response
Coordinated Emergency Frequency
charging back-up regulation
FIGURE 2 Potential services of electric
vehicles in a smart grid
the meters and data on electricity consumption create barriers to market entry for new smart grid players (Brown &
Salter, 2010).
2.2 | Smart grid drivers and motivations
Over the past few decades, electricity markets and technologies have experienced rapid growth and development, with
increasing focus on reliability. The desire for cleaner air through renewable resources and for oil independence through elec-
tric vehicles also motivates interest in smart grids.
2.2.1 | Increasing electricity demand
Global electricity demand is expected to increase by over 150% by 2050 under the International Energy Agency (IEA)’s
2010 Baseline Scenario (International Energy Agency, 2010). Due to the proliferation of home and office appliances and a
lack of real-time pricing signals, peak demand is expected to increase steadily over time. Between 1982 and 2008, growth in
peak demand for electricity in the United States has exceeded the growth of transmission system infrastructure by almost
25% every year (U.S. Department of Energy, 2008). With the expectation of continued demand growth, rising peak demand
(The Brattle Group, Freeman Sullivan, & Co., 2009), and stress on the transmission system, the Energy Policy Act of 2005
charged DOE to identify National Interest Electric Transmission Corridors (NIETCs). Designation as a NIETC enables
developers to request federal siting authority if transmission projects are denied by state jurisdictions (Venora, 2008). As a
result, transmission investments have increased over the past decade. Looking ahead, rising temperatures could cost
U.S. utilities as much as $180 billion this century due to greater electricity demand (Auffhammer, Baylis, & Hausman,
2017). Smart grid technologies can help reduce demand by enabling demand-side management programs, and can improve
the efficiency of electricity supply through better integration of distributed renewable and energy storage devices.
2.2.2 | Managing electricity reliability
The huge economic and social losses caused by supply failures have stimulated efforts to enhance the reliability of electricity
supply. Smart grid technologies such as phasor measurement units allow utilities to monitor the grid system based on real-
time information, and intelliRupter switches provide real-time telemetry that is sent to utility SCADA systems every 4 s
(National Academy of Sciences, 2016). Such equipment can prevent widespread electric service interruption by shedding
loads and redispatching power, while also exploiting opportunities to insert distributed resources into the grid.
For example, numerous types of ancillary services can be provided by electric vehicles with two-way charging in a smart
grid (Figure 2). Most analysts focus on the potential for electric vechiles (EVs) to decrease dependency on petroleum fuels
and to reduce greenhouse gas (GHG) emissions when charging with nonfossil sources of electricity. In addition, however,
there may be benefits to the grid itself. First, EVs can increase the stability of the grid with coordinated charging (in a grid-
to-vehicle or G2V mode). Second, EVs can strategically return stored electricity to the grid to increase capacity and provide
ancillary services such as frequency regulation and reserve capacity (in a vehicle-to-grid or V2G mode; Kempton &
Letendre, 1997). Finally, EVs plugged into homes, office or businesses (in a vehicle to buildings or V2B mode) can provide
backup and emergency services to consumers and can activate charging in response to the grid's need for end-use consump-
tion when prices are negative.6 of 26 BROWN ET AL.
2.2.3 | Climate change and clean air concerns
Energy-related human activities are a major source of GHG emissions, air pollution, and climate change. As in most industri-
alized countries, the electric power and transportation sectors in the United States are the largest carbon emission sources,
with electric power accounting for 35% of U.S. total emissions in 2016 (EIA, AEO, n.d.). Electricity generation from fossil
fuels also contribute significantly to the emissions of criteria air pollutants and hazardous air pollutants, such as sulfur diox-
ide (SO2), oxides of nitrogen (NOx), particulate matter (PM10 and PM2.5), and mercury. In particular, electric utilities
accounted for 64% of total SO2 emissions, ranking the top among all sectors (Environmental Protection Agency, 2017).
Many countries have set targets for low-carbon and renewable electricity generation to combat climate change and reduce air
pollution, which require extensive changes to the current power systems. Smart grids could help to more fully exploit the
potential of carbon emissions reduction and air quality improvement in energy sectors, as it enables low-carbon distributed
power generation, demand management, and transport systems.
2.2.4 | Deployment of renewable power and electric vehicles
Efforts to combat climate change have encouraged the rapid development of environmentally friendly power generation and
transportation technologies. In 2016, 23.5% of world electricity was generated by renewable energy, and forecasts suggest an
annual growth rate of 3% (Renewables, 2016). This new tranche of renewables is expected to be dominated by wind genera-
tion (National Renewable Energy Laboratory, 2012). The transport sector is also undergoing an electrification revolution,
which could consume 10% of total electricity by 2050 (Energy Technology Perspectives, 2010). As electric vehicles gain
market share, it may become difficult for conventional grid infrastructures to provide reliable and stable electricity services
(Energy Technology Perspectives, 2010). In particular, the intermittency of renewable energy and electric vehicle charging
have to be managed intelligently to avoid supply failures, which provide an excellent opportunity for the deployment of
smart grids.
2.2.5 | Economic development and access to energy
Along with the development and diffusion of smart grid technologies comes the growth of key industries, such as electric
vehicle, smart appliance, and smart meter manufacturers. Their earnings could be redirected to other business investments,
hence improving their competitiveness in both domestic and international markets. Countries pioneering in smart grid
deployment are clearly building competitive advantage for their future economy. In the developing world, smart microgrids
powered by distributed resources hold the promise of delivering electricity to the more than one billion people who do not
currently have access to electricity (International Energy Agency, 2016).
Countries and their subregions and states are in different stages of smart grid deployment and face different barriers and
drivers to change. Across the countries and states, we examine here are carbon footprints that range from 1.6 metric tons of
CO2 per capita in India to 23.1 metric tons of CO2 per capita in Texas. Renewable electricity penetration ranges from 1.6%
in Korea to 43% in Italy. Energy prices vary, as do levels of energy poverty, and the ability of government policies and mar-
ket structures to facilitate technological innovation is equally wide ranging. Within this array of conditions, we compare and
contrast the use of smart grid policies across the United States, EU, and Asia. Table 1 provides some of the key background
statistics that help to explain the smart grid policy landscape.
3 | S M A RT GR ID PO L IC IE S O F T HE UN I T E D S T A T E S
The United States aspires to a low-carbon economy, but its current energy system is carbon intensive. The United States is
second only to China in total energy-related CO2 emissions—at 5,146 million metric tons (Mt) of CO2 in 2015 (U.S. Energy
Information Administration, 2017). On a per capita basis, the United States is also highly carbon intensive—averaging 15.8
metric tons per person in 2015. Its CO2 emissions are down from a peak of 6,016 metric tons in 2007 and from 19.9 metric
tons per capita in the same year, just preceding the 2008 economic downturn (U.S. Energy Information Administration,
2012a). In his 2011 State of the Union address, President Obama proposed a goal of generating 80% of the nation's electric-
ity from clean energy sources by 2035; however, only 15% of its electricity currently comes from renewable sources, com-
pared with 32% in Italy and 20% in Asia (see Table 7 for comparative energy use and carbon emissions data.). In 2017,
President Trump expressed an intent to remove the United States from the Paris Accord on Climate Change, a policy reversal
that will require at least 2 years to complete (Stavins, & J. Meyer Professor of Energy, & Economic Development John
F. Kennedy School of Government, Harvard University, 2017). In the meanwhile, the U.S. Department of Energy recognizes
that a smarter, modernized and expanded electric system is essential to America's world leadership in a clean-energy future
(Executive Office of the President of the United States, 2011).BROWN ET AL. 7 of 26
TABLE 1 Energy consumption, CO2 emissions, and targets, by country and state
Carbon
Energy use CO2 footprint GDP
(quad-rillion emissions Population (mtCO2/ CO2 emission reduction target (billion Renewable
Btu) (MMmt) (millions) Capita) (compared to 2005 level) 2010 $) electricity (%)
USA 97.0 5,146 325 15.83 26–28% by 2025 versus 2005 16,651 15.4
(U.S. Cover Note, INDC and
Accompanying Information.pdf,
2015)
California (Litos Strategic 7.68 358 40 8.97 40% by 2030 versus 1990 2,603 39.8
Communication, 2014) (Subnational Global Climate
Leadership Memorandum of
Understanding, 2015)
Georgia 2.85 140 10 13.59 40% by 2030 versus 2009 525 6.4%
(Atlanta; City of Atlanta
Under 2 MOU Appendix
Profile, 2015)
New York (Litos Strategic 3.72 170 20 8.63 40% by 2030 (NY Under 2 MOU 1,488 24.2
Communication, 2014) Appendix, 2015)
Texas 12.90 642 28 23.01 45% by 2030 versus 2010 (Austin; 1,617 13.4
Under 2 MOU Appendix—City
of Austin, Texas, 2015)
OECD-EU 80.7 3,930 573 6.86 40% by 2030 versus 1990 (Intended 20,321 32.1
Nationally Determined
Contribution of the EU and its
Member States, 2015)
Italy 6.0 319 61 5.27 40% by 2030 versus 1990 1,850 43.4
(Italy Strategies, 2017)
UK 7.2 426 67 6.49 90% by 2050 (United Kingdom 2,619 19.4
Strategies, 2017)
Asia 244.1 16,788 4,034 4.16 24,870 19.7
Japan 19.5 1,140 127 8.97 26% by 2030 versus 2013 6,048 15.0
(Submission of Japan's Intended
Nationally Determined
Contribution (INDC), 2015)
South Korea 12.2 688 50 13.76 37% by 2030 (Submission by the 1,301 1.6
Republic of Korea Intended
Nationally Determined
Contribution, n.d.)
China 136.3 10,010 1,376 7.27 60–65% per unit of GDP by 2030 9,510 23.5
versus 2005 (Department of Climate
Change, National Development, &
Perform Commission of China, 2015)
India 29.8 2,108 1,311 1.61 33–35% by 2030 versus 2005 (India's 2,354 15.0
Intended Nationally Determined
Contribution: Working Towards
Climate Justice, n.d.)
World 580.7 34,095 7,336 4.65 76,796 23.5
Notes. U.S. energy consumption and CO2 emission data for specific U.S. states are for 2014, data are for 2015. All other data are for the year 2016 (USEIA, the State
Energy Data System, n.d.; USEIA, 2017a, 2017b). GDP = gross domestic product.
3.1 | Smart grid legislation and policy context
The Energy Policy Act of 2005 was the first federal law to explicitly promote the development of smart meters. It directed
utility regulators to consider time-based pricing and other forms of demand response for their states. Utilities must provide
each customer a time-based rate schedule and a time-based meter upon customer request.
The Energy Independence and Security Act (EISA) of 2007 authorized the Department of Energy (DOE) to establish the
Federal Smart Grid Task Force to implement and coordinate national smart grid policies. The DOE is also required to estab-
lish smart grid technology research, development, and demonstration projects to leverage existing smart grid deployments.
The National Institute of Standards and Technology (NIST), a major standards developing federal agency, is directed by
ELSA to develop a smart grid interoperability framework that provides protocols and standards for smart grid technologies.
EISA also established a federal smart grid investment matching grant program to reimburse 20% of qualifying smart grid
investments.
The American Recovery and Reinvestment Act of 2009 accelerated the development of smart grid technologies by appro-
priating $4.5 billion for electricity delivery and energy reliability modernization efforts. Utilities and other investors used8 of 26 BROWN ET AL.
stimulus grants to pay up to 50% of the qualifying smart grid investments (Recovery Act: Smart Grid Investment Grant
(SGIG) Program, n.d.).
U.S. federal legislation has also attempted to foster electric vehicles. Currently, the United States has about 16,000 public
EV charging stations (Schoettle & Sivak, 2017) and the number is growing due to recent legislative acts. For instance, the
Fixing America's Surface Transportation (FAST) Act passed in 2015 (CONGRESS.GOV, 2015) facilitates usage of EVs by
creating Alternative Fuel Corridors, which identify near- and long-term need for, and location of, EV charging infrastructure
(Alternative Fuel Corridors, 2017). The Corporate Average Fuel Economy (CAFÉ) standards lead to higher market share for
EVs, perhaps expanding to 29% by 2030 (Sen, Noori, & Tatari, 2017). Moreover, car buyers can take advantage of a federal
tax credit of $7,500 for qualified EVs (Plug-In Electric Drive Vehicle Credit (IRC 30D), 2017). Electric storage participation
in wholesale markets was addressed by the U.S. FERC in November 2016 (FERC, 2016b). This participation can be
achieved by DER aggregation in order to satisfy size and performance requirements as proposed by the California Indepen-
dent System Operator (CAISO). FERC has requested that electricity providers make changes to their existing models such as
reforming their tariffs, to allow direct participation of DER aggregators.
3.1.1 | Data privacy and cyber security
Smart grid relies heavily on the two-way communication of data between utilities and consumers. Data can be stored in a
variety of physical locations in the grid, which raises privacy and security concerns. Some existing federal legislation over-
sees the smart grid-related data privacy and cybersecurity issues, such as the Federal Privacy Act of 1974, the Federal Trade
Commission Act, and the Electronic Communications Privacy Act, the Stored Communications Act, and the Computer Fraud
and Abuse Act. FERC and NIST have the authority to develop smart grid cybersecurity and reliability guidelines and stan-
dards. FERC approved the Critical Infrastructure Protection cybersecurity reliability standards developed by the North Amer-
ican Electric Reliability Corporation (NERC) in 2008 (FERC, 2008). NIST released the Guidelines for Smart Grid
Cybersecurity report in 2014, which can be used by organizations to develop effective cybersecurity strategies tailored to
their smart grid features (Guidelines for Smart Grid Cybersecurity, 2014). In 2015, DOE and the Federal Smart Grid Task
Force developed a Voluntary Code of Conduct that addresses privacy related to data enabled by smart grid technologies.
Finally, an executive order was issued by President Trump in May 2017 that calls for actions to strengthen the nation's cyber-
security (The White House, 2017).
3.2 | State and local efforts
Building on the policy directions set by federal legislation, state and local activities also form an important part of the
nation's overall grid modernization efforts. The scope and pace of smart grid deployments naturally vary according to the
diverse needs, regulatory environments, energy resources, and legacy systems of different states. Decentralized policy efforts
provide local flexibility and stimulate experimentation and innovation in policy design and implementation; thus, it is useful
to examine smart grid policies developed at the state and local level (Brown & Sovacool, 2011). In this section, four
U.S. states are selected for in-depth investigation: California (CA), Georgia (GA), New York (NY), and Texas (TX).
These states have a wide range of carbon footprints, from 9 metric tons of CO2 per capita in New York and California to
14 and 23 metric tons in Georgia and Texas. The penetration of renewable electricity ranks similarly, with only 6 and 13%
renewables in Georgia and Texas, but fully 24 and 40% in New York and California (U.S. Energy Information Administra-
tion, 2012b). Our review suggests that six types of policies are also widely implemented in these two pioneering states: net
metering policies, interconnection standards and rules, smart metering targets, dynamic pricing policies, electric vehicle poli-
cies, and data privacy and cybersecurity policies.
3.2.1 | Net metering policies
Net metering allows customers to use a single meter to measure both the inflow and outflow of electricity, thus enabling
them to install and interconnect their own generators with utility grids. With net metering, customers can use the electricity
generated from their on-site facilities to offset their electricity consumption and sell excess generation to the utility typically
at a retail price, thereby encouraging the deployment of customer-owned distributed energy systems. By allowing utilities to
buy back surplus electricity, net metering helps overcome financial barriers faced by distributed renewable facility owners.
The buy-back price, together with the cumulative generating capacity is determined by utility regulators; therefore, they often
differ across regions (see Table 2). Eligibility criteria are commonly defined by sectors (e.g., residential, commercial, and
industrial), types of renewable resources (e.g., solar, wind, and CHP), and generating capacity (e.g., less that 10 kW or up to
1 MW). Net metering rules are often updated by policy makers to meet the needs and priorities of the market. In general, the
trend is to increase the system capacity cap, as in the cases in New York and Massachusetts and to broaden the eligible
renewable resources (Doris, Busche, & Hockett, 2009). There have been concerns about net metering consumers not payingBROWN ET AL. 9 of 26
TABLE 2 Net metering policies in four U.S. States (DSIRE, 2011)
Qualifying facilities
Eligible technologies System capacity limit Buy-back rate
CA Solar, wind, biogas, fuel cells 1 MW Retail rate
5 MW for specified systems
GA Solar, wind, fuel cells - 10 kW for residential A predetermined rate
- 125% of demand for commercial
NY Wind, solar, fuel cells, micro-CHP, 10 kW—2 MW depending on the - Retail rate (wind, solar, farm waste)
microhydroelectric, farm waste source type and sector - Avoided energy cost (micro-CHP, fuel cell)
TX Renewable energy sources Austin-20 kW–AC Austin, El Paso, Brenham: Avoided energy cost
El Paso-50 kW Others: Retail rate for first 500 KWh, 50% beyond
Brenham-10 MW
Others: No residential, 50 KW for commercial
CHP, combined heat and power.
their part for maintaining grid infrastructure and connection, and that net metering subsidies are unfair for those who do not
own distributed generation resources (Johnson et al., 2017; Lydersen, 2017). Some states (e.g.,. Indiana), with strong advo-
cacy from distribution utilities, have introduced bills to terminate their net metering policies (Indiana General Assembly,
2017). Others are working on new forms of policies and rate designs that encourage distributed renewables and allow distri-
bution utilities to maintain a viable business model (CERES, 2015). For instance, increasing monthly fixed charges on all
customers, monthly service charges for net metering customers, and revising net metering buy-back rates to be based on the
wholesale value of electricity provided by distributed renewables.
3.2.2 | Interconnection standards and rules
Interconnection standards establish uniform processes and technical requirements for utilities when connecting distributed
generation (DG) systems to the electric grid. It allows DER developers to predict costs and time, and ensure the safety and
reliability of interconnection processes. Technical requirements often include protocols and standards that guide how genera-
tors interconnect with the grid, ranging from system capacity limits and qualifying generators, to the types of interconnection
equipment required for reliability purposes. Interconnection policies can also specify connection and operation procedures,
which can reduce uncertainties and prevent time delays for approving grid connections. Interconnection standards are often
designed for certain generation facilities, depending on their generating capacity, sector, and technology type (see Table 3).
3.2.3 | Smart metering targets
A smart meter reader is a device that can measure real-time electricity consumption and communicate the information back
to utilities. A smart meter, on the other hand, communicates back to both the utility and consumer. Smart metering targets
typically establish smart meter deployment plans for utilities, covering the timeline, and the type and number of smart meters
to be installed. Sometimes, utilities are required to conduct cost-benefit analysis (CBA) of the proposed smart metering pro-
grams. Over the last 5 years, many states set smart metering targets that have now been implemented by utilities (see
Table 4). In Georgia, in particular, every customer has a smart meter today. In New York, utilities must file proposals for
integrating smart meters into their systems.
3.2.4 | Dynamic pricing policies
Dynamic pricing is a market-driven approach to boost demand response in electricity markets. The fundamental idea is to
provide accurate price signals to customers and let them decide whether to continue consuming at higher prices or to cut
TABLE 3 Interconnection standards and rules in four U.S. States (DSIRE, 2011)
Main provisions Targeted systems
CA • Standard interconnection, operating, and metering requirements Facilities to be connected to utility's distribution systems and
• Application and evaluation procedures, fees, and costs transmission grid, plus all net metered facilities in utility's
service territory
GA • Customers are required to meet applicable interconnection requirements, Residential (≤ 10 kW) and commercial (≤ 100 kW) facilities
such as the IEEE, Underwriters Laboratories, and the that use photovoltaics (PV), wind and fuel cells
National Electrical Safety Code
NY • Interconnection procedures Simplified six-step process for systems up to 50 kW;
• Requirements for the design and operation of DG facilities 11-step process for systems between 50 kW to 5 MW
• Application procedures, fees, and maximum expenses
TX • Requirements for generators and network interconnection of DG Facilities with capacity ≤10 MW and connection voltage ≤60 kV
• Requirements for control, protection, and safety equipment10 of 26 BROWN ET AL.
TABLE 4 Smart meters in four U.S. States (IEI Report, 2016)
Utility/agency
CA Pacific Gas and Electric 5,209,000
San Diego Gas & Electric 1,428,000
Southern California Edison 5,034,000
GA Georgia Power 4,388,000
NY Public Service Commission 4,100
TX Center Point 2,322,000
Oncer 3,365,000
AEP Texas 1,577,000
electricity usage when prices are high. Some form of dynamic pricing is currently available to most customers, and it is
widely used in commercial and industrial sectors (see Table 4). Research has shown that dynamic pricing can not only
remove subsidies embodied in flat rates, but also reduce peak demand (Faruqui & Hledik, 2009; Faruqui & Sergici, 2009;
Zethmayr & Kilata, 2017). Under dynamic pricing schemes, utilities charge different rates for electricity based on time, gen-
erating cost and conditions of the grid; hence, customers are exposed to some level of electricity price variability. Numerous
different types of dynamic pricing rates have emerged over the past decade, typically starting with large industrial customers,
followed by commercial and large nonresidential customers. The most common dynamic pricing policies include time-of-use
pricing (TOU), critical peak pricing (CPP), and real-time pricing (RTP) (Table 5).
TOU sets and publishes electricity prices for different time periods in advance. Electricity prices in peak periods are
higher than off-peak, which encourages customers to shift electricity consumption to a lower cost period and reduce the peak
demand. The rates for each time block are usually adjusted two or three times each year to reflect changes in the wholesale
market; however, TOU pricing does not address unforeseen weather conditions or equipment failures. It is also unable to
reflect shifting peak hours, which can occur with high levels of variable renewable energy.
CPP is similar in rate structure to TOU pricing, but it adds one more rate that can vary with the wholesale market. Elec-
tricity prices during a limited number of hours of the year, which refer to the “critical peak hours,” rise to levels designed to
recover the full generation cost, while electricity prices during other times are lower than the critical periods. There can be a
number of CPP event days in a year, and utilities usually will notify customers of the events and rates ahead of time.
RTP reflects the hourly or an even smaller time-interval marginal cost of electricity, which can be announced at the
beginning of the time period or in advance. RTP can capture most of the true variation in the wholesale market, but it gives
customers little time to react to price changes (Borenstein, Jaske, & Rosenfeld, 2002). The IoT has enhanced customers' abil-
ity to respond to real-time prices, and has eliminated the conflict between greater advanced price notification and more accu-
rate price signals, expanding the use of RTP (Kempton & Letendre, 1997).
3.2.5 | Electric vehicles policies
Parallel to policy trends at the national scale, many individual states have created a variety of EV incentives including tax
credits and registration fee reductions as well as emissions test deferrals and high-occupancy vehicle (HOV) lane exemptions
(State Efforts to Promote Hybrid and Electronic Vehicles, 2017). These rebates start from $1,000 in Maryland and go up
$6,000 in Colorado (Table 6; State & Federal Incentives, 2017). Some states such as Georgia also impose fees on EVs to
compensate for the loss of gasoline taxes that pay for transportation infrastructure (Kramer, 2017).
TABLE 5 Dynamic pricing policies in four U.S. states
Targeting systems
Types of rates Residential sector Commercial and industrial sectors Agricultural sector Electric vehicles
CA CPP √ √ √ √
RTP √ √
TOU √ √ √ √
GA TOU √ √ √ √
RTP √
NY TOU √ √
RTP √
TX TOU √ a
CPP = critical peak pricing; RTP = real-time pricing; TOU = time-of-use pricing.
a
Discounted rates for EVs from 7 to 2 p.m. the next day on weekdays and anytime on weekends provided by Austin Energy.BROWN ET AL. 11 of 26
TABLE 6 Electric vehicle policies in four U.S. States (State & Federal Incentives, 2017)
State Rebate amount Grant/credit Incentives
CA • Up to $2,500 and $1,500 rebate for the purchase “Disadvantaged community” can receive • Eligibility to use HOV lanes for BEVs and PHEVs
or lease of battery electric vehicles and plug-in up to $5,000 per EV and $2,000 • Discounted rates for residential vehicle charging
hybrid electric vehicles, respectively. per charging station during off-peak hours
Additional $2,000 for vehicles purchased or • Financing programs available to support
leased by qualifying low-income households.a installation of charging station
GA A tax credit for commercial medium/heavy duty • Eligibility to use HOV lanes for BEVs
plug-in electric vehicle (PEV) trucks purchased • Subsidies for Level 3 charging stations
equal to the lesser of the • Exemption for emissions testing for BEVs
income tax liability of the owner or $250,000
NY Up to $2000 rebate for BEV or PHEV Up to $5,000 credit for the installation • Eligibility to use HOV lanes on the Long Island
A $5,000 rebate for EVs expired in 2016 of charging station to certain expressway as well as 10% discount on toll roads
qualified property • Exemption for emissions testing for BEVs
TX Up to $3,500 rebate for purchase of PEVs • Up to $1,500 rebate to qualified businesses • Exemption for emissions testing for BEVs
for qualified buyers for the purchase and installation of
charging stations
• A rebate of up to 50% of the cost to install
a Level 2 charging stations for multifamily
properties
a
PG&E is offering a $500 clean fuel rebate for PG&E customers who own or lease a PEV, and SCE is offering a $450 clean fuel rebate for SCE customers who own
or lease a PEV. HOV = high-occupancy vehicle.
3.2.6 | Data privacy and cybersecurity policies
Many states have adopted policies to regulate smart meter data security and privacy concerns (Zhou & Matisoff, 2016). Such policies
closely regulate who owns smart meter data, who has access to the data, and cybersecurity management rules. For example, California
passed the Senate Bill 674 “Telecommunications: master-metering: data security” in 2011. It requires that an electrical corporation
shall not share, disclose, or otherwise make accessible to any third party a customer's electrical consumption meter data without the
consent of the customer. Texas requires independent security audits of investor owned utilities (IOUs) that deploy AMI (Table 7).
3.2.7 | Other policies
Besides the six types of policies described above, the ownership of renewable energy certificates (RECs) from customer-owned
renewable facilities is another issue that is only now being clarified. The issue is important because RECs have significant economic
value, and clear rules and regulations regarding their ownership could help reduce confusion and uncertainties associated with smart
grid investment. This policy issue is also contentious as it involves the design and consideration of several policy regimes, including
renewable electricity standards, net metering, interconnection policies, and utility subsidies for renewable projects.
In the United States, when renewable energy is generated and fed into the electrical grid, the accompanying RECs can
then be sold on the open market (Reusable Energy Progression, ). There are two types of RECs markets. In compliance mar-
kets, states with Renewable Portfolio Standards require utilities to either generate renewable energy or purchase RECs from
elsewhere to fulfill the renewable portfolio standard (RPS) requirements. In voluntary markets, consumers and corporations
purchase renewable energy out of their own desire.
The four case studies show that the goals and design of smart grid policies are highly variable across states. While most
U.S. states have net metering and interconnection standards, the specifics of these policies vary widely (e.g., eligible technol-
ogies and customers, application, and evaluation procedures). States also are in different stages of smart-meter deployment;
however, there is a growing consensus that smart meters are an essential enabler of grid modernization. Additional policy
principles are emerging. Cost allocation rules need to ensure the recovery of smart grid costs and to facilitate investment in
TABLE 7 Data privacy and cybersecurity policies in four U.S. states as of 2017
State Legislation/regulation/plan Requirements and recommendations
CA • Senate Bill 674 • Prohibit utilities sharing, disclosing, or selling customers' data absent customer authorization
• Senate Bill 1476 • Require utilities to adopt security procedures and practices
GA • None • None
NY • New York PSC Case 10-E-0285 • Defers adoption of interoperability/security standards until the NIST standards are completed
• Not necessary to develop and adopt prescriptive smart grid privacy rules
TX • Texas Energy Assurance Plan 2012 • Recommends identification of threats and vulnerabilities in the energy sector, especially
with regard to grid modernization efforts
• Describes prevention and mitigation strategies applicable to energy emergencies
• PUC Rule §25.130 • Requires independent security audits of IOUs that deploy AMI
Source: State public service commission websites. NIST = National Institute of Standards and Technology.12 of 26 BROWN ET AL.
TABLE 8 Smart grid legislation and regulations in the European Union
Policy emphases
Interconnection Smart Demand Response Electric Data protection
standards meters and dynamic pricing vehicles and cybersecurity
Directive 2001/77/EC √
Directive 2003/54/EC √ √
Green Paper (2005) √ √
Green Paper (2006) √
Directive 2006/32/EC √ √
COM (2007) 723 final √
Directive 2009/72/EC √
Conclusions of the European Council of February 4, 2011 √ √
Commission recommendation on preparations for the √
roll-out of smart metering systems (C/2012/1342)
EC standardization mandate for smart meters (M/441) √
EC standardization mandate for electric vehicles (M/468) √
EC standardization mandate for smart grids (M/490) √
Commission recommendation of October 10, 2014 on the √
data protection impact assessment template for smart
grid and smart metering
Directive 2014/94/EU on the deployment of alternative √
fuels infrastructure
Commission recommendation (2014/724/EU) on the data √
protection impact assessment template for smart grid
and smart metering system
Directive (EU) 2016/1148 concerning measures for a high √
common level of security of network and information
systems across the union
General Data Protection Regulation (EU) 2016/679 √
Notes. We exclude two general policies: Regulation (EU) No 347/2013 on guidelines for trans-European energy infrastructure and the 2008 Directive on European
Critical Infrastructures (2008/114/EC).
new smart grid infrastructures. CBA and evaluation metrics are also becoming essential, and some government agencies are
beginning to require the collection of such information.
4 | S M A RT GR ID PO L IC IE S I N E UR O P E
The EU is the second largest energy market in the world, with a population of 573 million (76% more than the United States)
in 2016.1 The objective of EU energy policies in the 21st century is to achieve a sustainable, competitive, and secure energy
supply (Commission of the European Communities, 2006). The EU consumes approximately 20% less energy than the
United States, and emits about 31% fewer tons of CO2 than the United States.
The deployment of smart grids is an essential part of the EU's climate change and clean energy initiatives, as it can trans-
form traditional electricity markets and networks. The breadth of EU smart grid policies is illustrated in Table 8. Early Direc-
tives (in 2006 and 2012) recommended large-scale smart meter deployment to enhance energy efficiency. Economic
assessments were emphasized in a 2009 Directive, and more recently targets were set: at least 80% of consumers equipped
with smart meters by 2020 (Zhou & Brown, 2017).
Despite these motivating EU policies, the penetration of smart meters across Europe is quite variable. As of 2014, smart
meter penetration rates of most EU member states were below 10%, including the United Kingdom, France, Germany, and
the Netherlands. Sweden, Italy, and Finland have achieved more than 90% smart meter market share, ranking the highest in
the EU (Zhou & Brown, 2017). Here, we look more closely at the United Kingdom and Italy as examples of European coun-
tries with low versus high penetrations of smart meters.
4.1 | Data privacy and cybersecurity policies
Data privacy and cybersecurity policies issues have been particularly critical in European countries. For instance, the Dutch
smart meter mandatory roll out target was adopted only after it improved privacy protection and data security, while Ger-
many has made limited progress in smart meter deployment as the government seeks to adopt stringent technical standardsBROWN ET AL. 13 of 26
and certification rules to ensure smart meter data privacy, security, and interoperability (Zhou & Brown, 2017). Because data
privacy and cybersecurity have played a role in the social acceptance of smart grid technologies, we begin with a description
of this policy context.
In 2012, the European Commission recommended all states to be aware of data protection and security considerations.
These recommendations address a wide range of risks associated with protection of personal data and data security (General
Data Protection Regulation [GDPR], 2012). In 2013, the Smart Grid Task Force (SGTF) published the list of security mea-
sures for smart grid threats for all electricity domains from generation to consumer premises (Smart Grid Task Force EG2,
2013). The list became more comprehensive when it was published in 2014, including regulatory recommendations and a
Data Protection Impact Assessment (DPIA) template addressing a wide range of challenges with clarifying examples (Data
Protection Impact Assessment Template for Smart Grid and Smart Metering systems, 2014). The European Parliament
emphasized legislative implementation guidelines such as the appointment of a central authority, incident reporting, informa-
tion sharing, alignment of activities, and development of security standards in their study on Cybersecurity Strategy for the
Energy Sector (2016). However, challenges still exist such as the need for new European standards, clarification of data pro-
tection in terms of authorization of data usage, and the risks associated with losing dispatch schedules and control over EVs
and appliances (European Commission, 2017).
4.2 | Smart grid policies in Italy
Italy emitted 467 Mt CO2 in 2006, but only 319 Mt CO2 in 2016. Its carbon intensity (at 5.3 metric tons of CO2 per capita)
is now lower than the EU average of 6.9, and much lower than the U.S. average of 15.8. Its modest carbon footprint is
achieved in part by its significant investment in renewable power, which represents 43% of its total electricity generation,
higher than the EU average of 32%. Modernization and expansion of the electricity transmission and distribution networks
has been a critical step in the successful integration of renewables in Italy's energy system (Italian National Renewable
Energy Action Plan (In line with the provisions of Directive 2009/28/EC), 2010).
Efforts at various levels of governments have been made to accelerate energy infrastructure optimization. In 2007, the
European Commission approved the “Renewable Energy Sources and Energy Saving” Program in southern Italian regions
with a budget of €1.6 billion ($2.0 billion US dollars; European Commission, 2007). One priority of this program was to
improve the infrastructure of transmission networks to promote renewable energy and small/microscale cogeneration, which
receives €100 million ($123 million US dollars) from European and Italian state funds (Italian National Renewable Energy
Action Plan, 2010). Within this context, the Italian Ministry of Economic Development and Italy's largest power company—
Enel Distribuzione—together launched a €77 million ($95 million US dollars) “Smart Medium Voltage Networks” project in
southern Italy to make medium voltage distribution networks more favorable to photovoltaic systems with installed capacities
of 100 kW to 1 MW (International Energy Agency, 2011). In addition, the Italian Regulator Authority for Electricity and
Gas has awarded eight tariff-based financial projects on active medium voltage networks, to demonstrate at-scale advanced
network management and automation solutions necessary to integrate DG (Renner, Albu, Elburg, et al., 2011).
Italy has one of the largest and most extensive smart metering programs in the world. In Regulatory Orders in 2006 and
2007, Italian legislators introduced mandatory installation of smart meters for all household and nonhousehold low voltage
customers starting from January 1, 2008, and minimum performance standards for the meters were also provided (Renner
et al., 2011). Italy's smart metering deployment emphasizes distribution system operators and is designed to support the liber-
alization of the energy market and prevent electricity theft. Enel Distribuzione is the major player in Italy's smart meter
deployment. By 2011, Enel had installed smart meters for 32 million customers in its electrical distribution system and pro-
vided advanced services enabled by smart meters, including hourly based tariff system (Enel Distribuzione, 2011a.) Enel will
also install smart meters in its gas distribution grid, and will extend the smart metering system to its distribution grids in
Spain, where 13 million smart meters will be installed between 2010 and 2015 (Enel Distribuzione, 2011b). Besides smart
meters, Enel also launched the E-mobility Italy program in three Italian cities: Rome, Milan, and Pisa in 2008 (Emery, n.d.),
where 400 intelligent electric vehicle recharging stations were built.
To encourage renewable DG, the Italian government guarantees priority access of electricity generated from renewable to
the grid, and provides feed-in tariffs to solar PV. The Fourth Conto Energia (feed-in tariff ) approved by the Ministry for
Economic Development in 2011, provides a differentiated incentive system for solar PV, including a specific expense budget
designed for large PV plants between 2011 and 2012, and pre-established half-yearly expense budgets provided to all PV
plants between 2013 and 2016 (Metering & Smart Energy International, 2015). However, no incentives have been awarded
to PV plants entering into operations after 2016.You can also read