ENERGY: THE NEW NORMAL? - 2006 Aspen Institute Energy Policy Forum Phil Sharp, Chair
←
→
Page content transcription
If your browser does not render page correctly, please read the page content below
ENERGy and ENVIRONMENT Program

     ENERGY:
THE NEW NORMAL?
 2006 Aspen Institute Energy Policy Forum
             Phil Sharp, Chair

         Greg Eyring, Rapporteur
John A. Riggs, Program Executive Director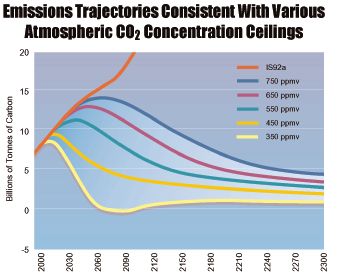
For additional copies of this report, please contact:

                 The Aspen Institute
                 Publications Office
                 109 Houghton Lab Lane
                 P.O. Box 222
                 Queenstown, MD 21658
                 Phone: (410) 820-5326
                 Fax:      (410) 827-9174
                 E-mail: publications@aspeninstitute.org
                 Web:      www.aspeninstitute.org/eee

For all other inquiries, please contact:

                 The Aspen Institute
                 Energy and Environment Program
                 One Dupont Circle, NW
                 Suite 700
                 Washington, DC 20036-1193
                 Phone: (202) 736-5857
                 Fax:      (202) 467-0790

Copyright © 2006 by The Aspen Institute

The Aspen Institute
One Dupont Circle, NW
Suite 700
Washington, DC 20036-1193

Published in the United States of America in 2006
By The Aspen Institute

All rights reserved

Printed in the United States of America

06-021
ISBN: 0-89843-461-0
Table of Contents
Foreword . . . . . . . . . . . . . . . . . . . . . . . . . . . . . . . . . . . . . . . . . . . . . . . . . . . . . .v
Energy: The New Normal?
Growing Demand Will Put Continued Pressure on Supplies . . . . . . .4
Energy Issues Are Critical to
Geopolitics and National Security . . . . . . . . . . . . . . . . . . . . . . . . . 19
Climate Change is Real . . . . . . . . . . . . . . . . . . . . . . . . . . . . . . . . . . . . . 21
Action Items . . . . . . . . . . . . . . . . . . . . . . . . . . . . . . . . . . . . . . . . . . . . . 27
Conclusion . . . . . . . . . . . . . . . . . . . . . . . . . . . . . . . . . . . . . . . . . . . . . . . 38
Appendices
Agenda . . . . . . . . . . . . . . . . . . . . . . . . . . . . . . . . . . . . . . . . . . . . . . . . . . 41
Participants . . . . . . . . . . . . . . . . . . . . . . . . . . . . . . . . . . . . . . . . . . . . . . 45
Selected Aspen Institute Publications . . . . . . . . . . . . . . . . . . . . . . . . . 51Foreword
High energy prices, coupled with intensified fighting in the
Middle East and broader acceptance of the need to act on global
climate change, have suggested to many in the past year that the
world of energy has changed. Others believe that world is still
cyclical, and that what appears to be a new paradigm may just be
the top of another cycle. The 2006 Aspen Energy Policy Forum
considered which is more likely, exploring the question from vari-
ous perspectives: policy drivers such as energy supply and demand,
climate change, and geopolitics; the R&D and financing challenges
of new technologies; demand reduction possibilities; and how var-
ious fuels are likely to fare as utilities make decisions on new gen-
eration capacity.
This 30th annual Forum also broke new ground by bringing to
bear on energy policy considerations more of the thoughtful discus-
sion of values that is central to the Aspen Institute’s mission of fos-
tering enlightened leadership. Small, half-day, readings-based semi-
nars on Values in a Global Village and Business and Social
Responsibility were led by experienced Institute moderators and
focused the attention of Forum participants on some of the difficult
aspects of leadership in today’s world.
The rich dialogue that has characterized the Forum since its
beginning in 1977 is based on interaction among people with diverse
views trained in different disciplines. The multidimensional chal-
vENERGY: THE NEW NORMAL?
lenges of energy policy require crosscutting approaches, and partic-
ipants are challenged to avoid easy responses that draw on a single
area of expertise. A not-for-attribution rule encourages candor and
the exploration of new ideas, and the informal atmosphere and col-
legiality encourage respect for different opinions.
This year’s Forum was chaired by Phil Sharp, President of
Resources for the Future. His extensive experience with energy pol-
icy, anchored in his 14 years as chair of the U.S. House
Subcommittee on Energy and Power, allowed him to bring focus and
perspective to a broad topic. A highly qualified group of session
chairs and speakers provided a wealth of information and con-
tributed substantially to the richness of the dialogue. Their names
are listed in the Forum Agenda that follows.
The Institute’s Energy and Environment Program is grateful for
the generous support of our sponsors. Without their confidence in
our work, this Forum would not be possible. We gratefully recog-
nize and thank the following for their support during the past year.
American Electric Power (AEP) Jerry Geist
Alstom Power Inc. Institute of Gas Technology
American Petroleum Institute NRECA
The Boyd Foundation PEPCO
Cinergy Corp. Sempra Energy
Edison Electric Institute Sierra Pacific Resources
William and Julie Fulkerson Sullivan & Worcester LLP
Thelen Reid & Priest Van Ness Feldman
Greg Eyring served as rapporteur for the Forum, skillfully extract-
ing the major themes and illustrative points from the excellent pre-
sentations and wide-ranging discussions. Katrin Thomas once again
managed the administrative arrangements for the Forum with her
pleasant efficiency.
viFOREWARD
This report is issued under the auspices of the Aspen Institute,
and neither the speakers, nor participants, nor sponsors are respon-
sible for its contents. It is an attempt to represent views expressed
during the Forum, but all views expressed were not unanimous and
participants were not asked to agree to the wording.
John A. Riggs
Executive Director
Energy and Environment Program
viiENERGY:
THE NEW NORMAL?
Greg Eyring
RapporteurEnergy: The New Normal?
The title of the 2006 Energy Policy Forum — Energy: The New
Normal? — raises two primary questions: (1) has the world crossed
a threshold into a qualitatively different energy environment in
which the era of cheap and plentiful energy is over, and (2) does the
interaction of energy issues with other considerations, such as
national security, foreign affairs, and global climate change, require
fundamentally new ways of thinking about U.S. energy policies?
Shortly after the conclusion of the Forum, the nominal price of
oil reached an all-time high—over $76 per barrel—and the U.S.
national average price per gallon of gasoline was over $3. Wholesale
natural gas prices in the United States were above $6 per million Btu,
down from a recent peak of $13 per MBtu in the Fall of 2005 but up
from average levels of $2 per MBtu that had held for more than a
decade prior to 2002. Residential electricity prices also increased
dramatically in most markets in the past year. These energy price
increases were having an effect on Americans’ daily lives—changing
driving habits and reshuffling the budget priorities of many families
and businesses. One recent survey indicated that one out of four res-
idential customers isn’t able to pay monthly utility bills on time.
Consumer anger over these higher energy bills has attracted the
attention of elected officials, and many new proposals addressing
energy issues are being debated in Congress and in state legislatures.
If there is a silver lining in this energy picture, it is that the higher
1ENERGY: THE NEW NORMAL?
prices are stimulating conservation and improved efficiency, invest-
ment in new technologies and new sources of energy supply, and
renewed interest in energy policy.
The history of energy policy in the United States has been one of
alternating periods of crisis and complacency. In the apt summary
of one speaker, periods of complacency are characterized by a pro-
liferation of SUVs, while periods of crisis are characterized by a pro-
liferation of speeches. Skeptics of the ‘new normal’ view will note
that this is the third or fourth energy ‘crisis’ the United States has
experienced in the past 35 years, and that while the real prices of
gasoline, electricity, and natural gas seem high today, they are actu-
ally a smaller fraction of U.S. personal disposable income than they
were in the mid-1970s and early 1980s. Many government energy
initiatives from that period—e.g., to reduce U.S. dependence on for-
eign oil through domestic development of synfuels, and to promote
energy efficiency and renewable energy sources—largely fell by the
wayside as fossil fuel prices dropped back near earlier levels. Indeed,
many long-time Forum participants felt a strong sense of déjà vu as
policy options for addressing energy challenges were discussed.
Countless studies over the past several decades have made the same
recommendations:
• Reduce fossil fuel emissions,
• Deploy non-fossil technologies in utility, industry, commercial,
and residential sectors,
• Reduce the amount of oil used in the transportation sector, and
• Maintain or accelerate the rate of reduction of energy intensi-
ty in the economy.
So, what is really new? The problem is not that we don’t know
what needs to be done or, in most cases, that we lack the appropri-
ate technologies. Rather, the problem is that we have failed to devel-
op a convincing business case for continued technology innovation
in the private sector, and failed to adopt public policies to address
2GROWING DEMAND WILL PUT CONTINUED PRESSURE ON SUPPLIES
the long-term environmental and energy security consequences of
our energy and development choices.
Truly fundamental changes in policy direction tend to come
about as a result of dramatic events in which the public feels a gen-
uine sense of threat or alarm. In the United States, such events have
included the attacks on Pearl Harbor in 1941 and on New York City
and Washington D.C. in September 2001. Forum participants gen-
erally agreed that no comparable sense of public alarm exists regard-
ing energy issues. However, they felt that public concerns about ris-
ing energy prices have led to a ‘teachable moment’—an opportunity
to educate both policymakers and the public regarding three major
factors that, if not fundamentally new, are nevertheless shaping the
landscape of our energy future in potentially threatening ways:
• Increasing demand for energy in developing as well as devel-
oped countries, in a world with increasingly global energy
markets,
• New national security and foreign policy concerns, and
• New urgency of global climate consequences of fossil fuel use.
The Forum participants’ views on the implications of these three
factors are discussed below, followed by a summary of their ideas for
taking action.
3ENERGY: THE NEW NORMAL?
Growing Demand Will Put
Continued Pressure on Supplies
By 2050, the world’s population is projected to grow by about 40
percent to approximately 9 billion—up from 6.5 billion today.
There is expected to be a tripling of the number of people in mega-
cities, each with aspirations for clean water, clean air, utility services,
and transportation.
Figure 1 shows the projected growth in marketed energy in the
developed (OECD) and developing world through 2030. The growth
rate in the developing world is higher, and energy use there begins to
overtake that in the OECD countries after about 2010. This growing
demand is expected to place pressure on sources of supply, lowering
reserve margins and raising energy prices in the long term, though
there may be short-term fluctuations.
World Marketed Energy Use by Region,
450
2003-2030
400
350
OECD
300 Non-OECD
Quadrillion Btu
250
200
150
100
50
0
2003 2010 2015 2020 2025 2030
• Source: EIA, International Energy Outlook 2006
Figure 1. Energy use is projected to increase in both the developed
(OECD) and developing countries through 2030, with energy use in
the developing countries overtaking that in OECD countries after
about 2010.
4GROWING DEMAND WILL PUT CONTINUED PRESSURE ON SUPPLIES
World Marketed Energy Use by Fuel Type,
1980-2030
300 History Projections
33%
250
Oil 27%
200
26%
Quadrillion Btu
38% Coal
150 Share of
World
24% Natural Gas
100
Total
24%
Renewables
50 8% 8%
Nuclear 5%
6%
0
1980 1985 1990 1995 2000 2005 2010 2015 2020 2025 2030
Source: EIA, International Energy Outlook 2006
Figure 2. Oil is projected to remain the dominant fuel through 2030,
though its proportion of the fuel mix is expected to decline, while pro-
portions of coal and natural gas are expected to increase.
World Petroleum Consumption, 2004 and 2030
(million barrels per day)
2004 2030
Other
OECD
Other U.S.
OECD U.S. Transitional Including
Including Economies 17.3% Territories
Territories
24.5% 5.3% 19.8%
21.5%
Emerging
Transitional 5.7% Other Asia
10.4%
Economies
8.5% 3.4%
16.0%
Emerging India 16.7%
Other Asia 6.8% Emerging 10.6%
14.6%
India Non-OPEC Emerging
2.5% 16.4%
China China Non-OPEC
Emerging
Non-Asia
Emerging
Non-Asia
Total = 82.5 Total = 117.8
Source: EIA, World Energy Outlook 2006
Figure 3. World petroleum consumption is projected to increase by
43% from 2004 to 2030. The proportion consumed by the U.S. and other
OECD countries is expected to decline by 9%, while the proportion of
China, India, and other emerging countries in Asia is expected to
increase by 14%.
5ENERGY: THE NEW NORMAL?
U.S. Petroleum Supply, Consumption, and Net Imports,
30
1960-2030 (million barrels per day)
History Projections
25
20
Consumption 62%
Net Imports
15
58%
10
Domestic supply
5
0
1960 1970 1980 1990 2000 2010 2020 2030
Source: EIA, World Energy Outlook 2006
Figure 4. U.S. net oil imports are projected to grow from 58% to 62%
of consumption between 2001 and 2030, while consumption rises by
about 35%.
Vehicle Ownership, 2003
900
800 USA
vehicles per 1,000 people
700
600 Italy Germany
France Canada Japan
500 UK
400
Poland
300 Israel
Malaysia Korea
Russia
200 Mexico
Brazil
100 Thailand
Indonesia
0 China
India
0 5000 10000 15000 20000 25000 30000 35000 40000
GDP per capita (dollars)
Source: EIA, World Energy Outlook 2006
Figure 5. The rate of vehicle ownership in the developing world lags
that in OECD countries by a wide margin, but is poised to grow dra-
matically as these developing economies expand and incomes rise.
6GROWING DEMAND WILL PUT CONTINUED PRESSURE ON SUPPLIES
What fuels will be used to power this growth? Figure 2 shows the
historical and projected growth in world marketed energy use by fuel
type from 1980 to 2030. All fuels show usage increases in absolute
terms over this period, but their proportions in the mix change some-
what, with the share of oil projected to decrease, while the shares of
coal and natural gas increase slightly. Not pictured in Figure 2 is the
amount of energy consumption avoided by increased conservation
and energy efficiency, but this is expected to be an important compo-
nent of the future energy picture as well. Supply and demand issues for
these various energy components are discussed in greater detail below.
Oil
The United States is the world’s largest consumer of oil, account-
ing for 22 percent of total world consumption, or about 20 million
barrels per day. Figure 3 shows that by 2030, world consumption of
oil is expected to grow by 43 percent. The U.S. will still be the largest
single consumer, but with a somewhat smaller overall share of the
total. As shown in Figure 4, the U.S. produces less than half of its
petroleum needs, and must import the balance. The gap between
U.S. production and consumption is expected to grow slowly
through 2030. Meanwhile, a growing view on the supply side is that
the production of cheaper conventional oils may be close to peaking,
and that future demand growth will be met by exploiting more dif-
ficult-to-get, difficult-to-process, more costly, and more polluting
unconventional oil, e.g. that derived from oil sands or shale.
Transportation (air, marine, rail, and ground) accounts for two-
thirds of the 20 million barrels of oil consumed by the U.S. each day.
Cars and light trucks alone account for about 9 million barrels per
day. Every day, the world’s auto industries produce 160,000 new
cars, and by 2050 the total number of vehicles on the world’s roads
is projected to rise to about 2 billion, with huge consequences for
environmental quality and fuel supplies. Rising incomes in the
developing world will be responsible for much of this increase.
Figure 5 shows the number of vehicles per thousand people in vari-
ous countries around the world in 2003. The United States tops the
list with about 800 vehicles per 1000 people, while some of the most
7ENERGY: THE NEW NORMAL? populous nations such as China, India, and Indonesia average only 50, but are poised for enormous growth as their economies develop. Increased fuel efficiency, low emissions, alternative fuels, and new technologies such as hybrids will be critical in limiting growth in oil demand while maintaining environmental quality. Natural Gas As with oil, natural gas usage is expected to show significant worldwide growth in the future. Current consumption of natural gas in OECD countries is around 50 trillion cubic feet (Tcf) per year, and this is projected to increase to about 70 Tcf by 2030. Natural gas usage in developing countries is expected to grow even faster, from about 50 Tcf currently to over 100 Tcf by 2030. With the limited number of international pipelines and limited shipments of lique- fied natural gas (LNG), many natural gas markets are more local or regional than markets for petroleum, but they are expected to become more global as more LNG shipping infrastructure is built worldwide. In the United States and Canada, LNG imports are expected to increase by a factor of five over the next 20 years, albeit from a low base. In the United States, tight margins between supply and demand for natural gas, the high price of oil, interruption of production caused by hurricane Katrina, and seasonal increases in demand have all driven natural gas prices up from 1990 levels of around $2 per MBtu to above $6 per MBtu, though with significant volatility. In the medium to long term, growth in LNG shipments is expected to create a world-wide market for natural gas and may bring U.S. prices down into the $4-5 per MBtu range. Electricity generation is the fastest growing use of natural gas. During the 1990s, when natural gas prices were around $2 per MBtu, natural gas began to replace coal as the choice for new gener- ating capacity in the United States. Between 1999 and 2004 there was a spike in construction of new gas-fired capacity, with over 200 GW of new capacity added (one-third peaking capacity, two-thirds base load). In general, gas-fired plants have lower capital costs, shorter 8
GROWING DEMAND WILL PUT CONTINUED PRESSURE ON SUPPLIES

construction times, lower water, land, and infrastructure require-
ments, and lower emissions than coal plants.

   If combined heat and power (CHP) designs are used, thermal
efficiencies are typically 75% compared with 49% for a turbine-only
plant. However, with natural gas prices currently in the $6 range,
gas-fired plants are generally less competitive, and some of the newly
built capacity has a very low utilization rate. In restructured markets,
electricity prices are tracking the higher gas prices. This is creating
an incentive for new non-gas-fired plants, especially in parts of the
U.S. where coal-fired power plants can be sited.

Coal
   As shown in Figure 2, worldwide use of coal is projected to
increase steadily through 2030. In 2005 alone, China brought on
line about 70,000 MW of new generation capacity, nearly equal to
the total capacity of the United Kingdom; about 50,000 MW of that
new capacity is coal-fired. Coal markets are more national or
regional than those for natural gas and oil. In the United States, coal
accounts for about half of electricity generation, and the fact that
there are huge domestic resources makes it an attractive fuel from an
energy security perspective. However, coal is the most carbon-
intensive fuel, and a major uncertainty associated with the future use
of coal is the extent to which emissions of carbon dioxide will be
constrained by policies to limit global climate change. These poli-
cies could make coal use significantly more expensive, but under
most plausible scenarios, global coal use continues to grow.

   The most likely technology for using coal depends on one’s
assumptions about future climate change policy. As long as the U.S.
continues with no cost assigned to carbon dioxide emissions, the
most economical and reliable choice is a supercritical pulverized
coal plant. However, if the world aims to stabilize the atmospheric
concentration of CO2 at 550 parts per million, the level at which
many scientists believe dangerous human interference in the climate
system will occur, the cumulative amount of CO2 that can be emit-
ted to the atmosphere is about 2,500 gigatons over a couple of cen-

                                                                            9
ENERGY: THE NEW NORMAL?
turies. Currently, about 25 gigatons are emitted per year, which is
expected to about double by mid-century in “business-as-usual”
(BAU) projections. In a BAU scenario generated by the MIT
Emissions Prediction and Policy Analysis (EPPA) model, coal uses
up 40% of this cumulative carbon budget by 2050; if 450 ppm is the
target concentration, then coal uses up the entire budget by 2050 in
the BAU scenario. A significant pricing of CO2 emissions is needed
to change the overall emissions trajectory sufficiently to meet the
concentration targets. Only if we are able to capture and sequester a
large fraction of the carbon released will the world be able to con-
tinue burning large amounts of coal in the presence of stringent CO2
emissions constraints.
If carbon capture and storage is eventually required, integrated
gasification combined cycle (IGCC) may be best technology for gen-
erating electricity from coal. However, pulverized coal plants, gasifica-
tion plants, and other advanced concepts not currently deployed are
all expected to improve performance and economics appreciably with
more RD&D, and it is likely that multiple coal technologies will be
deployed (e.g., optimized for different rank coals). In IGCC, coal is
converted to synthesis gas (carbon monoxide and hydrogen), which is
then cleaned of impurities and burned in a combined cycle. In
February 2003, President Bush announced the FutureGen initiative, a
$1 billion, 10-year project to develop the first zero-emissions fossil fuel
plant, based on IGCC technology with carbon capture. Such advanced
plants will not be cheap, and will present operational challenges, since
they will require system integration of diverse technologies—the
front-end gasification unit is essentially a chemical plant, combined
with a power island and a back end sequestration program. Given the
efficiency gains and improved cleanup technologies for advanced pul-
verized coal plants, IGCC is likely to be deployed at large scale only if
CO2 emissions bear a significant cost.
Today, the science, infrastructure, and regulatory regime for
large-scale carbon storage have not yet been developed adequately.
A 1,000 MW coal plant capturing 90% of its carbon would require
100,000 barrels of supercritical CO2 injected into the ground each
day, or more than 1.5 billion barrels over a 50 year lifetime.
10GROWING DEMAND WILL PUT CONTINUED PRESSURE ON SUPPLIES
Hundreds of such efforts would be required to dramatically reduce
overall CO2 emissions to the atmosphere. We have not yet grappled
with this kind of scale in our thinking. One Forum speaker suggest-
ed that to demonstrate the feasibility of this approach, approximate-
ly 10 demonstration sites would be needed worldwide, with perhaps
3 in the United States. Each demonstration site would handle one to
several million tons per year and would have appropriate monitor-
ing and verification capabilities. The difficulty is not so much the
expense—perhaps $25 million per year to run each facility—but the
logistical and public acceptance considerations. Operation for per-
haps 10-15 years would be required to resolve issues and demon-
strate the approach adequately.
Because CO2 is a global problem, the U.S. should be developing
these technologies in a global partnership to address monitoring,
verification, insurance of risk, etc. Within the U.S., EPA may be the
appropriate lead agency for implementing the program, but given
the international context, it should be a multi-agency effort to
design the framework.
Renewables
Renewable energy such as hydro, solar, wind, biomass, and geot-
hermal is projected to be only about 8 percent of world marketed
energy use in 2030, about the same fraction as today. Renewable
resources are the most local/regional of the various energy sources
from a market perspective, and most have the potential for low or zero
carbon emissions. They are therefore attractive from both an energy
security and a climate change perspective. Except for hydro, which
offers few remaining prime sites, and geothermal, which is geograph-
ically limited, renewables currently are typically more expensive and
can generally only compete with more conventional fuels with the
help of dedicated subsidies and policies that are friendly to the inte-
gration of distributed power sources into the electricity grid.
Different types of renewables can be used for electricity genera-
tion, heating and cooling of buildings, and transportation fuels. In
surveys of electric utility customers, renewables tend to have a very
11ENERGY: THE NEW NORMAL?
high favorability rating (over 90 percent). In the Energy Policy Act
of 2005 (EPACT), Congress set a Renewable Fuels Standard requir-
ing that increasing amounts of renewable fuels be blended into gaso-
line, and legislation requiring a minimum amount of renewable
energy in utility generation portfolios has come close to passage in
the past several years. Similar legislation has passed in several states,
and an initiative with this provision passed in Colorado.
Interestingly, the Colorado initiative passed everywhere but in the
rural areas most likely to be the sites of the renewable projects, sug-
gesting that the NIMBY (Not In My Back Yard) syndrome applies to
renewable projects as well as fossil fuel projects.
One characteristic shared by many renewable technologies is that
the resource often exists far away from major population centers;
e.g., the most efficient locations for wind turbines are often remote
plains or mountain passes or offshore waters, and biomass resources
are generally in rural areas far from major cities. Thus, bringing the
power or fuel from the source to major markets is a challenge.
Integration strategies are needed. For example, building dedicated
transmission lines from a wind generation site to a faraway city
rarely makes economic sense; however, building a spur from a wind
site to a transmission line that can be shared with a conventional
power plant may be a viable strategy.
One of the most popular renewable technologies, from the point
of view of private investors, agricultural interests, and policymakers,
is the production of ethanol. Today, the process converts the sugars
in corn to ethanol, but from a life cycle point of view this process
wastes much of the energy inherent in corn production and can only
be sustained economically with extensive government subsidies and
tariffs on imported fuel ethanol. In the future, ethanol could be gen-
erated enzymatically from cheaper and more plentiful cellulosic
feedstocks such as switchgrass and agricultural and forest product
wastes. Some advocates believe that ethanol produced from corn
and cellulose in the long term has the potential to displace half of the
gasoline used in transportation fuels, and hence reduce U.S. depen-
dence on imported oil. When mixed with gasoline at a level of 10
percent, ethanol provides a source of oxygen that reduces emissions
12GROWING DEMAND WILL PUT CONTINUED PRESSURE ON SUPPLIES
with no adverse impact on engine performance. A mixture of 85
percent ethanol with gasoline (E85) displaces more gasoline, but dri-
ving range on a tank of fuel is reduced since ethanol has only about
two-thirds the energy content of gasoline. Flexible-fuel vehicles that
can run on gasoline, E85, or any blend in between are currently
being sold by several manufacturers.
Another potential use of biomass would be as a direct fuel substi-
tute for coal in electricity production. This would be a more ener-
gy-efficient use of the biomass, since a large fraction of the energy
present in the original biomass is lost in the conversion to liquid
fuels for transportation. Assuming no significant amount of fossil
fuels were used in the production or transportation of the biomass,
and no carbon ‘sinks’ were destroyed in its production, its use could
be nearly carbon-neutral, and by displacing coal, it could greatly
reduce carbon emissions that would otherwise result.
Nuclear
Figure 2 shows that nuclear energy is expected to remain a rough-
ly constant 5-6% of the world energy market through 2030.
Currently, 103 plants are operating in the U.S. at average capacity lev-
els near 90%, up from 70% in the 1980s. Nuclear energy currently
supplies about 20% of U.S. electricity demand, but no new generating
plants have been ordered in the past 20 years due to a number of fac-
tors: high initial cost, safety and environmental concerns about pos-
sible leaks or releases of radioactive material, proliferation concerns,
and concerns about the transportation and long-term storage of
radioactive wastes. Nevertheless, because a number of recent techni-
cal, economic, and policy developments have come together, there is
new interest in nuclear power. One year ago, only two companies were
developing applications for new reactors before the Nuclear
Regulatory Commission (NRC); now, 11 companies or consortia are
developing 22 applications, largely in response to higher gas prices
and incentives enacted in the Energy Policy Act (EPACT) of 2005.
The industry is now technologically mature, with stable, stan-
dardized and NRC-certified plant designs. Lessons have been
13ENERGY: THE NEW NORMAL? learned from overseas nuclear construction projects, especially the importance of using of modular construction methods. The regu- latory approval process has been streamlined, and opportunities for citizens to intervene in the process have been limited to a few well- defined points. EPACT provided an investment stimulus for a lim- ited number of new nuclear plants, including loan guarantees, tax credits, and risk coverage for delays resulting from licensing or liti- gation. This investment stimulus is estimated by some to make nuclear a lower cost solution for new generation capacity than pul- verized coal, IGCC with carbon capture and storage, or natural gas combined cycle power plants. Finally, as concerns have risen about emissions of carbon dioxide from the electricity sector and their contribution to global climate change, nuclear plants are receiving renewed attention as carbon-free energy sources. The worldwide expansion of nuclear energy is prompting renewed interest in the advanced fuel recycling technologies. The PUREX process, used in Europe, produces a stream of plutonium at the end that can be converted into fissile material for nuclear weapons. Research is underway on a new process in which the plu- tonium is bonded with an actinide to make it unusable in nuclear weapons. New reactors would have to be designed to burn this plu- tonium/actinide fuel. In the view of one speaker, development of these new reactors and reprocessing technologies may require $50 billion over 40 years, but would result in a much smaller volume of waste requiring long-term storage. Other Forum participants were skeptical of the need for and desirability of accepting the cost and proliferation risk of reprocessing. After 20 years of scientific study and an investment of $6-7 bil- lion, in 2002 the U.S. Secretary of Energy deemed Yucca Mountain, Nevada to be a suitable long-term repository for nuclear waste. A license application is expected in 2008, but political opposition makes final approval uncertain. The nuclear industry used to have a ‘Yucca or bust’ mentality, but new proposals are being floated for interim regional storage sites. One speaker suggested that technolo- gy development activities revolving around fuel reprocessing might be co-located with these interim storage sites. 14
GROWING DEMAND WILL PUT CONTINUED PRESSURE ON SUPPLIES

Conservation and Energy Efficiency
   Energy conservation and more efficient use of energy can be con-
sidered as new ‘sources’ of energy. According to one estimate, con-
servation and energy efficiency improvements since 1973 have
reduced annual U.S. energy consumption by 43 quads (~30%),
avoided 2.5 billion tons of annual CO2 emissions, and saved rough-
ly $400 billion in energy expenditures each year. However, in the
United States, efficiency gains in such areas as automobile propul-
sion and building heating and cooling systems have been offset by
increased automotive power and size, and larger living spaces with
more electronic amenities. Average fuel economy of the U.S light
duty vehicle fleet peaked in 1986 and has declined slightly since,
while cars have become heavier, faster, and more powerful. On aver-
age, houses being built today are 30% more efficient than they were
in 1980, but they are also 26% bigger. Worldwide, increasing popu-
lation and rising incomes have meant that energy demand continues
to rise despite improved efficiency.

   The main reason current high oil and gas prices have not yet
caused severe inflation and economic hardship in the United States
is that the energy intensity of the U.S. economy is only about half
what it was in the 1970s. Yet despite these improvements, there
remain tremendous opportunities for reducing energy demand
through conservation and improved energy efficiency. Some of the
most significant opportunities are discussed below.

   In the transportation sector there appear to be a number of routes
to improved energy efficiency, reduced consumption of fossil fuels,
and reduced emissions of carbon dioxide. In addition to the use of
cellulosic ethanol fuel mentioned above, a major opportunity is
hybridization of the vehicle power plant, in which an electrical stor-
age device such as a battery or high-volume capacitor is combined
with an efficient internal combustion engine capable of running on
a variety of fuels. Recent increases in gasoline prices have stimulat-
ed renewed consumer interest in hybrids, and companies such as
Toyota are betting that hybrids are a big part of the automotive
future. In the near term, the hybrid power plant could be a highly

                                                                          15
ENERGY: THE NEW NORMAL? efficient gasoline or diesel engine; in the longer term, this could be replaced by a hydrogen fuel cell. Forum participants were particu- larly enthusiastic about synergies that are possible between the transportation and electric utility sectors via ‘plug-in’ hybrids that would feature large batteries that could be charged at night during off-peak hours. Commercial retail spaces offer further opportunities for energy efficiency. Wal-Mart, for example, with 4,000 stores in the U.S., is the single-largest corporate user of electricity, about 1% of the total. Wal-Mart has initiated an aggressive program to promote energy efficiency in its stores, including: high tech skylights that ‘harvest daylight’ to reduce lighting needs; white roofs that reflect sunlight; reclaiming waste heat from the refrigeration system to provide hot water; and installing high-efficiency HVAC systems. Overall perfor- mance of systems in individual stores is monitored and assessed by sensors connected to a computer system at corporate headquarters. The goal is to reduce energy use in existing stores by 20% in the next seven years, and 30% in a new prototype store within 4 years. Key strategies for the future include installation of interior LED lighting, which Wal-Mart believes will transform the industry, and addition- al doors on refrigerated cases to reduce heat loss. Wal-Mart finds that investments in energy efficiency projects typically have a one- to two-year payback period, and it shares its energy efficiency strategies with competitors and suppliers as part of a long-term strategy for competitive advantage and boosting customer good will. Energy costs for buildings of all kinds in the United States are about $93 billion per year (about 75% of this is for electricity), and building energy use is responsible for nearly 30% of greenhouse gas (GHG) emissions nationally. Recent studies have concluded that a range of new technologies could reduce building energy use by 25- 30%, but that 10-20% reductions may be achievable through demand side management programs, daylight dimming, more effi- cient HVAC systems, efficient glazing, etc. Energy efficient buildings have improved life cycle cost, increased resale value, and increased health and safety of occupants. 16
GROWING DEMAND WILL PUT CONTINUED PRESSURE ON SUPPLIES

   Utilities also have an important role to play in promoting energy
efficiency. New approaches are needed to internalize environmental
costs in economic decisions. Regulatory incentives need to be
aligned with goals. If utilities are rewarded for investment in plant
and receive more revenues with higher sales, why would we expect
them to invest in efficiency? The rewards need to come from pro-
viding energy services to customers, not just more energy. There is
also a need for utilities to conduct more regional planning. These
changes represent major shifts in culture that will not come easily.

   Energy efficiency leaders from utilities, businesses, government,
and environmental groups have come together to produce a
National Action Plan for Energy Efficiency. According to a report to
the Forum on this effort, these leaders have committed to carry the
message back to their sponsoring organizations and to measure and
report back on progress in changing behaviors and cultures in what
was described as a “push me/ pull you” approach.

  It is widely accepted that investing in energy efficiency is much
cheaper on the margin than investing in new capacity. According to
one energy efficiency study, the U.S. could save 19% of total energy use
by 2020, essentially flattening out the energy demand growth curve.
Energy efficiency isn’t the only option, but it should be the first one.

   Given the benefits associated with energy efficiency, especially the
financial savings, why haven’t more companies and individuals taken
greater advantage of these opportunities? Many reasons were offered:

  • Energy efficiency is often not viewed as ‘sexy;’

  • Cuts in energy efficiency programs at the Federal level have
    reduced efforts;

  • Discrete actions are often required by many individuals to
    achieve energy efficiency goals, and each action requires that
    inertia be overcome;

  • Companies may not be vertically integrated enough or of suf-
    ficient size (a la Wal-Mart) to capture the savings—e.g., they

                                                                           17
ENERGY: THE NEW NORMAL?
may not own their own buildings and so may not have incen-
tive to invest in efficient HVAC and lighting systems;
• Constraints exist on investment flexibility due to tension
between capital and operating budgets.
The following are some ways suggested by Forum participants in
which governments and organizations can promote energy efficiency:
• Uniformity of building codes and standards across states, with
regular updating;
• Incentives such as ‘green’ tax credits;
• Replicability of energy efficiency guidelines and best practices;
• Recognition in the marketplace, e.g., Leadership in Environmental
Design (LEED) approval;
• Collaboration with the Federal government; States are leading
in the energy efficiency area, but need to be supported by
national policies.
Providing consumers with information through technologies
such as real-time metering of electricity can be an effective strategy,
as can programmable heating and cooling equipment controlled by
signals over the Internet. Marketing strategies in which utilities or
retailers give away initial energy efficiency items (e.g., compact fluo-
rescent lights) to gain consumer familiarity and confidence have
proven effective. And, of course, continued high prices for energy
are a critical catalyst for action.
18ENERGY ISSUES ARE CRITICAL TO GEOPOLITICS AND NATIONAL SECURITY
Energy Issues Are Critical to Geopolitics
and National Security
Access to affordable energy supplies has been a critical need of
both developed and developing nations in the past. In today’s world,
countries with an excess of energy resources are emboldened to
assert their will in international affairs, while countries that must
import energy may be pressured to alter their policies in pursuit of
energy security. The nexus between energy and the proliferation of
weapons, especially nuclear weapons, is another troubling way in
which energy influences national security and world affairs.
The use of energy resources to gain leverage in international rela-
tions is not new; the 1973-74 Arab Oil Embargo against supporters of
Israel was an early example. Today, the dependence of the U.S. and
its allies on foreign sources of oil and gas continues to limit their free-
dom of action and puts them in the awkward position of trying to
balance the desire for energy security against other foreign policy
goals. Western Europe and Ukraine need Russian gas. Italy buys
energy from Libya and Algeria. India wants a gas pipeline from Iran.
Japan and Korea are heavily dependent on the Middle East. And U.S.
friends in Latin America are being pressured by Venezuela’s Hugo
Chavez. China’s growing relationships with Iran, Sudan, and
Venezuela are examples. Alliances of convenience between buyers
and sellers can evolve into groups that are hostile to international
norms and could influence international politics—e.g., U.N. Security
Council votes on totally unrelated issues.
Many countries that are rich in energy resources are prone to cor-
ruption, are autocratic, and repress political dissent in the name of
stability. If the U.S. associates with these countries to obtain energy
supplies, it risks alienating the oppressed population and undermin-
ing its credibility on other foreign policy goals, such as the promo-
tion of democracy and human rights. If it distances itself, the gov-
ernments make decisions that are costly to U.S. interests.
The dependence of many countries on oil from the Middle East
raises national security concerns that go beyond the threat of dis-
19ENERGY: THE NEW NORMAL? ruption of oil supplies. Inevitably, some of the petrodollars flowing to governments in the Middle East make their way into the hands of radical Islamist groups such as al Qaeda, leading to the feeling that the U.S. and its allies are “paying for both sides” of the war against these groups. Other oil and gas revenues fund other undesirable actions. As one speaker pithily noted, countries that have energy but believe they need more weapons and countries that have weapons but not enough energy have business to discuss. In the United States, the electric power sector depends primarily on domestic fuels, and so is not as vulnerable as the transportation system to sup- ply disruptions from abroad; however, the electric power distribu- tion system is vulnerable to terrorist attacks, and massive and sus- tained outages could result if strategic points were targeted. Finally, nuclear power may be making a comeback globally due to increasing demands for energy and the fact that it is a carbon-free energy source. Unfortunately, the line between civilian nuclear ener- gy programs and military nuclear weapon programs is difficult to discern and enforce, as illustrated by current concerns about Iran’s nuclear intentions. Yet the scope of actions available to discourage Iran’s nuclear ambitions are limited by Iran’s position as a major energy supplier. It also doesn’t help that the international nuclear nonproliferation regime is under siege. As more and more countries seek to develop nuclear power, there is a greater and greater risk that dangerous nuclear materials will fall into the hands of terrorist groups. New international institutions and strategies will be needed to manage these risks. All of these examples suggest that the geopolitics of energy is becoming more complex and requires more careful attention than in the past. 20
CLIMATE CHANGE IS REAL
Climate Change Is Real
It is now almost universally accepted among climate scientists
that human-caused emissions of greenhouse gases are having an
impact on global temperatures, weather patterns, and ecosystems.
What is less widely appreciated is the magnitude of the challenge of
stabilizing those emissions at levels that are not catastrophic to the
global life support systems upon which we all depend. The challenge
is particularly acute when viewed in the context of rising projected
world population, incomes, and demand for energy.
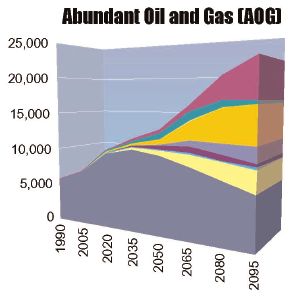
The dominant atmospheric gas causing global climate effects is
CO2.1 Figure 6 shows the atmospheric concentrations of CO2 during
the past 400,000 years. The record shows that there have been oscil-
lating increases and decreases in atmospheric CO2 with a period of
about 100,000 years and with a range from 182-300 parts per million
(ppm). With the dawning of the industrial era around 1750, these
concentrations began to climb due to the burning of coal and other
fuels to meet growing energy demand. In 1959, the world average
concentration of CO2 was measured at 316 ppm, and in 2004 the
annual average was 377 ppm (red line in Figure 6). With still-growing
emissions and the long-lived nature of greenhouse gases in the atmos-
phere, the outlook is for much higher concentrations in the future.
By far, the greatest contributor to net GHG emissions is fossil fuel
use, with smaller contributions from changes in land use (deforestation
and soil cultivation) and industrial process emissions. In 2002 nearly 7
teragrams of carbon were emitted to the atmosphere from fossil fuel
use. Oil was the dominant contributor, followed by coal and natural gas.
The United States, which consumes around 20% of the world’s energy,
also produces around 20% of the world’s CO2 emissions.
Figure 7 illustrates the long-term challenge of stabilizing atmos-
pheric CO2 concentrations at various levels. The orange line repre-
sents a reference case that itself includes the introduction of many new
energy and emissions mitigation technologies. Still, CO2 is not stabi-
1. Other gases, such as methane, chlorofluorocarbons, and nitrous oxides, also contribute. For sim-
plicity, the contributions of these other gases are converted to CO2 equivalents in this discussion.
2122
Figure 6. CO2 concen-
trations in the atmos-
400,000 Years of CO2 Concentrations phere have fluctuated
over the past 400,000
years, but are currently
25% higher than they
reached in any previous
ENERGY: THE NEW NORMAL?
peak.
Source: Jae Edmonds, Pacific
Northwest National
Laboratory's Joint Global
Change Research Institute at
the University of Maryland.Figure 7. It is cumula-
tive global emissions
that matter, not annual
emissions. Stabilization
of greenhouse gas con-
centrations is the goal of
the 1992 Framework
Convention on Climate
Change. All CO2 counts
equally, regardless of
nation or sector of ori-
gin. Achieving lower
concentrations requires
starting emissions
reductions sooner.
Source: Jae Edmonds, Pacific
Northwest National
Laboratory's Joint Global
Change Research Institute at
the University of Maryland
23
CLIMATE CHANGE IS REALENERGY: THE NEW NORMAL?
Abundant Oil and Gas (AOG)
Source: EIA, World Energy Outlook 2006
Figure 8. U.S. net oil imports in the absence of resource scarcity are
projected to grow from 58% to 62% of consumption between 2001 and
2030, while consumption rises by about 35%.
24CLIMATE CHANGE IS REAL
lized in this case and the concentration rises indefinitely. The colored
curves represent the emissions levels required over time to stabilize
CO2 concentrations at 350, 450, 550, 650, and 750 ppm. Stabilization
at 550 ppm requires that world CO2 emissions peak within 30 years
and then decrease steadily year by year for the next 300 years to about
half of current emissions levels. Achieving this steady state CO2 goal
requires dramatic worldwide changes in energy consumption habits
and energy production technologies, as shown in Figure 8.
The rising top curve in Figure 8 represents the amount of carbon
that would be emitted to the atmosphere in the reference case dur-
ing the 21st century. The colored bands below it represent one pos-
sible mix of changes in global energy technology deployments for
reducing carbon emissions down to the levels required to stabilize
CO2 concentrations at 550 ppm during this period (lower blue
curve). Under any scenario, major contributions to emissions reduc-
tions will likely come from a portfolio of technologies potentially
including the following: the capture and storage of carbon pro-
duced by burning fossil fuels, conservation/energy efficiency, and
non-carbon or carbon-neutral technologies such as biomass, solar,
wind, and nuclear. In the 550 ppm scenario, almost all CO2 emis-
sions from the electric power sector are captured and stored by the
end of the 21st century, because it is easier to capture carbon in the
electricity sector than in the transportation sector. In the trans-
portation sector, emission reductions were obtained through
improvements in vehicle efficiency, deployment of hydrogen as a
fuel, and the use of liquid fuels derived from commercial biomass
crops, with the latter showing significant potential.
The scale-up of CO2 capture and storage technologies that could
occur during this century as part of a global effort to reach a 550 ppm
goal is astonishing. There could be an order of magnitude increase
from today’s levels by 2020, another order of magnitude increase by
2050, and another by 2095, when about 5,000 teragrams of carbon per
year could be captured and stored in permanent repositories.
Fortunately, it appears that the world has sufficient repository capaci-
ty available, but it is primarily in deep saline formations that will be
costly to access.2 The transportation and management of such huge
25ENERGY: THE NEW NORMAL?
quantities of captured CO2 from the power plants to permanent
repositories raise siting, technological, and legal questions we have
only begun to contemplate. These questions can only be answered by
large-scale demonstration projects proving the costs and feasibility of
this approach. In addition, many institutional preconditions would
have to be satisfied for this technology to deploy, including acceptance
of the technology within regional and national emissions accounting
systems, a value of carbon sufficient to make the technology econom-
ically viable, the development and deployment of acceptable monitor-
ing and verification technologies, and adequate resolution of long-
term liability issues, to name but a few.
Unfortunately, advanced technologies with carbon capture and stor-
age will not necessarily be sufficient to stabilize CO2 concentrations in
the atmosphere. Affordability is also a factor. After initial reductions are
made, wringing each additional ton of carbon emissions from the sys-
tem becomes harder and more expensive. Thus, the price of removing
carbon from the atmosphere goes up over time, not down, a trend that
is unfamiliar to most technologists. Without climate policies in place to
ensure that each incremental reduction in carbon comes from the
cheapest possible source, precious financial resources will be wasted, or
it may be necessary to settle for lower environmental quality.
Stabilizing GHG emissions also has implications for non-energy
policies, particularly land-use and agriculture policies. For example,
the clearing of forests for agriculture or development removes carbon-
absorbing ‘sinks’ and therefore is effectively a net contributor to GHG
emissions. Even the planting of biomass crops for electricity produc-
tion or transportation fuel may not be carbon-neutral, depending on
the previous uses of the land, specific crop involved, and cultivation
and transportation methods used. Estimates of the carbon ‘emissions’
associated with changes in worldwide land use vary widely, but some
studies suggest that they may be equivalent to 25-30% of fossil fuel
emissions and therefore need to be addressed in any comprehensive
GHG emissions policy.
2. A report released on May 10, 2006 by the Global Energy Technology Strategy Program titled
Carbon Dioxide Capture and Geologic Storage examines the storage resources and locations available.
26ACTION ITEMS
Action Items
Given the earlier ‘energy crises’ of the 1970s and 1980s, the many
reports and recommendations of august commissions, the billions
of federal dollars spent on energy research, and the current energy
consumption habits of Americans, it is no doubt appropriate to
approach a section called ‘Action Items’ with a fair degree of humil-
ity. Essentially, we face the same energy issues today that were dis-
cussed by President Carter in his famous speech on April 18th,
1977: competition between countries for limited oil and gas
resources; wasteful use of energy; increasing dependence on
imported oil; need for domestic energy sources; and mounting
damage to the environment.
Yet, since Carter’s speech, the problems have certainly intensified,
and new problems (e.g., global climate change) have come to the
fore. If we are not in a completely ‘new normal’, at the very least our
energy problems have become more complicated and challenging,
and there is no prospect of them getting any easier in the future—
quite the reverse, in fact. Below are some thoughts of Forum partic-
ipants about action items for moving ahead.
R&D vs. Innovation
Innovation—defined here as the deployment of improved tech-
nologies and processes to do things faster, better, or cheaper—occurs
in the private sector, and will be essential for meeting the energy
challenges discussed above. But who should pay for it? R&D, which
may range from basic science to applied work, occurs within both
the government and the private sector, and may or may not lead to
innovation. Basic research can generate ideas and give innovators
tools to work with. But much of innovation is putting existing
pieces together and making them work in new ways. There are mod-
els in which targeted government R&D investments have led to dra-
matic innovations in the private sector. Research sponsored by the
Defense Advanced Research Projects Agency (DARPA) within the
U.S. Department of Defense, for instance, is known to have stimu-
lated the development of the Internet and the commercial semicon-
27ENERGY: THE NEW NORMAL?
ductor and microelectronics industries. On the other hand, there
have been many government programs, such as the ill-fated Synfuels
Corporation in the energy area, that fell out of step with market
trends and customer needs, and failed to produce innovation.
Currently the government is spending about $500 million on
basic energy research. Government R&D programs are most effec-
tive in stimulating innovation when they concentrate on areas that
the private sector needs, but is unable to invest in. This includes fun-
damental basic research as well as applied research that is targeted
toward solving specific industry problems. The U.S. Department of
Energy (DOE) is getting better at doing applied work, but
Congressional earmarks are diluting more and more of the effec-
tiveness of basic research funding. The government should invest in
principal investigators who have a passion for applying their knowl-
edge to solve energy problems. It should also be cautious about
investing in markets that don’t yet exist.
Private Sector Investment
With energy prices near all-time highs and the need for new
sources of energy supply clear, the energy industry is running flat
out to drill new wells and develop new base load electricity capacity.
Investment funds are pouring money into the energy area, including
‘green’ energy technologies. Automobile companies are rushing to
produce more fuel-efficient hybrids to meet demand. The energy
sector is currently ‘hot’ in part because other market sectors are in
the doldrums, and in part because investors tend to forget past cycles
of energy booms and busts. There is a sense of wanting to take
advantage of the new interest in energy as long as it lasts.
Several trends can be seen in investments in the energy sector:
• Consumer spending on natural gas and electricity is increas-
ing. Natural gas is the marginal price-setter in most regions.
Base case demand projections and tighter reserve margins
indicate that more generation is needed.
28ACTION ITEMS
• Private equity capital is flowing into the energy infrastructure.
Investors are particularly interested in a ‘pure play’ model, i.e.,
owning a specific piece of the natural gas or electricity infra-
structure.
• The pipeline industry is coming back. Tens of billions in cap-
ital is going to pipelines.
• Interest in the liquefied natural gas (LNG) sector is growing
rapidly, as well as the gas storage area. It is important to be able
to receive the gas when it can come, and one can only capture
the off-peak availability of LNG with storage.
• Utilities are facing a number of tough issues. Higher fuel
prices are typically passed along to the consumer, but even
though costs are going up, regulators may not be willing to
make the consumer pay. There is a need for more robust access
to market clearing information. Finally, there is investor
appetite for new energy technologies, but it is important to
keep R&D focused on solving problems, rather than R&D for
its own sake.
The biggest factor affecting the flow of capital in the energy infra-
structure area is the regulatory environment—whether positive or
negative. A clear, consistent and constructive regulatory environ-
ment at the state and Federal levels is necessary to attract capital.
One reason that so much capital is flowing into pipelines, for
instance, is that there is only one regulator, the Federal Energy
Regulatory Commission, with stable investment recovery rules.
The cost of capital for funding infrastructure investment will be
directly related to investors’ perceived risks. Very high risk projects
may have a 20% cost of capital, and low risk about 7%.
Transmission lines are considered low risk, and pipelines somewhere
in the middle. If regulations do not allow for the pass-through of
increased costs to consumers or continually change the investment-
recovery rules, this will drive capital away or signal higher risks for
investors.
29You can also read