Climate-Specific Passive Building Standards - Graham S. Wright and Katrin Klingenberg Passive House Institute US - NREL
←
→
Page content transcription
If your browser does not render page correctly, please read the page content below

Climate-Specific
Passive Building
Standards
Graham S. Wright and Katrin Klingenberg
Passive House Institute US

July 2015
NOTICE

This report was prepared as an account of work sponsored by an agency of the United States government.
Neither the United States government nor any agency thereof, nor any of their employees, subcontractors, or
affiliated partners makes any warranty, express or implied, or assumes any legal liability or responsibility for the
accuracy, completeness, or usefulness of any information, apparatus, product, or process disclosed, or
represents that its use would not infringe privately owned rights. Reference herein to any specific commercial
product, process, or service by trade name, trademark, manufacturer, or otherwise does not necessarily
constitute or imply its endorsement, recommendation, or favoring by the United States government or any agency
thereof. The views and opinions of authors expressed herein do not necessarily state or reflect those of the
United States government or any agency thereof.

 Available electronically at http://www.osti.gov/bridge

 Available for a processing fee to U.S. Department of Energy
 and its contractors, in paper, from:

 U.S. Department of Energy
 Office of Scientific and Technical Information
 P.O. Box 62
 Oak Ridge, TN 37831-0062
 phone: 865.576.8401
 fax: 865.576.5728
 email: mailto:reports@adonis.osti.gov

 Available for sale to the public, in paper, from:

 U.S. Department of Commerce
 National Technical Information Service
 5285 Port Royal Road
 Springfield, VA 22161
 phone: 800.553.6847
 fax: 703.605.6900
 email: orders@ntis.fedworld.gov
 online ordering: http://www.ntis.gov/ordering.htm
Climate-Specific Passive Building Standards

 Prepared for:

 The National Renewable Energy Laboratory

On behalf of the U.S. Department of Energy’s Building America Program

 Office of Energy Efficiency and Renewable Energy

 15013 Denver West Parkway

 Golden, CO 80401

 NREL Contract No. DE-AC36-08GO28308

 Prepared by:

 Graham S. Wright and Katrin Klingenberg

 Passive House Institute US

 Building Science Corporation
 3 Lan Drive, Suite 102
 Westford, MA 01886

 NREL Technical Monitor: Stacey Rothgeb

 Prepared under Subcontract No.KNDJ-0-40337-05

 July 2015

 iii

The work presented in this report does not represent
performance of any product relative to regulated
minimum efficiency requirements.

The laboratory and/or field sites used for this work are
not certified rating test facilities. The conditions and
methods under which products were characterized for
this work differ from standard rating conditions, as
described.

Because the methods and conditions differ, the reported
results are not comparable to rated product performance
and should only be used to estimate performance under
the measured conditions.

 iv
Contents
List of Figures ............................................................................................................................................ vi
List of Tables ............................................................................................................................................. vii
Definitions ................................................................................................................................................. viii
Acknowledgments ..................................................................................................................................... ix
Executive Summary .................................................................................................................................... x
1 Introduction ........................................................................................................................................... 1
 1.1 Background and Rationale ............................................................................................................... 1
 1.1.1 Recognition of a Performance-Based Standard .................................................................. 1
 1.1.2 Recognition of a Standard that Was Developed Explicitly To Reduce the Carbon
 Footprint of Buildings and Increase Resilience .................................................................. 3
 1.1.3 The PHIUS+/ZERH Partnership Has Greatly Increased Adoption of Passive Building in
 the United States ................................................................................................................. 3
 1.1.4 PHIUS+/ZERH: The Next Generation ............................................................................... 4
 1.2 Objectives ........................................................................................................................................ 8
 1.3 Main Issues ...................................................................................................................................... 8
 1.3.1 A Different Cost Structure Implies a Different Economic Optimum ................................. 8
 1.3.2 Interaction of Criteria and Climate Misled Designers ........................................................ 9
 1.4 North American and European Climate Comparisons ................................................................... 10
 1.5 Illustrative Cases ............................................................................................................................ 13
 1.6 Synthesizing Program Characteristics ........................................................................................... 19
 1.7 Aspects To Retain .......................................................................................................................... 19
 1.8 Aspects of the Current Passive Standard To Amend ..................................................................... 20
 1.8.1 Space-Conditioning Criteria ............................................................................................. 20
 1.8.2 Source Energy Criterion ................................................................................................... 21
 1.9 Occupant Behavior Summary ........................................................................................................ 25
 1.10 Airtightness ....................................................................................................................... 26
 1.11 Other Notable Amendments ............................................................................................. 26
2 Methodology ....................................................................................................................................... 27
 2.1 Economic Optimization Studies—Overview ................................................................................. 27
 2.2 The Study Building and Other Constant Factors ........................................................................... 28
 2.3 Standard-Setting Heuristic ............................................................................................................. 35
 2.4 Statistical Smoothing ..................................................................................................................... 40
 2.5 Thermal Comfort Check ................................................................................................................ 46
 2.6 Peak Load Crossover ..................................................................................................................... 47
3 Conclusions ........................................................................................................................................ 48
 3.1 Recommendations and Future Work ............................................................................................. 49
References ................................................................................................................................................. 52
Appendix A: Cost Optimization Calculation Protocol ........................................................................... 55
 Custom BEopt Options and Cost Overrides ......................................................................................... 59
 Ventilator Cost Data ...................................................................................................................... 59
 Window Cost Extrapolation ........................................................................................................... 60
Appendix B: Cost Curves and BEopt Output for Four Example Locations ........................................ 62
 San Francisco, California (zone 3C) .................................................................................................... 62
 Houston, Texas (zone 2A) .................................................................................................................... 64
 Portland, Oregon (zone 4C).................................................................................................................. 65
 Edmonton, Alberta (zone 7) ................................................................................................................. 67
Appendix C: Space Conditioning Data Table ......................................................................................... 68
Appendix D: Statistical Modeling—Example Screening Fit.................................................................. 73
Appendix E: Passive (and “Low-Grade-Energy”) Measures and Strategies ...................................... 75

 v
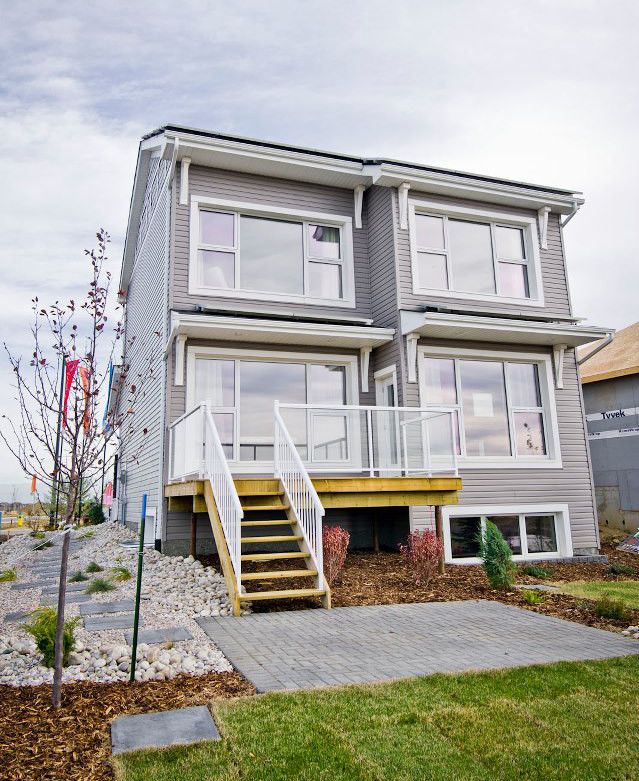
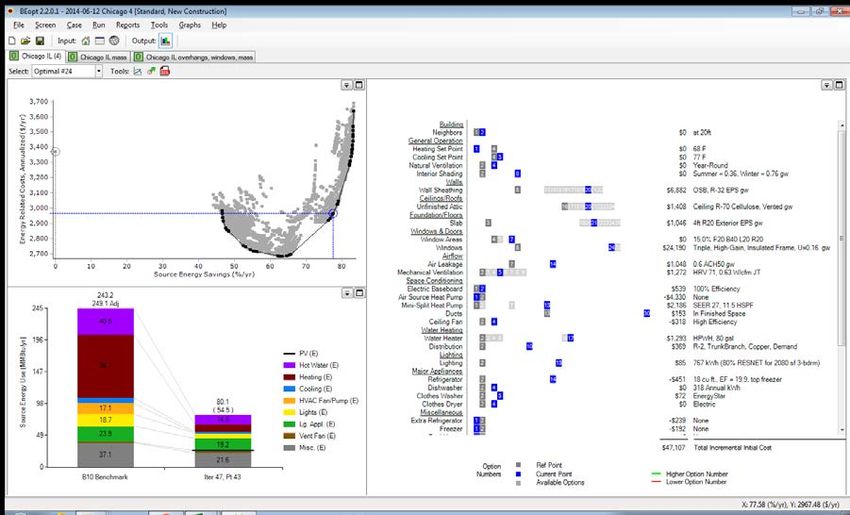
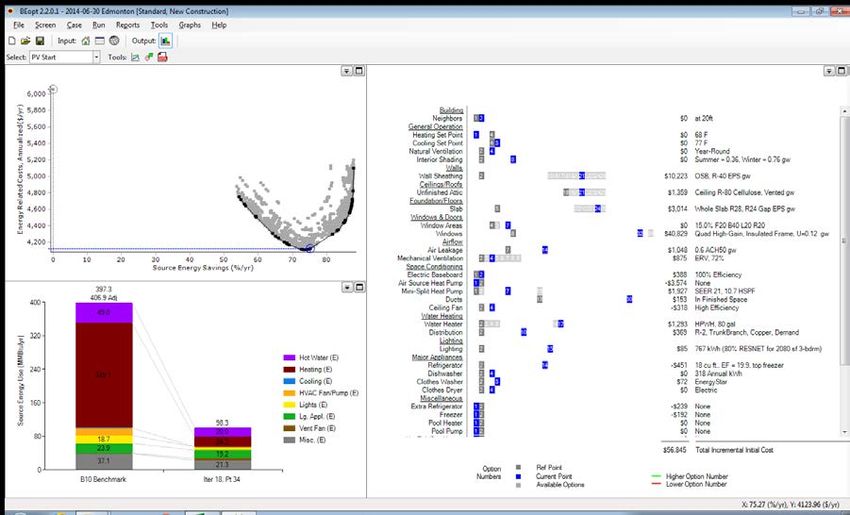
List of Figures
Figure 1. Residential energy code stringency ......................................................................................... 2
Figure 2. PHIUS+ Certified passive projects trend of the past 11 years and projection for 2015 ...... 4
Figure 3. European cost graph .................................................................................................................. 9
Figure 4. Diminishing returns of insulation in a 4,400 HDD climate .................................................... 13
Figure 5. Fairview Houses I and II, 2007, Urbana, Illinois ..................................................................... 14
Figure 6. Mini B, 2010, Seattle, Washington ........................................................................................... 14
Figure 7. Dublin House, 2010, Urbana, Illinois ....................................................................................... 15
Figure 8. Modular passive home, Edmonton, Alberta ........................................................................... 16
Figure 9. IESVE indoor thermal comfort prediction without natural ventilation ................................ 17
Figure 10. IESVE indoor thermal comfort prediction with natural ventilation, perfectly executed by
 occupants ............................................................................................................................................ 17
Figure 11. Measured performance data for the passive home in Salem, Oregon, first-year billing
 analysis ................................................................................................................................................ 24
Figure 12. Example estimate of coincident production and use (“live utilization”) of PV electricity25
Figure 13. Conceptual plot of the path to zero energy .......................................................................... 27
Figure 14. Climate locations for Phase 1 economic analysis............................................................... 29
Figure 15. BEopt visualization of the study building ............................................................................ 30
Figure 16. BEopt output screen, Chicago Illinois, at chosen cost-competitive point ....................... 31
Figure 17. Economic analysis report example, Chicago Illinois, annualized costs and first-cost
 premium ............................................................................................................................................... 31
Figure 18. Economic analysis report example, Chicago Illinois, heating/cooling demand chart .... 32
Figure 19. Economic analysis report example, Chicago Illinois, peak load chart (per Manual J) .... 32
Figure 20. Formula for annual heating demand criterion ..................................................................... 42
Figure 21. Formula for annual cooling demand criterion ..................................................................... 43
Figure 22. Formula for peak heating load criterion ............................................................................... 44
Figure 23. Formula for peak cooling load criterion ............................................................................... 45
Figure 24. Interior conditions, hourly for the year, Chicago ................................................................ 47
Figure 25. Preliminary optimization run to screen ventilator options ................................................. 60
Figure 26. Cost extrapolation for windows ............................................................................................ 61

Unless otherwise noted, all figures were created by the Building Science Corporation team.

 vi
List of Tables
Table 1. Historical Development of High-Level Performance Programs and Their Comparison ....... 7
Table 2. South Glazing Concentration by Zone, Certified and Precertified Projects ........................ 10
Table 3. Design Temperatures and Degree Days, North America, Coastal, East ............................... 10
Table 4. Design Temperatures and Degree Days, North America, Pacific Northwest ....................... 11
Table 5. Design Temperatures and Degree Days, United States, Midcontinent, East ....................... 11
Table 6. Design Temperatures and Degree Days, United States, Midcontinent, West-Central ........ 12
Table 7. Design Temperatures and Degree Days, United States, Midcontinent, North ..................... 12
Table 8. Installed Heating Capacity for 3567 Claxton Crescent ........................................................... 18
Table 9. CO 2 Fair-Share Numbers ........................................................................................................... 22
Table 10. Lighting and Plug Loads Example Calculation, Standard-Adaptation Study Building ..... 23
Table 11. Economic Analysis Report, Example Table for Chicago, Illinois ........................................ 33
Table 12. Option Configuration (subset) at the Optimal Points Listed in Table 11 ............................ 34
Table 13. Zone Median Space-Conditioning Targets by Diminishing Returns Heuristic .................. 38
Table 14. Zone Median Space-Conditioning Targets by PV Start Rule ............................................... 39
Table 15. Zone-by-Zone All-Points Median Percentage Reductions From Benchmark (Pre-
 Recalculation Data) ............................................................................................................................ 40
Table 16. All-Points Median Percentage Reductions From Benchmark ............................................. 40
Table 17. PHIUS Technical Committee Resolutions .............................................................................. 55
Table 18. BEopt input—Options Screen, Example for Chicago ........................................................... 56
Table 19. BEopt Input, Geometry Screen ............................................................................................... 59
Table 20. Ventilator Cost Data ................................................................................................................. 59

Unless otherwise noted, all tables were created by the Building Science Corporation team.

 vii
Definitions
ACH50 Air changes per hour at 50 Pascals pressure difference
ASHRAE American Society of Heating, Refrigerating and Air-Conditioning
 Engineers
BA Building America
BEopt™ Building Energy Optimization (software)
CDD65 Cooling Degree Days, base 65° F
CFM50 Cubic feet per minute of air flow at 50 Pascals pressure difference
CFM75 Cubic feet per minute of air flow at 75 Pascals pressure difference
CO 2 Carbon Dioxide
DDHR Dehumidification design humidity ratio
DOE U.S. Department of Energy
EPS Expanded Polystyrene
ERV Energy Recovery Ventilator
HDD65 Heating Degree Days, base 65° F
HRV Heat Recovery Ventilator
iCFA Conditioned floor area by interior dimensions
IECC International Energy Conservation Code
IESVE Integrated Environmental Solutions Virtual Environment
IPCC Intergovernmental Panel on Climate Change
OSB Oriented Strand Board
PHI Passivhaus Institute (Darmstadt, Germany)
PHIUS Passive House Institute US
PHPP Passive House Planning Package
PV Photovoltaic
RESNET Residential Energy Services Network
SSCD Specific space cooling demand (annual kBtu per square foot of iCFA)
SSHD Specific space heating demand (annual kBtu per square foot of iCFA)
TC Technical Committee
WUFI Wärme und Feuchteinstationär (Heat and Moisture, Transient)
XPS Extruded Polystyrene
ZERH Zero Energy Ready Home

 viii
Acknowledgments
The authors thank Building Science Corporation, specifically Betsy Pettit for her tremendous
support and final reviews; the PHIUS Technical Committee for its critical contribution to this
work; the PHIUS staff team specifically James M. Kernagis for continued technical advice and
Michael Knezovich for editorial advice.
For their many and significant contributions to this study, the authors thank the members of the
PHIUS Technical Committee:
Ryan Abendroth
Florian Antretter
Thorsten Chlupp
Adam Cohen
Prudence Ferreira
Stuart Fix
Achilles Karagiozis
Russell Richman
John Semmelhack
Jesse Thomas

 ix
Executive Summary
In 2012, the U.S. Department of Energy (DOE) recognized the value of performance-based
passive building standards when it joined with Passive House Institute US (PHIUS) to promote
DOE’s Challenge Home program in tandem with the PHIUS+ Certification program. Since then,
the number of passive building projects that have been certified under the partnership has grown
exponentially because of some synergy. Passive building represents a well-developed approach
to arrive at the envelope basis for zero energy and energy-positive projects by employing
performance-based criteria and maximizing cost-effective savings from conservation before
implementing renewable energy technologies. The Challenge Home program evolved into the
Zero Energy Ready Home (ZERH) program in a move toward 1) attaining zero energy and 2)
including active renewable energy generation such as photovoltaics (PV)—toward the zero
energy goal.

A synthesis of the two programs, PHIUS+ and ZERH—which combines optimized performance-
based envelope design guidelines and zero energy goals—has the potential to make net zero
energy a mainstream market force. But experience to date has identified a critical obstacle to
wide-scale adoption across the nation: the passive/conservation performance metric currently
used as the envelope design guideline for space-conditioning criteria (following the German
Passivhaus standard) is not responsive to the wide diversity of climate and energy market
conditions in the United States.

Passive design principles (superinsulation, airtight envelopes, elimination of thermal bridges,
etc.) were pioneered in North America in the 1970s and 1980s and refined in Europe in the
1990s. These principles are universally effective in significantly reducing heating and cooling
loads. However, a single rigid performance metric developed in Germany has led to limited
uptake of passive building principles in many regions of the United States. It has also sometimes
promoted design decisions that had negative effects on economic feasibility and thermal comfort.

This study has two objectives:

 • Validate (in a theoretical sense) verifiable climate-specific passive standards and space-
 conditioning criteria that (1) retain ambitious, environmentally necessary energy
 reduction targets and (2) are economically feasible. Such standards provide designers an
 ambitious but achievable performance target on the path to net-zero energy.
 • Develop simplified formulas for inclusion in a design and verification software tool that
 allows custom criteria to be generated based on specific climate and energy cost
 parameters for any particular location.
The approach to arrive at this new set of criteria is to critically reevaluate the current German-
derived criteria in light of the issues discovered. A volunteer technical expert advisory council
called the PHIUS Technical Committee (TC) has assisted the authors in the process; the results
presented here reflect consensus votes by this volunteer expert body.

The main guiding criteria comprise three “pillars”:

 x
• Space conditioning (limits on heating and cooling loads) that incent passive measures
 • A source energy limit that encourages the efficient use of equipment and meets
 environmentally required reduction targets with a “conservation first” goal
 • Airtightness requirements to ensure that highly insulated envelopes do not develop
 moisture problems that will lead to significant failures of the envelope components.
The bulk of the work is concerned with restructuring and resetting the heating and cooling load
limits in a way that better guides the designer toward cost-competitive levels of investment in the
passive measures such as insulation and heat recovery ventilation, which reduce heating and
cooling loads. This is done in a climate-sensitive way. The basic approach is to use NREL’s
Building Energy Optimization software (BEopt) with its embedded National Residential Energy
Efficiency Measures database to:

 • Cost-optimize an energy-saving upgrade package for a study building in 110 climate
 locations in North America.
 • Note the heating and cooling load performance achieved.
 • Curve-fit the data to local climate parameters such as degree-days and design
 temperatures. The optimizations are constrained with strict airtightness requirements and
 minimum window U-values to ensure that building durability and winter comfort are not
 compromised in the quest for energy savings.
The result is a set of simple formulas that can be embedded into building energy modeling
software to set the heating and cooling criteria for any location in which the local climate
parameters are known.

The German-derived source energy and airtightness criteria were reevaluated. Although the new-
space conditioning criteria would still be based on floor area (using a new simplified conditioned
floor area), the proposed source energy and airtightness criteria will use different scaling rules.
The airtightness limit will scale with envelope surface area instead of building volume. A
commensurate change from ACH50 measurement to CFM50/ft² of gross envelope area is
recommended; the source energy limit for residential projects would scale per person based on
design occupancy instead of on floor area. This limit would remain consistent with the global
total carbon dioxide emissions limits brought forward by the Intergovernmental Panel on Climate
Change.

In summary, adaptations are proposed for all three pillars:

 • The airtightness requirement was reconsidered on the basis of avoiding moisture and
 mold risk. The proposed change is from a limit of 0.6 ACH50 to 0.05 CFM50/ft2 of gross
 envelope area (or 0.08 CFM75). This change allows the airtightness requirement to scale
 appropriately based on building size.
 • The source energy limit was reconsidered on the basis of the global carbon dioxide
 emission budget. The following changes are proposed to make the scoring fairer and the
 calculation more accurate:

 xi
o Change to a per-person limit rather than a limit measured by square feet of floor
 area for residential projects.
 o Correct the source energy factor for grid electricity in the calculation protocol to
 3.16, which is consistent with the U.S. national average.
 o Adopt lighting and miscellaneous plug load defaults at 80% of the Residential
 Energy Services Network standard.
 o Set the source energy limit to 6,200 kWh/person/year and tighten it to 4,200
 kWh/person/year within a few years.
 • Apply the limit to the source energy calculated net of the estimated fraction of on-site PV
 or other renewable electricity generation that is used on site as it is produced. This
 accounts for PV the same way solar hot water is accounted for.
The space-conditioning criteria were reconsidered on the basis of economic feasibility. The
proposed changes are to:

 • Shift to mandatory thresholds on annual heating and cooling demands and peak heating
 and cooling loads that are climate specific to a project’s location. These thresholds are
 aimed at a near-optimal “sweet spot” with slightly more energy savings than would occur
 at the cost-optimum point calculated by the Building Energy Optimization software. This
 shift will ensure that efficiency measures will be reasonably cost-competitive and will
 provide some increased resilience benefits.
 • Adopt a simplified inclusive interior-dimension reference floor area.
The outcome of this study yields a cost-effective performance-based standard that would reduce
energy consumption in buildings on a national average by an estimated 86% for heating and 46%
for cooling; the peak heating load (and system size) would be reduced by 77% and the peak
cooling load would be reduced by 69%. Total source energy use would also be reduced for
buildings consistent with limiting global temperatures from warming by more than 2°C.
By its structure, the proposed standard addresses three hurdles to source zero energy. The
designer’s attention is directed first to reducing heating and cooling energy use by passive means
(including the use of some mechanical devices), then to reducing total energy demand by using
efficient equipment (and some renewables), and finally to source zero energy by additional
renewable energy generation.
The authors recommend adopting the standard as the basis for the next-generation ZERH as cost-
competitive envelope guidelines to achieve zero energy and active generation.

 xii
1 Introduction
1.1 Background and Rationale
Given the large proportion of energy used in buildings (40%, according to the U.S. Energy
Information Administration [EIA 2013]) and growing consensus about the economic and social
costs of climate change, a movement to decrease energy demand through conservation and to
increase the use of renewables is coalescing.

In 2010 the European Parliament committed to broad levels of carbon reductions per the Kyoto
Protocol to the United Nations Framework Convention on Climate Change. The protocol called
for adopting passive building strategies and scaling up renewable energy supplies. The European
Union committed its members to reaching near zero energy buildings by 2020 (EU 2010).

Europe has always focused on performance metrics. In recent years—beginning with the German
Passivhaus performance standard—the passive design methodology has gained widespread
adoption. Variations on that approach and metric have been codified in countries such as
Belgium, Sweden, and Switzerland. (Jacobson 2013; Dockx 2013)

Similar efforts are underway in the United States. For example, the 2030 Challenge by architect
Ed Mazria calls for buildings to be carbon neutral by 2030. The U.S. Department of Energy
(DOE) has led efforts to improve building energy performance through programs such as
Building America (BA). In 2012, DOE recognized the value of performance-based passive
building standards when it joined with Passive House Institute US (PHIUS) to co-promote
DOE’s Challenge Home program. Challenge Home was an evolution of the successful Builders
Challenge program. In 2014, Challenge Home was renamed the Zero Energy Ready Home
(ZERH) program; it emphasizes that homes are being designed to accommodate renewables.

Within the PHIUS+/ZERH partnership, the PHIUS+ Certification program includes passive
building design verification and Residential Energy Services Network (RESNET)-approved
quality assurance protocols. The certification program was adjusted to include some prescriptive
requirements to meet ZERH criteria. (The 2030 challenge does not prescribe any efficiency or
conservation measures on the way to carbon neutrality; the ZERH program, however, requires
high-performance envelope measures.)

The PHIUS+/ZERH partnership remains significant for several reasons that are discussed in
Section 1.1.1 through Section 1.1.4.

1.1.1 Recognition of a Performance-Based Standard
By recognizing the PHIUS+ program—which is fundamentally a performance-based standard
with a prescriptive component related to ZERH requirements—ZERH acknowledged the value
of performance-based standards in general and of the passive building standard in particular.
This is a critical recognition in a historical context. In 1970, the White House Council on
Environmental Quality issued its First Annual Report along with a presidential message to
Congress (Train et al. 1970). The report included a comprehensive analysis of the environmental
threats that face the United States and made the case for establishing the U.S. Environmental
Protection Agency. Notably, the report called attention to the possibility of climate change.

 1
Once the U.S. Environmental Protection Agency was established, its attention to environmental
issues combined with the OPEC oil embargo in 1973 led to significant government funding of
energy-efficiency research (ASE 2013). The first commercial energy-efficiency design
guidelines were established by ASHRAE and published in 1975 as Standard 90-75. The
guidelines were later renamed the Model Energy Code and further iterations followed. The
Model Energy Code is the predecessor to today’s ASHRAE 90.1.

Significantly, in 1976 the first proposed federal legislation and national building energy code
specified a performance-based approach rather than the now-familiar prescriptive/checklist
improvements over a baseline home. The proposed legislation required all buildings to meet an
energy target per square foot as verified by a computer model. In the face of opposition from the
building industry, the performance-based requirement was replaced by a prescriptive approach in
the legislation that was eventually enacted. The subordination of the performance-based
requirement had a longstanding effect on the development of codes and efficiency programs.

In 1994 the nonprofit International Code Council was founded. It published the first edition of
the International Energy Conservation Code (IECC) in 1998 and has since issued revisions in 3-
year code cycles. The resulting improvements (by estimated percentage) over the first guidelines
published by ASHRAE in Standard 90-75 that followed are shown in Figure 1 by each iteration
and then by versions of IECC (EIA 2008). The data from 2006 IECC to 2012 IECC (ICC 2012,
not shown here) represent another major 30% reduction.

 Figure 1. Residential energy code stringency

Although code has trended toward greater energy efficiency, lawmakers and policymakers are
challenged to accurately assess actual energy-efficiency performance—and improvements—of
the built environment in absolute and measurable terms. That is because quantifying and
verifying actual performance improvements is not the main objective of a mostly prescriptive
regime. Prescriptive standards apply a linear, additive approach of individual measures that fail
to look at buildings as systems and fail to account for the “whole being larger than the sum of its

 2
parts.” Synergies cannot be accounted for unless a building system is modeled intentionally to
exploit them during the design process with a model designed for that purpose. Therefore, an
integrated design process that is guided by appropriate performance targets would yield greater
efficiencies than conventional building design methodologies and energy accounting.

Europe’s building energy codes have traditionally followed the performance-based model; high-
performance programs or low-energy home designations are characterized by absolute energy
metrics or energy use intensity indexes as benchmarks to govern various levels of energy use in
buildings. Buildings can then be directly compared in terms of their energy use intensities and
can progress toward absolute efficiency goals. The recognition of the PHIUS+ program by
ZERH is a step toward leveraging the advantages of performance criteria and toward alignment
with international approaches to energy and carbon reduction efforts.

1.1.2 Recognition of a Standard that Was Developed Explicitly To Reduce the
 Carbon Footprint of Buildings and Increase Resilience
The fundamental principles behind passive building—superinsulation, airtight envelopes, etc.—
were developed in the 1970s and 1980s in the United States and Canada. Much of that work was
done with government funding that responded to environmental, economic, and geopolitical
crises. The terms passive house and passive housing were coined by early Canadian pioneers in
the 1970s (Dumont et al. 1978) and were later used by the renowned physicist William Shurcliff
in the 1980s and others (Shurcliff 1982, 1986). The term passive expressed then (as it does
today) an effort to reduce heating energy consumption in buildings to nearly zero by limiting
heat loss and optimizing gains via insulation, high-performance windows, and airtightness.
Envelope performance is guided by the low peak load design tenet that provides resiliency as a
prime benefit: the home needs only a “micro-load” mechanical backup system for normal
operation and can “coast” thermally through power outages. By 1986 many homebuilders were
designing their homes accordingly and Shurcliff declared the technology mature (Shurcliff
1988). By the end of the 1980s as many as 30,000 of these homes had been built in the United
States and Canada (Nisson and Dutt 1985).
As interest in conservation and efficiency foundered in North America (Biello 2010), the
German physicist Wolfgang Feist—initially with Swedish Collaborator Dr. Bo Adamson and
continuing today at the Passivhaus Institut (PHI)—continued to refine the principles and develop
a modeling tool and an energy metric known in German as Passivhaus.
The first convincing German research project that employed the low-load home design tenet was
a four-townhouse development in Kranichstein in Darmstadt Germany that was completed in
1991. The project reduced energy demand and system size by a factor of 10 in the central
European climate zone. The passive metric developed from this effort guided designs toward
very low peak loads.
1.1.3 The PHIUS+/ZERH Partnership Has Greatly Increased Adoption of Passive
 Building in the United States
Since PHIUS and DOE announced the alignment of the PHIUS+ program with the Challenge
Home program (now ZERH), the growth in PHIUS+ Certified projects has increased
dramatically. The growth continues (see Figure 2). The fastest-growing typology is
multifamily—large multiunit projects are underway and many more are in the planning stages.

 3
Figure 2. PHIUS+ Certified passive projects trend of the past 11 years and projection for 2015

In Europe, the uptake of passive building principles provided incentives for manufacturers to
innovate and produce a growing range of high-performance building components including
doors, windows, air-sealing products, and ventilation equipment. The increased uptake of passive
houses in Europe has also produced economies of scale that have reduced the prices of premium
components significantly. This development has effectively created an entirely new market
segment and economic opportunities.

The same dynamic is operating in North America. PHIUS launched a window certification
program concurrently with the PHIUS+/ZERH program. The PHIUS Certified Data for
Windows program analyzes manufacturer-supplied data and evaluates products for suitability in
Passive House projects by climate (using the standard ASHRAE/DOE North American climate
zones). Since the launch of the program, 10 manufacturers have submitted hundreds of models
for evaluation; 130 models have been recommended for at least one climate zone. Significantly,
the roster of manufacturers includes mostly domestic companies including a very large
mainstream window firm Marvin Windows and Doors.

1.1.4 PHIUS+/ZERH: The Next Generation
Combining passive building principles and low peak load design tenets with a zero energy target
has an intrinsic logic: reduce demand and peak loads to a point at which the envelope
improvements are cost-effective and all the building’s needs can be met with a minimized and
affordable and active renewable energy system to reach zero energy. Designers and builders are
recognizing passive house as a critical path to zero. Based on the growth shown so far, the
combination has potential to make zero energy—achieved via passive building—into a mass-
market phenomenon. However, a significant obstacle to wide-scale adoption remains; removing
that obstacle is the motivation of the work and results described here.

 4
The problem is that passive performance targets have not been optimized by climate zone. Until
now, the European energy metric of 4.75 kWh/ft2 annual load has served as a one-size-fits-all
design target for all climates. In some climates this has led to very costly projects; in others it has
produced significant thermal comfort issues. In short, that metric has led to poor design decisions
in climates that are significantly different from the central European zone with its moderately
cold heating-dominated climate. Even though the underlying Passive House design principles
have proven effective in all climate zones, a one-size-fits-all performance target has proved to be
a disincentive in many climate zones.
Some history of the European standard’s application in the United States is in order. In 2002
PHIUS cofounder Katrin Klingenberg completed a Passive House proof of concept for the
United States—the Smith House, which was a single-family home that significantly reduced
energy consumption (Stecher and Klingenberg 2008). It was followed a few years later by the
two houses (Fairview I and II) built by e-co lab, which was a community housing development
organization. These houses were also monitored and tested by the DOE BA partner IBACOS. A
BA report was published about Fairview II (Stecher and Allison 2012).
PHIUS was founded in 2007 and has since trained 1,800 professionals and become the leading
Passive House project certifier in North America. From the beginning, PHIUS’ work in the
United States was informed by—but was mostly independent from—the German institute. That
was by necessity because North America’s multiple and more extreme climate zones presented
different challenges for passive building than do the zones in the central European climate.
Almost every project offered a new climate challenge. These circumstances sometimes resulted
in projects that had the same overheating problems as early “mass-and-glass” designs from the
1970s. In other instances—in Louisiana for example—the German-derived standard did not
account for humidity loads and predicted cooling demands inaccurately.
Driven by building science, PHIUS sought to resolve the new issues presented by multiple and
more extreme climate zones in the United States. It drew on the original writings and research
done in North America in the 1970s and 1980s and the good work of the Germans. PHIUS then
collaborated with leading building science experts in the United States and Canada such as
Building Science Corporation.
Although PHIUS and the Passive House community have enjoyed substantial success, a review
of hundreds of projects across North American climate zones showed clearly to PHIUS and the
growing community of Passive House practitioners that the German Passivhaus standard was
significantly challenged and cost-prohibitive in vast areas of North America. In areas such as the
Pacific Northwest, uptake of Passive House has grown quickly because the climate is similar to
that in which the German standard was derived. But in others, the energy target has been a
disincentive to using Passive House as a platform for zero energy.
The work described here aims to retain the proven value of passive design techniques
(optimizing the envelope for example) and to use the National Renewable Energy Laboratory’s
Building Energy Optimization (BEopt™) tool to set new passive building metrics that reflect
climate-specific requirements, national construction costs, and regional energy costs. The main
objective is to propose a standard that makes such necessary adjustments and can function as an
easy-to-understand and use proxy for “how far to go” first with passive measures before adding

 5
efficient systems and renewable energy systems. The goal is a simple yet fine-grained
performance-based design methodology that guides the designer to identify the most cost-
effective path to zero with the greatest overall benefits to building owners and society.
The work retains the ambition of the Passive House movement to reduce building energy
requirements and carbon footprints, all while creating supremely comfortable and resilient
buildings and spurring innovation in building science and in the building component industry.
The refined climate-specific passive building standard is proposed as the basis for the next-
generation ZERH. A fundamental premise of this study is that performance-based metrics are
useful to advance national and global energy and carbon reduction goals. ZERH and PHIUS+ are
already employing performance-based guidelines and agree on this premise. PHIUS brings a
methodology to the table that employs passive building techniques that prioritize savings from
passive measures; ZERH brings to the table (1) a methodology through BEopt to evaluate the
cost-effectiveness of all measures and (2) a strong approach to field quality assurance.
Table 1 shows the historical development of high-performance building programs that spans
from the first-generation Passive House pioneers to the newly proposed targets. It outlines their
respective reduction targets for heating loads, cooling loads, and system size. The proposed new
standard that this study yields appears to be in close alignment with the targets of the first
generation. See Holladay (2010) for a history of the period 1974–1986.

 6
Table 1. Historical Development of High-Level Performance Programs and Their Comparison
 Prescriptive
 or
 How Far To Reduce Heating Load Approach to Total Energy Approach to Quality Assurance
 Performance
 Emphasis
 Heat loss (peak load) 60%–80% reduction,
 annual heating demand 80%–90% reduction
First-Generation
 (from pre-1980 conventional). Space heating
 Passive House/ Mostly
 peak ~10–17 W/m2 (3.17–5.39 Btu/h/ft2 or ~1.0- Not addressed Craft, airtightness test
Super-Insulation performance
 1.7 W/ft2), space-heating demand less than
 (1973–1989)
 water heating. Point source heating sufficient,
 airtight construction.
 Peak load limit ~10 W/m2 (3.17 Btu/h/ft2 or 1
 W/ft2) alternative limit 4.75 kBtu/ft2 annual
 PHI heating and cooling demand each. Additional Mostly Annual source energy limit, Craft, airtightness test, ventilation
 (1996–Present) allowance for dehumidification on the cooling performance floor area based commissioning
 side in humid climates, supply air heating
 sufficient, airtightness 0.6 ACH50.
 Home Energy Rating
 IECC 2012 insulation levels, ducts inside, Dual path—all-
 DOE Challenge System rating before
 windows R 2.5–3.7, airtightness 1.5–3 ACH50, prescriptive or Craft, extensive checklist, third-party
 Home/ZERH photovoltaic (PV) (site
 annual heating ~50% reduction from 2009 BA prescriptive + quality assurance/quality control
 (2011–Present) energy reduction relative to
 benchmark, annual cooling ~25% reduction. performance
 base case of same design.)
 Craft, extensive checklist, third-party
 Peak load limit ~ 10 W/m2 (3.17 Btu/h/ft2 or 1
 quality assurance/quality control,
 W/ft2) Alternate limit 4.75 kBtu/ft2 annual
 PHIUS+ Prescriptive + Annual source energy limit, including airtightness test and full
 heating and cooling demand each. Additional
 (2012–Present) performance floor area based commissioning of systems including
 allowance for dehumidification on the cooling
 verification of actual energy use of
 side in humid climates, airtightness 0.6 ACH50.
 components under operation
 Craft, third-party quality
 Based on economic analysis, “cost-competitive”
 assurance/quality control, including
 level. Climate-specific limits on heating and Annual source energy limit,
Proposed for Next airtightness test and full commissioning
 cooling demands and loads. Peak heat load Mostly per person based for
 Generation of systems with verification of actual
 ~77% reduction, annual heating ~86% reduction performance residential, floor area based
 (2015) energy use of components under
 from 2009 BA benchmark. Peak cooling ~69%, for nonresidential
 operation, post commissioning after 1
 annual cooling ~46% reduction.
 year of occupancy

 7
1.2 Objectives
The objectives of this study were to:

 • Validate the proposition that climate-zone-specific energy-performance criteria for
 heating and cooling can guide designers toward cost-competitive levels of investment in
 passive measures in balance with other conservation measures and renewables.
 • Develop simplified formulas that are suitable for inclusion in building energy modeling
 and verification software to set the criteria based on local climate parameters with a quick
 calculation (as opposed to a full life cycle analysis for each project).
1.3 Main Issues
In 2007, PHIUS started to promote and apply the European energy metrics in all climates of the
United States and Canada. Since then more than 100 projects that meet those criteria have been
completed. Two main issues were identified and are discussed in Section 1.3.1 and Section 1.3.2.
1.3.1 A Different Cost Structure Implies a Different Economic Optimum
In the climate of central Europe, the relationship between the annual demand and low peak load
was such that a building that achieves 15 kWh/m2/year (4.75 kBtu/ft2/year) annual heating
demand would generally meet the peak load definition of 10 W/m2 (3.17 Btu/ft2/year).
Furthermore, it was found or claimed that the level of envelope investment needed to achieve
this performance was cost-competitive, even roughly cost-optimal—marking the point where one
could “tunnel through the cost barrier” to higher performance (Laustsen 2008). The phrase
“Tunneling through the cost barrier” implies saving enough cost on the mechanical and heat
distribution systems to offset the increased investment in the envelope and enclosure. This offset
principle has been a key argument for the concept in Europe.
In North America the effect of tunneling through the cost barrier could not be observed. Taking
some cost out of the heating and cooling system and putting it into the envelope is a valid
concept, but savings were less significant for the following reasons:

 • Unlike Germany, the United States and Canada do not have such a clear breakpoint at
 which an expensive baseline boiler and hydronic distribution system (the typical heating
 system in Europe) can be eliminated for great savings.
 • Specialty small-capacity heating and cooling devices provide little cost savings relative to
 high-capacity commodity equipment.
 • Fuel prices are generally much lower in the United States, which further weakens the
 argument of cost per kilowatt-hour saved. The reality of the different cost picture in
 North America must be acknowledged.
The European cost-effectiveness model did not take the cost of PV into account. At the time the
standard was formulated, PV was very expensive and not considered cost-competitive.
Therefore, the standard’s cost-effectiveness argument does not take the goal of achieving zero
energy—or the necessary investment—into account. The cost graph shown in Figure 3 is based
on PHI data. It shows cost increasing exponentially once PV is added and after 15 kWh/m²-yr
annual heat demand is met. The price of PV has decreased significantly over the past decade and
can be considered (as BEopt and ZERH do—see Figure 4) to determine the point of diminishing
returns on conservation measures. The space-conditioning criteria for passive buildings should

 8
reflect an economical balance between conservation and generation measures on the path to zero
energy.

 Figure 3. European cost graph

 Source: Laustsen (2008), used with permission

Furthermore, PHI’s definition of Passive House includes a 10 W/m2 peak heat load, which
translates into 15 kWh/m²/year in the central European climate (PHI 2014). “Supply-air-heating-
sufficient” everywhere implies that the building assemblies must be sized to a predefined and
very small heating system instead of the other way around. The principle of “everybody has the
same size minimized heating source” is a misapplication of the idea of a fair share. That
principle properly applies to the total source energy but not to space conditioning. Instead, the
fairness or leveling principle for space conditioning is economic competitiveness, which leads to
varying energy measure performance criteria. Passive House can be defined as design for peak
load 10 W/m² or by an economic optimum but not both and not everywhere at once.
Therefore, taking into account North American construction costs, energy cost parameters, the
cost of PV, and different levels of investment required by climate will result in cost-competitive
climate-specific space-conditioning criteria that are different than 10 W/m2 or 15 kWh/m2/year
(3.17 Btu/ft2/h or 4.75 kBtu/ft2/year).
1.3.2 Interaction of Criteria and Climate Misled Designers
The relationship between degree-days and peak design temperature varies by climate; these
variables are weakly correlated. Away from the coasts, peak design conditions are relatively
harsh compared to degree-days. The annual heat demand criterion is almost always easier to
meet than the peak load criterion and almost always used. Among current PHIUS-certified and
precertified projects, the annual-demand route was taken 92% of the time outside the marine

 9
climate zones (3C and 4C) and 42% of the time within the marine zones. Because the solar
resource is generally greater in the United States than in central Europe, annual demand can be
lowered with solar gains. This leads designers back toward overglazed designs, large interior
temperature swings, and overheating issues.
A survey of certified and precertified projects showed that designers were led to rather high
concentrations of glazing on south façades in colder climates (see Table 2).

 Table 2. South Glazing Concentration by Zone, Certified and Precertified Projects

 Median South Window
 Climate Zone
 Area Concentration
 2 8%
 3 36%
 4 50%
 5 54%
 6 68%
 7 86%

1.4 North American and European Climate Comparisons
Peak heating load conditions are harsher—relative to annual demand—in much of North
America than in Europe. Although the design for low peak load delivers the comfort and passive-
survivability benefits, the annual energy savings must repay that investment. Therefore, where
the annual demand is low relative to the peak or the peak is harsh relative to the annual demand,
the economics of a design for low peak load (e.g., “supply air heating sufficient”) are even more
challenging.

Table 3 through Table 7 show some examples of these patterns. PHI literature usually quotes
–10°C/14°F as a peak load design temperature for central Europe; that corresponds to the
ASHRAE 99.6% design temperature for that region. The following is a comparison of climates
on that basis (data taken from ASHRAE 2013).

On the East Coast of North America (Table 3), Boston (climate zone 5A) is similar to Frankfurt,
Germany (climate zone 5) for annual demand as indicated by heating degree days (HDDs,
highlighted in red) but has a harsher peak load condition. Peak load conditions comparable to
Germany occur further south in Baltimore and New York (climate zone 4A, highlighted in blue).

 Table 3. Design Temperatures and Degree Days, North America, Coastal, East

 ASHRAE 99.6% ASHRAE 99%
 Cities Design Design HDD65 CDD65*
 Temperature (°F) Temperature (°F)
 Frankfurt, Germany (5) 14.5 19.1 5,570 308
 Boston, MA (5A) 8.0 13.0 5,596 750
 Baltimore, MD (4A) 14.0 17.9 4,552 1261
 New York, NY (4A) 13.8 17.8 4,843 984
* Cooling degree days, base 65°F

 10
The Northwest coast/Pacific Northwest has the peak-versus-annual relation closest to Europe
(Table 4). The peak is milder at comparable annual demand. Seattle and Portland have milder
peak and annual demands. Prince Rupert, which is further north, has a peak load that is
comparable to Frankfurt.
 Table 4. Design Temperatures and Degree Days, North America, Pacific Northwest

 ASHRAE 99.6% ASHRAE 99%
 Cities Design Design HDD65 CDD65
 Temperature (°F) Temperature (°F)
 Frankfurt, Germany (5) 14.5 19.1 5,570 308
 Squamish, BC (5) 18.3 22.4 5,987 115
 Portland, OR (4C) 25.2 29.5 4,214 433
 Prince Rupert, BC (6) 13.3 18.4 6,993 1

In the midcontinental United States, places with similar HDDs to Germany have much harsher
design temperatures. In the East and Midwest, one needs to go south almost to Nashville,
Tennessee, to find comparably mild peak conditions (Table 5). That region’s annual demand is
substantially lower.

In the West the situation is the same—places with similar HDDs to Germany have much harsher
design temperatures—but the design conditions moderate more slowly going south. One has to
go south almost to Lubbock, Texas, for a comparably mild heating peak (Table 6). This far
south, savings for cooling could also help the payback. Cooling-dominated places face a similar
situation for a different reason: in the BEopt studies described in this report, the passive
measures such as overhangs and thermal mass that are good for reducing peak cooling did not
competitively deliver annual savings versus mechanical cooling. For example, overhangs cost
$20/ft2 and for the price of one 10-foot overhang an air-to-air heat pump takes care of the entire
cooling problem.
 Table 5. Design Temperatures and Degree Days, United States, Midcontinent, East

 ASHRAE 99.6% A SHRAE 99%
 Design Design
 Cities HDD65 CDD65
 Temperature Temperature
 (°F) (°F)
 Frankfurt, Germany (5) 14.5 19.1 5,570 308
 Pittsburgh, PA (5A) 5.2 9.9 5,583 782
 Indianapolis, IN (5A) 2.0 8.1 5,272 1,087
 Decatur, IL (5A) 0.9 6.6 5,442 1,100
 Louisville, KY (4A) 10.2 15.9 4,109 1,572
 Nashville, TN (4A) 14.8 19.3 3,518 1,729

 11
Table 6. Design Temperatures and Degree Days, United States, Midcontinent, West-Central

 ASHRAE ASHRAE 99%
 99.6% Design Design
 Cities HDD65 CDD65
 Temperature Temperature
 (°F) (°F)
 Frankfurt, Germany (5) 14.5 19.1 5,570 308
 Denver, CO (5B) 0.5 6.6 5,969 777
 Kansas City, MO (4A) 2.0 7.2 5,012 1,372
 Amarillo, TX (4B) 9.8 15.6 4,102 1,366
 Lubbock, TX (3B) 15.9 19.9 3,275 1,846

In the Midwest north of Indianapolis conditions are even harsher. Madison, Wisconsin, has
harsher peak conditions than Oslo, Norway (Table 7). Scandinavian Passive House certifiers
moderated their peak load criterion to 15 W/m2 (4.76 Btu/h/ft2) (Jacobson 2013).
 Table 7. Design Temperatures and Degree Days, United States, Midcontinent, North

 ASHRAE 99.6% ASHRAE 99%
 Cities Design Temperature Design Temperature HDD65 CDD65
 (°F) (°F)
 Frankfurt, Germany (5) 14.5 19.1 5,570 308
 Oslo, Norway (6) –4.2 0.7 8,855 40
 Madison WI (6A) –7.0 1.6 7,104 620

In conclusion, the attempt to meet the European energy metrics in North American climates has
forced solar-driven designs that tend to overheat and incur very high cost premiums for required
envelope upgrades. Attempting to meet the annual criterion with higher R-values and less solar
contribution—or attempting to reach the supply-air-heating sufficient peak load definition (10
W/m²)—would drive the cost premium even higher. Both options would require considerable
additional investment in the envelope (2 feet or more of typical R-4 wall insulation in very cold
climates for smaller scale residential projects). Such investment at the current state of technology
is neither practical nor cost-effective. The diminishing return for energy savings in such super-
insulated walls that are required to meet the current criteria are also significant (see Figure 4).

Straube (2009) critiqued PHI’s standard. Although this article contained some
misunderstandings, its basic point was accurate: in ASHRAE climate zones 5 through 7 in North
America the current European standard and its metrics are generally not economically justifiable.
This study is a response to that and other similar unpublished critiques.

 12
You can also read