Ireland's Housing Emergency - Time for a Game Changer - The Nevin Economic ...
←
→
Page content transcription
If your browser does not render page correctly, please read the page content below
NERI Working Paper Series

              Ireland’s Housing Emergency -
                 Time for a Game Changer

                Tom Healy and Paul Goldrick-Kelly

                                  March 2017

                          NERI WP 2017/No 41

For more information on the NERI working paper series see: www.NERInstitute.net
PLEASE NOTE: NERI working papers represent un-refereed work-in-progress and the
author(s) are solely responsible for the content and any views expressed therein.
Comments on these papers are invited and should be sent to the author(s) by e-mail. This
paper may be cited.

                                                                                      1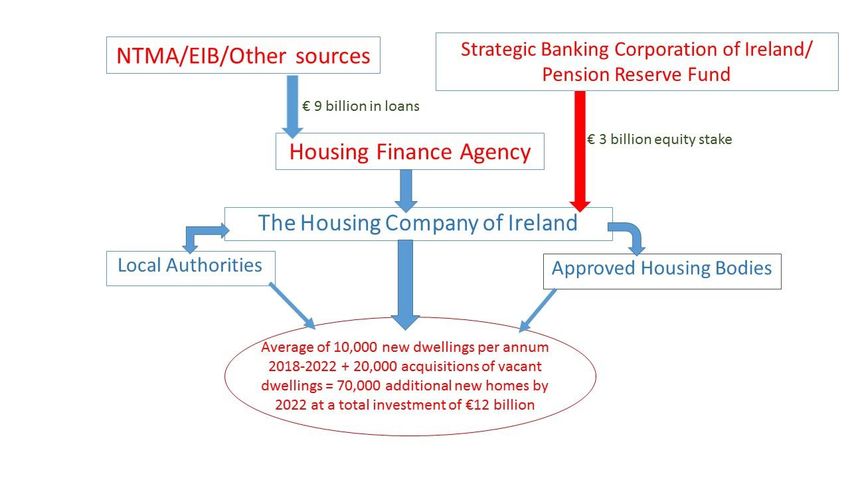
Ireland’s Housing Emergency -
Time for a Game Changer
Tom Healy and Paul Goldrick-Kelly*
Keywords: Housing
JEL Codes: R21, R31, R42
ABSTRACT
Lack of access to affordable quality homes constitutes a significant crisis for workers,
families and communities in the Republic of Ireland. Current Government plans appear
to be insufficient to make a significant impact. Pressure and strain on individuals and
families is a direct consequence of under-investment over many years as well as a failure
on the part of a market-led and property developer-led model of housing to deliver
enough houses to meet the demands of a growing population. We propose a carefully
planned programme to construct 70,000 new homes in addition to the existing stock of
normally occupied housing in the Republic of Ireland. A key part of this plan is the putting
in place of a European Cost Rental Model (ECRM) on lines already outlined by the National
Economic and Social Council (NESC) and referred to in a recent report of the Oireachtas
Committee on Housing and Homelessness. The optimum solution, we propose, is the
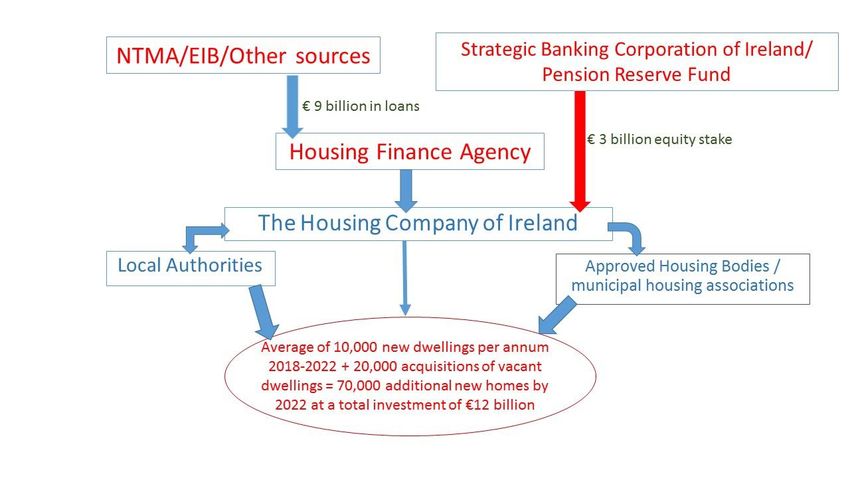
establishment of The Housing Company of Ireland which will draw on long-term
borrowing combined with an equity injection from the Ireland Strategic Investment Fund
and undertake or commission, on a commercial basis, a programme of planning, building,
acquiring and renting of new homes. This investment will supplement and further
strengthen that of the Local Authorities as well as the voluntary housing associations in
the area of social housing. The figure, below, summarises some of the key features of the
ECRM.
* The authors wish to thank NERI colleagues and a number of other researchers for advice and assistance
in relation to this paper. Any errors are entirely our responsibility. Further observations and comments
on this working paper are welcome. These can be directed to the authors: tom.healy@NERInstitute.net
and/or PaulGK@NERInstitute.net
2
A self-funding European Cost Rental Model (2018-2022)
3Table of Contents
ABSTRACT ........................................................................................................................................................................... 2
A self-funding European Cost Rental Model (2018-2022) .............................................................................. 3
LIST OF TABLES ................................................................................................................................................................ 6
LIST OF FIGURES .............................................................................................................................................................. 7
1 INTRODUCTION....................................................................................................................................................... 8
2 THE NATURE AND EXTENT OF THE HOUSING CRISIS ....................................................................... 11
2.1 Housing output and stock since the 1990s ...................................................................................... 11
2.2 Land supply and building costs ............................................................................................................ 14
2.3 Demand for housing .................................................................................................................................. 20
2.4 Public expenditure on social housing ................................................................................................ 24
2.5 Affordability ................................................................................................................................................. 27
2.6 Social and economic implications of the housing crisis ............................................................. 30
3 REASONS FOR THE CRISIS ............................................................................................................................... 31
3.1 Failure of previous and current Government housing strategies ............................................... 32
3.2 Supply is the key issue but further increases in demand are likely to exacerbate the crisis
.......................................................................................................................................................................................... 35
3.3 Ownership and management of land is a key factor in the crisis ................................................ 39
4 LESSONS FROM OTHER JURISDICTIONS ................................................................................................... 40
4.1 Introduction ................................................................................................................................................. 40
4.2 Public Facilitation of Social Housing Finance ................................................................................. 42
4.3 Various European Rental Models ........................................................................................................ 44
4.4 Some possible European lessons ......................................................................................................... 47
5 HOW A EUROPEAN COST RENTAL MODEL COULD WORK IN THE REPUBLIC OF IRELAND
49
5.1 Introduction ...................................................................................................................................................... 49
5.2 How many new dwellings are needed?.................................................................................................. 50
5.3 Funding a European Cost Rental Model (ECRM) ............................................................................... 51
5.4 Operating a European Cost Rental Model and other measures ................................................... 57
5.5 How the new model could have a long-term impact on the housing market......................... 60
6 CONCLUSIONS ....................................................................................................................................................... 62
7 REFERENCES ......................................................................................................................................................... 64
8 Appendix.................................................................................................................................................................. 71
8.1 Setting Cost Rent ............................................................................................................................................... 71
8.2 Setting Paid Rent and Housing Assistant Payment Calculation ..................................................... 75
45
LIST OF TABLES
Table 1 Number of habitable housing units by type of ownership and use in 2011
Census               12
Table 2 Changes in the Habitable Housing Stock 2011-2016 ............................................... 13
Table 3 Cost of Delivery for 3 Bedroom, Semi-detached House Dublin 2016 ...................... 17
Table 4 Zoned land supply within selected Local Authorities 2014 .................................. 20
Table 5 New Housing: Supply and Demand trends according to ESRI research ........... 23
Table 6 Households accessing local authority managed emergency accommodation in
July 2014 and January 2017 .................................................................................................................... 33
Table 7 Social Rented Housing Stock .............................................................................................. 41
Table 8 Public Financial Supports for Social Housing Construction .................................. 42
Table 9 Social Rental Models ............................................................................................................. 46
Table 10 Example 1 - Representative Cost Rent for Full Mortgage at various Cost levels
............................................................................................................................................................................. 72
Table 11 Example 2 - Representative Cost Rent for 90% Mortgage, 10% CALF at various
Cost levels ....................................................................................................................................................... 73
Table 12 Example 3 - Representative Cost Rent for 70% Mortgage, 30% CALF at various
Cost levels ....................................................................................................................................................... 74

                                                                                                                                                                             6
LIST OF FIGURES
Figure 1 Construction Activity- Completions (as measured by ESB connections)
Annual Units................................................................................................................................................... 14
Figure 2 Supply of Serviced Land and Estimated Housing Units Deliverable on that Land
2000 to 2012.................................................................................................................................................. 19
Figure 3 Trends in public spending on housing and related community amenities (€
millions in 2010 constant prices) .......................................................................................................... 24
Figure 4: Real General Government Expenditure Components of Housing Development
and Social Protection related to Housing (COFOG) in Millions of Euro at 2010 prices. ... 25
Figure 5: Comparison of Combined Housing Development and Social Protection
Payments related to Housing (COFOG) relative other European Countries as a
percentage of GDP in 2014 ....................................................................................................................... 27
Figure 6 Ratios of House Prices to Average Annual Earnings for Full-time Equivalent
Employees ....................................................................................................................................................... 28
Figure 7 Average Monthly Rent as a Percentage of Average Monthly Earnings ................. 29
Figure 8 Trends in Possession of Properties by Lenders ......................................................... 30
Figure 9 Composition of Total Occupied Housing Stock Census 2011 ................................ 35
Figure 10 Composition of ‘house completions’ over time ...................................................... 36
Figure 11 A self-funding European Cost Rental Model (2018-2022) ................................ 55
71 INTRODUCTION
Lack of access to affordable quality homes constitutes a significant crisis for workers,
families and communities in the Republic of Ireland.
Some sense of the social crisis in accommodation is given by the most recent data on
rental accommodation. According to DAFT (2017:6) just under 4,000 dwellings were
available for rent on 1st February 2017 compared to 23,000 in 2009. Average rents now
exceed those of 2008 while they increased at an annual rate of over 13% in 2016.
While much progress had been made over the decades with dramatic improvements in
conditions of accommodation, far too many families and individuals live in unsuitable and
sub-standard accommodation across Ireland.
Difficulty of access to housing, quality of housing – especially rented – and affordability
of rented accommodation were key trigger points for the period of social class conflict in
1913 in Ireland and in subsequent years. A housing crisis was an important backdrop for
the 1916 rising in Dublin. Huge efforts were made in the years following World War 2 to
build new local authority housing in the new Republic of Ireland. Rising population and
conservative fiscal policies in the 1950s laid the basis for housing shortages in the 1960s
followed by intense social protest into the early 1970s (refer to Giblin, Kennedy and
McHugh, 1988 for discussion of fiscal policy in the 1950s).
Recent decades have seen a shift in local authority and, more broadly, social housing
policy. Social housing is increasingly seen as a route to home ownership and has been
promoted, explicitly, as a social policy goal. In the Republic of Ireland, this was
legislatively established in the 1966 Housing Act which applied right to buy provisions to
the urban social housing sector that had previously been confined to rural tenants (Norris
and Fahey, 2011). The rise of a neo-liberal political philosophy and financialisation of the
housing market in the preceding decades provides an important context. A severe cut in
public investment in social housing and an increasing emphasis on private sector led
provision (Kitchen, Hearne and O’Callaghan, 2016) laid the basis for an acute crisis in the
housing sector.
In this paper, we argue that policy makers and civil society organisations need to rethink
social housing models and consider the adoption of European norms of mixed-income
renting provided by public enterprises that are funded and operated where possible ‘off-
8the-books’ in a way that does not add to General Government expenditure or debt. ‘Social
housing’ is one important component of the overall housing picture. Though definitions
and understandings vary, social housing typically refers to all types of accommodation or
assistance provided by the community for persons who, by reason of health, economic or
social circumstances might otherwise find it exceptionally difficult to access
accommodation1.
Considering long-term patterns of household formation and distribution of income it is
clear that there is a need for some form of ‘social housing’ on a scale required to meet
demand and avoid further increasing household poverty or homelessness. However, we
suggest that the model of social housing needs to be re-thought. The construction of
dedicated estates including blocks of apartments or dwelling units to cater for low income
groups has failed in the past notwithstanding certain ex post public interventions that
have effectively reduced social disadvantage in certain estates (Fahey, Norris, McCafferty
and Humphreys, 2011). A social stigma or ‘ghettoisation’ of social housing associated
with particular social, migrant or family structured groups has reinforced a widespread
view that people, if they can afford to, should not only aspire to owning their own homes
but move up an invisible social ladder to socially homogenous locations. The result is
that social divides are further increased along class, ethnic or age grounds. There were
other challenge posed by traditional models of local authority provision including poor
maintenance and a lack of integration of housing policy with planning.
The solution to the housing crisis will involve a combination of actors and policies.
However, to succeed it will require a high degree of societal and political consensus that
the solution to this problem necessitates a ‘whatever-it-takes’ approach. The right to
shelter and a home has touched the minds and hearts of a large number of people in
recent times not least because of particular civic protest movements – suggesting the
existence of a widespread sense of compassion and justice which is to be welcomed. That
there is a crisis of housing may very well signal a deeper crisis of public values and choice
in so far as the balance between private and public interest has been too far weighted
towards the private.
1The term ‘social housing’ is a relatively modern term and is used to describe local authority and other
not-for-profit housing activity under the same concept and measure.
9We understand accommodation to be a fundamental human right and obligation shared
by individuals, communities and societies. The first social priority ought to be the
protection of the right to a home as well as the right to affordable rent in the case of rented
property. Failure to respect and vindicate these rights will only add to the crisis and
create new negative pressures somewhere in the system of demand for accommodation.
This paper considers the nature and extent of the housing crisis in the next section. The
reasons for the crisis are considered in Section 3 while possible lessons and policy
solutions in a selection of other European countries are outlined in Section 4. Section 5 of
this paper proposes and elaborates a European cost rental model of housing adapted to
the organisational and financial circumstances of the Republic of Ireland at this time.
Section 6 concludes.
102 THE NATURE AND EXTENT OF THE HOUSING CRISIS
A crisis in housing is characterised by an acute and enduring shortage of appropriate
housing given current and emerging patterns of demand for accommodation in the
Republic of Ireland. The evidence reviewed in this Section points to a systematic
imbalance in housing supply and demand with rising levels of homelessness and a
gathering crisis of affordability for individuals and households. In this Section we review
various dimensions of housing supply and demand while leaving an analysis of the
underlying causes to Section 3.
2.1 Housing output and stock since the 1990s
Housing – whether rented or owned – consumes, for most people, a large amount of
income over their lifetime which is why most owners of houses take out mortgage loans
to meet the upfront purchase price which may be a multiple of their normal annual
income. Housing takes on many roles at one and the same time. A house may be a:
place or a home where people live.
form of wealth or asset along with other forms of wealth.
In practice people often combine investment and home functions of housing at the same
time. Buying a home means that one can live in it and at the same time have the option of
selling it to pay for nursing care in the long-term should that need arise. Given the very
incomplete nature of social provision for health and income protection over the lifecycle
some people, in Ireland, treat the value of their home as the backstop or insurance against
large foreseen or unforeseen costs as personal circumstances change. The thrust of public
policy and the spread of a culture of housing as an investment good has shifted the
balance of the housing market away from a social activity related to providing homes to
an investment activity driven by profits as well as expectations of capital gains or income
from renting. Allied to this, a policy of relative non-intervention in relation to the price
and availability of land has strengthened the market power of private developers and
builders at the expense of social considerations or the wider common good.
In 2016, there were an estimated 2,022,895 habitable housing units including vacant or
unused properties in the Republic of Ireland (Central Statistics Office, 2016). Table 1
11provides a breakdown of housing by ownership and use drawing on data from the 2011
census2
Table 1 Number of habitable housing units by type of ownership and use in 2011
Census
Occupancy Status Housing Units
Owner Occupied with a Loan or Mortgage 583,148
Owner Occupied without a Loan or 566,776
Mortgage
Owner Occupied Total 1,149,924
Rented from a Private Landlord 305,377
Rented from a Local Authority 129,033
Rented from a Voluntary Body 14,492
Rented Total 449,352
Occupied Free of Rent 25,436
Other 24,696
Total Occupied by Persons Normally 1,649,408
Resident in the State
Occupied by a non-resident 10,703
Temporarily Unoccupied on Census night 45,283
Not occupied on Census night 289,451
Total Housing Stock on Census Night 1,994,845
Source: Census of Population 2011 Profile 4 – The roof over our Heads (Central Statistics Office, 2012)
Approximately 70 % of habitable housing units were owner occupied in 2011,
corresponding to about 58 % of the overall stock. Twenty seven % of the active stock
was taken up by rental dwellings, of which a little under a third could be counted as social
housing units3. The proportion of owner-occupied housing has fallen in recent years and
is now close to the average for the 28 member-state European Union.
Preliminary results from the latest census in 2016 are shown in
2Full data from Census 2016 have not, at the time of writing, been released.
3This corresponds with the local authority and voluntary housing stock as enumerated here. See section
4 and associated footnotes for definitional discussions.
12Table 2. Total estimated housing stock increased by just under 19,000 between 2011 and
2016 – indicating an annual average increase of just under 4,000. The number of
occupied dwellings increased by 3% while the number of unoccupied dwellings fell over
the same period. The increase in the stock of occupied dwellings was broadly in line with
population growth (which was 4%). The stock of habitable vacant dwellings has
substantially decreased by almost 14% between 2011 and 2016.
Table 2 Changes in the Habitable Housing Stock 2011-2016
Occupancy Status 2011 2016 % Change
Housing stock 2,003,9144 2,022,895 0.9
Occupied households 1,669,180 1,718,465 3
Temporarily absent 45,283 44,868 -0.9
Vacant holiday homes 59,395 61,204 3
Other vacant dwellings
(Habitable) 230,056 198,358 -13.8
Source: Census of Population 2016- Preliminary results - Housing (Central Statistics Office, 2016)
Figure 1, below, displays reported construction activity between 1994 and 2016.
According to these statistics, building activity peaked in 2006 at over 93,000 units and
fell back sharply to around 8,300 units per annum in 2013 (Department of Housing,
Planning Community and Local Government, 2017a). It should be noted that these data
are based upon new electricity connections recorded monthly and includes reconnection
of buildings that were not connected for two years or more. The rate of house
completions as proxied by ESB new connections or reconnections is likely to flatter
estimates of newly built units.
4It appears that some revision of census 2011 data occurred. As a portion of the stock however, this
change is negligible.
13Figure 1 Construction Activity- Completions (as measured by ESB connections) Annual
Units
100,000
90,000
80,000
70,000
60,000
50,000
40,000
30,000
20,000
10,000
0
Source: National New House Completions by month (Table A1) (Department of Housing, Planning
Community and Local Government, 2017a)
Net changes in the housing stock reflect changes that augment the existing stock. This
corresponds to the difference between additions to habitable stock in the form of new
buildings, conversions of existing buildings not currently in residential use and,
retrofitting and restoring of buildings that have fallen out of residential use, on the one
hand, and residential obsolescence flows as a result of dwellings becoming inhabitable
for one reason or another on the other. We estimate the annual average rate of
obsolescence to be in the region of 0.2-0.5% of total housing stock in any one year, which
falls in a range used by most analysts in their forecasts as well as estimates derived from
published data of the Department of Housing, Planning Community and Local
Government (Housing Agency, 2014 and 2017)5. This implies that, given estimates of a
housing stock of just over 2 million units, between 5,000 and 10,000 units are withdrawn
annually from the total stock of habitable dwellings.
2.2 Land supply and building costs
5 Or simply ‘Department of Housing’ for short and for the rest of this document
14Costs of associated with construction and development are frequently cited as a key
constraint on output (Lyons, 2015 and 2016). Caught between a slow recovery in house
prices and high costs many builders and developers have insufficient profit margins to
build, it is suggested. More empirical evidence would be needed to test these claims.
Missing from the debate is a thorough analysis of the price of land and how it may impact
on overall cost and supply of housing. Comparisons of costs, internationally, are not
readily available. However, in a submission to the Oireachtas by the UNITE trade union it
cites no evidence that construction costs including labour and materials are out of line
with those in similar Northern European economies. Hourly labour costs in the
construction sector were found to be broadly in line with those in comparable Eurozone
countries (UNITE, 2016).6
The National Economic and Social Council has made the case for an integrated approach
to containing costs rather than a piecemeal approach on one aspect of cost NESC, 2015).
For example, a lowering of development cost levies on developers might transfer too
much of the necessary cost of investing in infrastructure to the public purse especially
where local or central government is constrained by budgetary rules or limits. Adoption
of Building Information Modelling (BIM) technology could help reduce costs and improve
productivity in an industry generally characterised as low-productivity. BIM provides 3-
D technology to improve information flow between design and construction and could
lower costs and improve quality of delivery and design (see Stewart, 2016 for more
information on BIM).
A number of methodological approaches exist for tracking changes in cost of construction
and finalisation of building. No comprehensive index of construction costs is available. It
is very surprising that there is no comprehensive time series data on development land
prices. This gap in vital information relevant to housing policy ought to be rectified by the
appropriate bodies.
A detailed breakdown of costs for constructing a three-bedroom semi-detached house
has been provided by Walsh and Associates (2012). This shows a breakdown of costs for
a typical build as follows: cost of house at €91,598, external works at €11,173, site
development plus indirect site costs at €26,903, Other costs such as financial
6 Data source: Online Eurostat databank – ‘Labour cost levels by NACE Rev. 2 activity [lc_lci_lev]’
15Contributions and Local Authority Bond, ‘Part V’7 contribution to Local Authority, show-
house, advertising and marketing, sales and legal Fees, consultant design fees, site and
building finance at €41,700 and, finally, an assumed profit margin of €25,706 (or 15%).
Adding the various parts gives an estimate of overall cost at €197,080. The latter figure
does not include the cost of land or the application of a VAT rate of 13.5% on the sale of
newly built property. Lyons (2015) has cited various costs estimates to claim that costs
have increased significantly between 2009 and 2014 due, in the main, to regulatory
changes and greater energy efficiency requirements. He argues for containment of costs
as the primary route to encouraging greater supply. Reform of the regulatory application
process is not, in his view, a significant means to change supply. Rather, it is suggested
that reducing the cost of regulation is a key element of a pro-supply strategy.
The availability and cost of land for housing or commercial property development is a
vital part of the general housing jig-saw. This is especially so in urban, suburban and near
suburban areas where land transactions, over the decades, have yielded high returns to
those selling land for development. A key development in land ownership has been the
divesting of publicly-owned land for development since the 1970s. According to Casey
(2007) around 30% of zoned building land was owned by local authorities in the Dublin
area in the 1970s. This proportion fell to 9% in 2006 just prior to the crash. Whereas, in
the past, local government exerted some influence and market power in relation to
transactions in zoned land, power decisively shifted to developers in more recent times.
Driven by a narrow agenda of profit maximisation rather than a broader range of social
and planning objectives, the concentration of ownership of building land in the urban
areas including Dublin and Cork together with insufficient planning, control and delivery
by local authorities has added to the supply crisis in the major cities. The ‘Kenny Report’
issued in 1973 recommended that the price of rezoned land should be limited to 125% of
the price of agricultural land (Government of Ireland, 1973). Failure to implement this
7Part V refers to Part V of the Planning and Development Act 2000. This set out that up to 20% of all new
housing developments were to be reserved for social and affordable housing. A review carried out by the
Department for Local Government and the Environment in 2012 showed that less than 5% of ‘Part V’
planned housing provision over 2002-2011 was delivered (DKM Economic Consultants and Brady,
Shipman, Martin, 2012).
16proposal which met with political objections8 played a part in the property bubble and
subsequent crisis of 2008-2013.
The supply and cost of land for residential building is an important part of the story on
housing supply. A survey undertaken by the Society of Chartered Surveyors in May 2016
(Table 3) showed that the typical land acquisition cost associated with a three-bedroom
semi-detached house in the Dublin area was €57,500 or approximately 17% of the
estimated average cost of delivery given as €330,500.
Table 3 Cost of Delivery for 3 Bedroom, Semi-detached House Dublin 2016
Component of Euro Cost per Percentage of
Total Cost in Euro
Cost Square Metre total Costs
Construction 150,251 1,332 45
Professional Fees, 25,450 226 8
Levies and Sales
and Marketing
Costs
Finance Cost 20,002 177 6
Land and 57,500 510 17
Acquisition Costs
Margin 37,980 337 12
VAT 39,310 349 12
Total 330,493 2,930 100
Source: The Real Cost of New House Delivery – Analysis of Real Market Data to Evaluate Viability and
Affordability of New Housing Development (Society of Chartered Surveyors Ireland, 2016)
Clearly, the price of land and the final cost of a new house will vary greatly by location
within Dublin as well as across the State. The estimate of land cost was set at €510 per
square metre which, together with an assumed 10% social housing provision and
associated transaction costs brings the overall estimate of land and associated costs to
8Though it has been claimed the measures might be unconstitutional the matter appears to never been
tested in the courts. If it were and found to be an obstacle, then a constitutional amendment could be
considered.
17€57,500. However, the Society report concedes that this site cost estimate is ‘considered
substantially less than the market value of sites in some Dublin suburbs’.
The Society also observes (Society of Chartered Surveyors Ireland, 2016:6) that:
Government has already sought to introduce measures to encourage the best use of
land, including the Vacant Site Levy, which will become effective in 2018, with a view
to charging the owners of unused development sites. In light of the viability issues
illustrated by our study, the fact that the tax penalty will not arise until 2018 may
not bring forward any additional land or housing supply. As development land prices
have started to increase again while the viability of developing sites has reduced, it
is clear that some land owners have decided they have no option but to retain their
land. Land hoarding is a term commonly used as a factor in our deficient housing
supply.
The Report goes on to note that:
The sale of large land portfolios to single asset fund buyers has meant fewer
transactions and opportunities for local developers to participate in the market.
Figure 2 and Table 4 provide data on the amount of zoned land within the state and
selected Local authorities over time. Figure 2 shows a generalised increase in “serviced
land” between 2000 and 2010, where supply (and estimated housing unit potential)
reached its maximum. It declined substantially between 2010 and 2012 although land
stocks remain significant.
An audit, in 2010, of undeveloped residential land held by local authorities in 2010
identified 775 hectares of land purchased on which little or no prospective development
appeared forthcoming. The outstanding loan value on these sites was approximately
€500 million, owed by Local Authorities to the Housing Finance Agency (HFA).
The Land Aggregation Scheme (LAGS) was established under the aegis of the Housing
Agency to alleviate the burden of these loans that were traditionally redeemable from the
Department of Housing, Planning, Community and Local Government upon site
development for social housing. Under this scheme, Local Authorities could (for a
nominal fee of €1) transfer development land on which loans to the HFA were
outstanding. LAGS was closed in 2013 at which point the Department of Housing,
Planning, Community and Local Government had approved 247 hectares between 2010
18and 2013. Outstanding loan principal owed to the HFA by local authorities remains
substantial (Office of the Comptroller and Auditor General, 2016).
Figure 2 Supply of Serviced Land and Estimated Housing Units Deliverable on that Land
2000 to 2012
600,000 25,000
Serviced Land Available for Housing in Hectares
Expected Number of Housing Units from Serviced
500,000
20,000
400,000
15,000
Land
300,000
10,000
200,000
5,000
100,000
0 0
No Of Housing Units Hectares
Source: Supply of Housing Land 2000 to 2012 (Department of Housing, Planning, Community and Local
Government, 2017b and 2017c)
Note: The Department refer to Serviced land as “land that has the necessary water, sewerage, transport or
other services required to bring the land into development and sufficient for planning permission to be
granted and construction to commence” (Supply of Housing Land 2000 to 2012 (frontpage),2017c)
Table 4 provides data on the availability of residential zoned land within a number of
local authorities together with data on the number of potential new dwelling that could
be delivered on those lands. The stock of available development land appears substantial
within a number of sizable metropolitan authorities, with over 27,000 Hectares of zoned
land available within the state.
19Table 4 Zoned land supply within selected Local Authorities 2014
Potential No. of
Local Authority Hectares of Zoned Land
Dwellings
Cork 1,526 27,372
Cork City 79 3,472
Galway 1,266 23,697
Galway City 303 6,317
Limerick 823 20,126
Limerick City 180 6,005
Louth 1,068 28,082
Co. Dublin 2,812 123,451
State 27,363 611,302
Source: Residential Land Availability Survey 2014 – Summary Report (Department of Environment,
Community and Local Government, 2015)
Note: Data refer to undeveloped residentially zoned land. This may not include land serviced with water,
communications, energy, and transport infrastructures as well as other amenities or schools. The
Residential Land Availability Survey replaces data previously tabulated within the Supply of Housing Land
dataset.
We are surprised that there have been no official statistics on land prices in Ireland. This
needs to be addressed as a matter of urgency by the appropriate bodies. How is it possible
to assess underlying housing costs and policy interventions without information on this
vital aspect of the housing market?
As one observer has put it (Sirr, 2016):
We know more about our farm animals than our housing stock. Connection to the
ESB appears to inflate figures.
2.3 Demand for housing
Demand for accommodation – rental or for purchase – changes slowly in line with
demographic shifts and emerging patterns of household formation. Linked to demand are
factors such as transport and availability of key public services and goods. Patterns of
residential living have been shaped by centuries of cultural practice. Typically, much
housing or residential development has been characterised by standalone or ‘one-off’
20housing in rural areas as well as dispersed, low-density suburban sprawl in built-up or
urban areas. Partly due to population density as well as a legacy of under-investment in
public transport, large numbers of people rely on private transport to get to and from
work or places of education and social interaction. Recent decades have witnessed
significant population growth especially in the greater Dublin area and surrounding
counties. Movement of population as well as the arrival of immigrant workers and the
changing patterns of family formation in Ireland have influenced the nature of home
ownership and renting9. A high turnover in rental accommodation as well as mobility of
persons is a feature of life in many places. A legacy of bad planning and distortion of
market prices as a result of tax incentives have provided an incentive for imbalanced and
disjointed housing developments – poorly serviced, badly connected and without proper
social services and amenities. The rise of the ‘Ghost Estates’ in far flung locations with
little or no connection to larger centres in the wake of the crash of 2008 illustrates this.
The Housing Agency (2014) has undertaken a projection of future housing demand based
on population projections published by the Central Statistics Office in 2013. The analysis
took account of the stock of residential housing, obsolescence and household
composition. As remarked above, the Housing Agency, in line with the view of other
analysts, assumed an annual obsolescence rate of 0.5% of total housing stock. In other
words, it may be assumed that approximately 10,000 housing units are rendered obsolete
each year. This rate of withdrawal from the housing stock will require an additional
output flow of 10,000 to meet the current level of demand. Based on estimates of total
housing stock and new completions published by the Department of Housing the implicit
rate of obsolescence seems to be at or slightly less than this rate.
The Housing Agency analysis did not take account of ‘pent-up’ demand resulting from
shortage of supply in years prior to 2014. It should also be noted that realised net
immigration has proven substantially higher than that implied by the projections
produced by the Central Statistics Office in 2013 utilised within this study. Net migration
exceeded standard estimates over the course of 2015 and particularly in 2016 by
9While normally domestically resident population is easier to project, the extent of new arrivals or
departures is harder to predict and is related to many factors including labour market conditions and
matters arising from Brexit or wider EU migration policy.
21substantial margins given unforecastable developments since (Central Statistics Office,
2017).
Research by Duffy, Foley, McInerney and McQuinn (2016) has focussed on the impact of
credit conditions on housing demand. Housing activity may diverge from estimated
demand depending on these conditions. A critical factor in driving demand is the rate of
household formation especially among those aged 25 to 39. They found that, other things
equal, an expansion of 1% in the level of credit leads, in the long-run, to increased housing
activity in the order of 1.3%. They project an increase in household formation rates from
an estimated 16,000 in 2016 to around 32,000 by the year 2024 (peaking at around
36,000 per annum in 2021).
Duffy, et al. (2016:49) project a meeting of supply and demand around 2018 at a level of
27,000 new builds in that year (up from just under 15,000 in 2016). The reader is referred
to Pressures in the housing market may delay household formation to some extent but
growth in demand among the 20-39 year cohort will exert pressures on house supply
over the coming years (Byrne, Duffy and FitzGerald, 2014). Furthermore, unexpected
increases in net inward migration (above those assumed in any of the scenarios by the
Central Statistics Office in 2013 and more recently by the ESRI) will add to the estimated
formation rate.
It is not clear that supply will rise as much as is projected or assumed in the analysis by
the ESRI and summarised in Table 5 above. Moreover, neither the ESRI analysis or the
research commissioned by the Housing Agency in 2014 take adequate account of the
extent of pent-up demand arising from the recent and pre-recession crisis in
accommodation. It is likely that a long period of time will elapse before order and balance
is restored to the housing market. In the meantime, a much stronger, more ambitious and
better funded lead by public agencies is required to break the back of the supply shortage
a matter to which we return in Section 5 of this paper.
Table 5, below. In 2016, total estimated demand was in the region of 26,000 while new
housing output was just under 15,000 per annum according to The Department of
Housing10.
10Although the number of newly built dwellings was likely to be well short of this figure given difficulties
in measuring new building output.
22Pressures in the housing market may delay household formation to some extent but
growth in demand among the 20-39 year cohort will exert pressures on house supply
over the coming years (Byrne, Duffy and FitzGerald, 2014). Furthermore, unexpected
increases in net inward migration (above those assumed in any of the scenarios by the
Central Statistics Office in 2013 and more recently by the ESRI) will add to the estimated
formation rate.
It is not clear that supply will rise as much as is projected or assumed in the analysis by
the ESRI and summarised in Table 5 above. Moreover, neither the ESRI analysis or the
research commissioned by the Housing Agency in 2014 take adequate account of the
extent of pent-up demand arising from the recent and pre-recession crisis in
accommodation. It is likely that a long period of time will elapse before order and balance
is restored to the housing market. In the meantime, a much stronger, more ambitious and
better funded lead by public agencies is required to break the back of the supply shortage
a matter to which we return in Section 5 of this paper.
Table 5 New Housing: Supply and Demand trends according to ESRI research
Source: Chapter 3: Demographic Change, Long Run Housing Demand and the Related Challenges for the
Irish Banking Sector (Duffy, Foley, McInerney and McQuinn, 2016) Figure 3.6 from Ireland’s Economic
Outlook- Perspectives and Policy Challenges pg. 48 (ESRI, 2016)
232.4 Public expenditure on social housing
One of the many challenges in tracking housing activity is to locate consistent, through-
time, trends in public (General Government including local authorities) expenditure on
housing. Eurostat provides a consistent time series for various components of public
spending directly related to social housing (Figure 3 on the following page).
Figure 3 Trends in public spending on housing and related community amenities (€
millions in 2010 constant prices)
€4,000
€3,500
€3,000
€2,500
€2,000
€1,500
€1,000
€500
€0
Gross Capital Formation Investment Grants Other
Source: Classifications of Functions of Government – Division 6 of COFOG and labelled ‘Housing and
Community Amenities’ (Eurostat, 2017a). GDP Deflator is from GDP and main components (output,
expenditure and income) (Eurostat, 2017b).Note: Housing and Community Amenities entails all public
expenditure within the sub-sectoral categories of Housing development, Community development, Water
supply, Street lighting, R&D Housing and community amenities and Housing and community amenities not
elsewhere classified.11 To be noted, this division does not include cash benefits and benefits in kind to assist
households with housing costs. The latter is contained in division 10.6 Social Protection spending related
11 See United Nations (2017) for more detail as to category inclusions.
24to housing. The economic categories presented here relate to Gross Capital spending, investment grants
and the difference between the sum of those categories and total government expenditure, 12
An examination of real public expenditure under the Classifications of Functions of
Government (COFOG) reveals a pattern of sharp decline between 2007 and 2013 in
spending under the heading of Housing and Community Amenities. Between 2007 and
2015, real expenditure fell by nearly 63%, from a high of over €3.5 billion to
approximately €1.3 billion. Gross capital formation by Government fell from almost €2.5
billion in 2007 to just over €600 million in 2015.
The pattern of decline in public spending on housing development (excluding community
amenities) is highlighted even more dramatically in Figure 4 below. It shows a stop in
gross capital formation from 2011 onwards. Overall expenditure during the period of
fiscal austerity collapsed and had not reached, in 2015, its level in real terms twenty years
previously.
Figure 4: Real General Government Expenditure Components of Housing Development and
Social Protection related to Housing (COFOG) in Millions of Euro at 2010 prices.
€3,000 €3,000
€2,500 €2,500
€2,000 €2,000
€1,500 €1,500
€1,000 €1,000
€500 €500
€0 €0
2005 2006 2007 2008 2009 2010 2011 2012 2013 2014 2015
Social Protection-Housing Gross Capital Expedniture
Housing Development Gross Capital Expenditure
Social Protection- Housing
Housing Development
12See Manual on sources and methods for the compilation of COFOG statistics (Eurostat, 2011) for
explanations of economic categories of expenditure.
25Source: Classifications of Functions of Government – Group 6.1 ‘Housing Development’ and Division 10-
Social Protection, Group 10.6 (Eurostat, 2017a)13; Housing GDP Deflator from GDP and main components
(output, expenditure and income) (Eurostat, 2017b).
However, the collapse in public housing investment and related expenditure is paralleled
by a surge in public expenditure under the Eurostat heading of social protection (Also
Figure 4). Included by Eurostat under the heading of housing related social protection
are payments such as Rent Supplement and the Housing Assistance Payment as well as
public subsidies to local authority tenants. Just as Government slashed spending on
housing investment it was forced to increase spending on social assistance directly
related to a worsening housing supply crisis and excess demand for rental
accommodation in particular.14 The mismatch in expenditure trends highlighted in Figure
4 shows how short-sighted and partially self-defeating fiscal austerity measures were in
the period 2009-2013.
Internationally, the Republic of Ireland spends a lot on social protection housing
payments (e.g. Rent Supplement and other subsidies) while spending relatively less on
direct housing development (Figure 5 below)
further illustrates this point. In 2014, combined expenditure on Housing Development
and Social Protection Payments relating to housing exceeded expenditure in all
comparators with the exception of the UK as a percentage of Gross Domestic Product.
2015 data see Ireland fall behind France, though this is likely an artefact of upward
revisions in GDP statistics for that year, which likely bias data downwards in the Irish
case.
13 See United Nations (2017) explanatory note for further exposition of category classifications under
COFOG.
14 As Figure 4 demonstrates, the near extinction of gross capital spending under the category Housing
Development (6.1) in 2011 was accompanied by the appearance of gross capital spending under Social
Protection – Housing. However, even with this expenditure included, capital outlays declined
significantly.
26Figure 5: Comparison of Combined Housing Development and Social Protection Payments
related to Housing (COFOG) relative other European Countries as a percentage of GDP in
2014
Source: Classifications of Functions of Government – Group 6.1 ‘Housing Development’ and
Division 10- Social Protection, Group 10.6 (Eurostat, 2017a)
2.5 Affordability
The notion of affordability is key to a consideration of housing demand and need. A
generally accepted norm in social policy discussions is that housing costs ought not
absorb more than a third of net household income. This is based on the assumption that
housing is of an acceptable and safe standard. In the case of those aspiring or attempting
to buy a house to live in, the ratio of house price to annual typical household income is an
important metric.
27Figure 6 Ratios of House Prices to Average Annual Earnings for Full-time Equivalent
Employees
9.0
8.0
7.0
6.0
5.0
4.0
3.0
2.0
1.0
0.0
2005
2011
1990
1991
1992
1993
1994
1995
1996
1997
1998
1999
2000
2001
2002
2003
2004
2006
2007
2008
2009
2010
2012
2013
2014
2015
Average New build Price to Average Wage Ratio
Average Second Hand Price to Average WageRratio
Source: Average Price of Houses by Area, Quarter and Statistic (Central Statistics Office, 2017b and 2017c)
and Average Annual Wages (Organisation for Economic Cooperation and Development, 2017)
Note: Average wages denote average annual wages per full-time equivalent. This is calculated by dividing
the national accounts wage bill by average number of employees. This, in turn, is multiplied by the ratio of
average normal hours per full time employee to average usual hours of all employees.
The ratio of average full-time equivalent wages to average new build and second hand
housing prices shows substantial growth from 1993 to 2006. In 1993, average newly built
prices were approximately 3.2 times average income, while the corresponding second
hand house price was 3.1 times average income. At their peak in 2006, newly built house
prices were 7 times the level of average income while the corresponding figure for second
hand houses was 8.5. Relative prices fell substantially between 2007 and 2012, reaching
levels comparable to those in the late 1990s. Housing prices have risen faster than
earings since 2012. For the first time since the late 1990s, average new build prices have
exceeded those of second hand dwellings.
28Figure 7 displays quarterly data on average national rents (Daft, 2017) as a portion of
average gross monthly earnings. The graph similarly shows decreases in average rents
consistent with depressed conditions in residential markets following Ireland’s economic
crash. Rental prices have since exceeded 2008 levels as a portion of incomes signalling
rental cost growth well in excess of average earnings growth. The latest data for the last
quarter of 2016 indicate that rents have, on average, exceeded 38 % of average gross
earnings.
Figure 7 Average Monthly Rent as a Percentage of Average Monthly Earnings
41.00%
39.00%
37.00%
35.00%
33.00%
31.00%
29.00%
27.00%
25.00%
Average Monthly Rent as a Percentage of Average Monthly Earnings
Source: Irish Rental Report- Q4 2016 Daft (Daft, 2017), Average Earnings, Hours Worked, Employment and
Labour Costs by Economic Sector NACE Rev 2, Type of Employee, Quarter and Statistic (Central Statistics
Office, 2017c) and Author’s calculations
Information on household repossessions can also give an indication of trends in
affordability. Figure 8, below, shows quarterly trends in properties taken into possession
by lenders from the third quarter of 2009 to the third quarter of 2016. The number of
primary housing dwellings taken into possession by lenders rose by more than 66%
29between the third quarter of 2009 to the final quarter of 2013. The rate of repossession
rose rapidly in subsequent quarters and the number of repossessions occurring in the
quarter three of 2016 was more than twice as high as recorded in the fourth quarter of
2013 from 168 to 421.
Figure 8 Trends in Possession of Properties by Lenders
500
450
400
350
300
250
200
150
100
50
0
Number of Properties Taken Into Possession by Lenders
Source: Residential Mortgage Arrears and Repossessions Statistics: September 2016
(Central Bank of Ireland, 2016)
2.6 Social and economic implications of the housing crisis
The immediate impact of the crisis is seen and felt by families and individuals who
struggle with space, with household budgets, with repairs, with saving, with planning and
with health and well-being. Worry about making ends meet from week to week as well as
plan for a future takes its toll on many families. In the rush to get a foothold in the housing
market, hard-pressed couples locate far from places of work or close family networks.
This may result in long commutes to work and disconnection from networks of support
and engagement. Given the cyclical nature of the housing market and the economy more
generally, households subject to high levels of mortgage debt remain vulnerable to
30macro-economic shocks over time. Those in the private rented sector have been
particularly vulnerable to the pressures of available accommodation and escalation in
rents in line with a crisis of supply as the evidence in this Section indicates.
Set in a wider context, the crisis in housing has implications for labour markets and
inward as well as domestic investment. This is illustrated graphically by the crisis in
supply and cost in areas such as Dublin city where it might be hoped additional
employment and business will be generated in the coming years in financial and ICT
sectors. Availability of accommodation and its cost along with transport connectivity and
local public services is already a key consideration for companies employing high-skilled
professionals and seeking to locate in the Republic of Ireland.
3 REASONS FOR THE CRISIS
That there is a large mismatch between demand and supply is clear to all concerned. The
diagnosis of this mismatch and the offering of policy solutions is not a matter of universal
agreement. Some argue that the cost is too high as a result of which profit margins are
inadequate for builders resulting in a shortage of supply. The argument of a cost-
inhibiting supply constraint leads for calls to reduce important elements of cost including
a reduction in rates of Value Added Tax as well as a lowering of development of ‘Section
V’ levies and contributions by developers.
On the demand side, calls have been made for more financial assistance to households
whether through tax reliefs or direct financial assistance or relaxation in credit rules for
first-time buyers.
Among the supply-side factors cited as possible inhibitors to enhanced housing supply is
shortage of labour skills, availability of lending for developers and builders and lack of
suitable land for development (NESC, 2015a) (Department of Finance, 2015). Added to
these factors it should be borne in mind that fixing the supply of housing will require
careful coordination of a range of social policies including long-term investment in
infrastructure. A surge in new building in north county Dublin where there appears to be
ample zoned land availability might lead to huge additional pressures on public transport
and local public services (education, community healthcare, hospitals, water and waste
services).
313.1 Failure of previous and current Government housing strategies
The publication by the National Economic and Social Council, in 2015, was a landmark
report (National Economic and Social Council, 2015a). Carefully worded and reflective of
the diverse range of interests on the Council of National Economic and Social Council, the
report very clearly pointed up the dysfunctional nature of the housing market in Ireland.
While acknowledging and welcoming positive steps that had been undertaken by the then
Government, NESC provided a menu of public policy actions that were needed to scale up
the level of activity and accelerate building. Looking back at the report which was
published in July 2015 it is evident that its key messages remain highly relevant. There
has been much debate and re-presentation of government targets and action plans. Yet,
the scale and ambition of activity – as noted by NESC almost two years ago – is still lacking.
The main thrust of public policy on housing in the Republic of Ireland has been a marked
reliance on the private sector. House building and development has been led, in the main,
by private developers. Land speculation – notwithstanding much analysis,
recommendation and feeble public interventions – has been a feature of the housing
market for decades. There is no evidence that recent statements of public policy as
outlined in in Rebuilding Ireland (Government of Ireland, 2016a) or in Construction 2020
(Government of Ireland, 2014a) Social Housing Strategy 2020 (Government of Ireland,
2014b) has departed from the traditional reliance on the private sector and market
incentives. Policy has placed the emphasis on public subsidies to private landlords and
plans to leave the lead role to the private sector in building the houses when and where
markets dictate (albeit influenced by regulatory and planning restrictions).
In its report, the National Economic and Social Council (2015:24) commented on recent
Government strategic plans and responses to the housing crisis as follows:
While this constitutes considerable progress, there is still a sense that something is
missing in the scope and scale of the current response so far – namely stronger policy
and executive capacity to undertake a more active and ambitious approach to
housing and land supply management.
The 2016 Programme for Government contains the following commitment:
32You can also read