Wetland Mapping & Monitoring in the Regional District of Nanaimo: Five Year Summary Report
←
→
Page content transcription
If your browser does not render page correctly, please read the page content below
Wetland Mapping & Monitoring in the Regional District
                    of Nanaimo:
             Five Year Summary Report

Prepared for: Regional District of Nanaimo’s Drinking Water and Watershed Protection
Program

Prepared by: Mount Arrowsmith Biosphere Region Research Institute, Vancouver Island
University

January 2021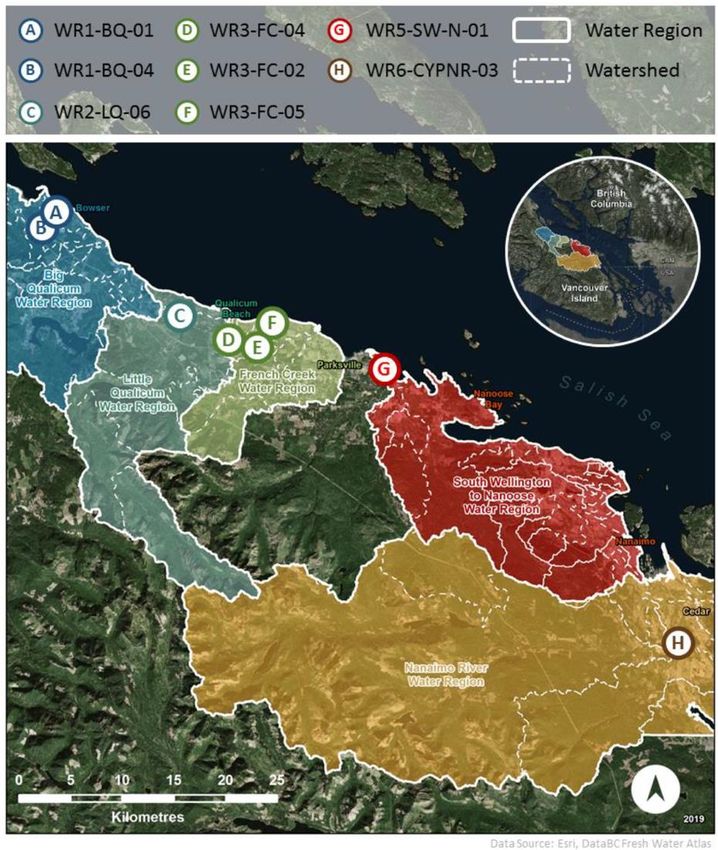
Wetland Mapping & Monitoring in the Regional District of Nanaimo: Five Year Summary Report

                                     Acknowledgements

A special thank you is extended to Julie Pisani, Coordinator of the Drinking Water and
Watershed Protection Program (DWWP) at the Regional District of Nanaimo (RDN), for her
continual support and guidance throughout this project. We would also like to thank our team of
advisors for this project including, Vancouver Island University (VIU) Geography Department
faculty member and RDN DWWP Technical Advisory Committee member, Dr. Alan Gilchrist
PhD PGeo., as well as VIU Earth Science Department faculty member, Dr. Jerome Lesemann
PhD.
Another special thank you to former Project Coordinator of the Mid-Vancouver Island Habitat
Enhancement Society (MVIHES) and lifelong active community member and environmental
steward, Faye Smith Rosenblatt. Her passing was with great sadness and we are exceedingly
grateful for the care and contributions she made to this research project and to the Mount
Arrowsmith Biosphere Region (MABR) as a whole. We would like to extend further thanks to
Bernd Keller, member of MVIHES, for his support and collaboration with this project and Steve
Adams, Dave Vey, and the rest of the Mosaic Forest Management team for providing land
access, safety briefings, and accompanying us to the research sites.
We continue to be thankful to the members of the public and property owners for welcoming our
researchers on to their lands to conduct our research, as well as for engaging and showing
interest in the purpose and longevity of this project.

                                   Research Project Team

Wetland Project Coordinators                       Senior Research Assistants
Jessica Pyett                                      Alanna Vivani
Haley Tomlin                                       Jenica Ng-Cornish
Ashley Van Acken
Kayla Harris                                       Past Research Assistants
                                                   Curtis Rispin
GIS & Remote Sensing Specialists                   Kidston Short
Ariel Verhoeks                                     Michael Anderson
Nelson Lovestrom                                   Carson Anderson
Stacey Cayetano                                    Lauren Shaw
                                                   Ryan Frederickson
                                                   Jeffrey Fontaine
                                                   Roxanne Croxall
                                                   Cassidy Funk
                                                   Brian Timmer

                                                                                                  2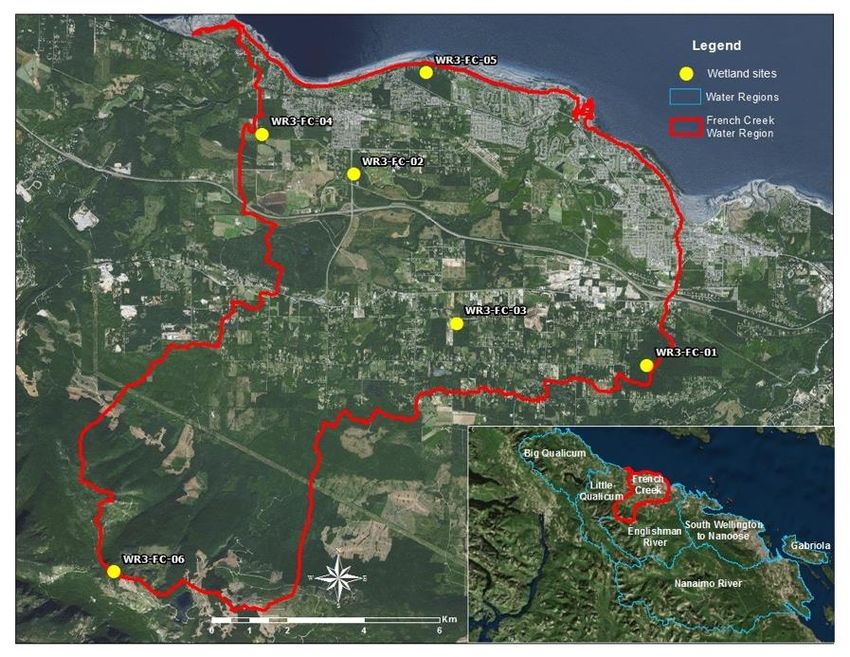
Wetland Mapping & Monitoring in the Regional District of Nanaimo: Five Year Summary Report

                                                                    Table of Contents
List of Figures ................................................................................................................................ 5
Executive Summary ...................................................................................................................... 6
1.0 Introduction ............................................................................................................................. 9
2.0 Research Objectives ................................................................................................................ 9
3.0 Summary of Past 5 Years of Work ...................................................................................... 10
   3.1 Year 1: 2016............................................................................................................................. 10
   3.2 Year 2: 2017............................................................................................................................. 11
   3.3 Year 3: 2018............................................................................................................................. 13
       3.3.1 Field Mapping ...........................................................................................................................................13
       3.3.2 Reporting...................................................................................................................................................15
   3.4 Year 4: 2019............................................................................................................................. 17
       3.4.1 Field Mapping ...........................................................................................................................................17
       3.4.2 Reporting...................................................................................................................................................19
   3.5 Year 5: 2020............................................................................................................................. 20
4.0 Findings from 5 Years of Work ........................................................................................... 21
   4.1 Predictive Mapping Versus Observed Classifications ................................................................ 21
   4.2 Review of Mapped Wetlands..................................................................................................... 23
   4.3 Instrumentation Data Analysis ................................................................................................. 24
       4.3.1 Big Qualicum Water Region – WR1-BQ-01 ..............................................................................................24
       4.3.2 Big Qualicum Water Region – WR1-BQ-04 ..............................................................................................25
       4.3.3 French Creek Water Region – WR3-FC-04 ..............................................................................................25
   4.4 Recommendations from 5 Years of Work ................................................................................. 26
5.0 Next Steps .............................................................................................................................. 26
   5.1 Monitoring Priority Sites .......................................................................................................... 27
       5.1.1 Options ......................................................................................................................................................27
   5.2 Maintenance & Monitoring of Instrumentation ....................................................................... 27
       5.2.1 Options ......................................................................................................................................................27
6.0 Implementing Best Practices/Policies into Local Wetlands .............................................. 29
   6.1 Review of Literature ................................................................................................................. 29
       6.1.1 Maintain Healthy Wetlands.......................................................................................................................29
          6.1.1.1 Land Acquisition ...............................................................................................................................29
          6.1.1.2 Valuating Natural Assets ...................................................................................................................30
          6.1.1.3 Wetland Management Plans ..............................................................................................................31
          6.1.1.4 Regulatory Approaches .....................................................................................................................32
          6.1.1.5 Official Community Plan ..................................................................................................................33
          6.1.1.6 Development Permit Area (DPA)......................................................................................................42
          6.1.1.7 Monitoring .........................................................................................................................................43
          6.1.1.8 Incentivizing Property Owners ..........................................................................................................44
       6.1.2 Maintain and/or Improve Wetlands that are Important to Important Species ..........................................47

                                                                                                                                                                          3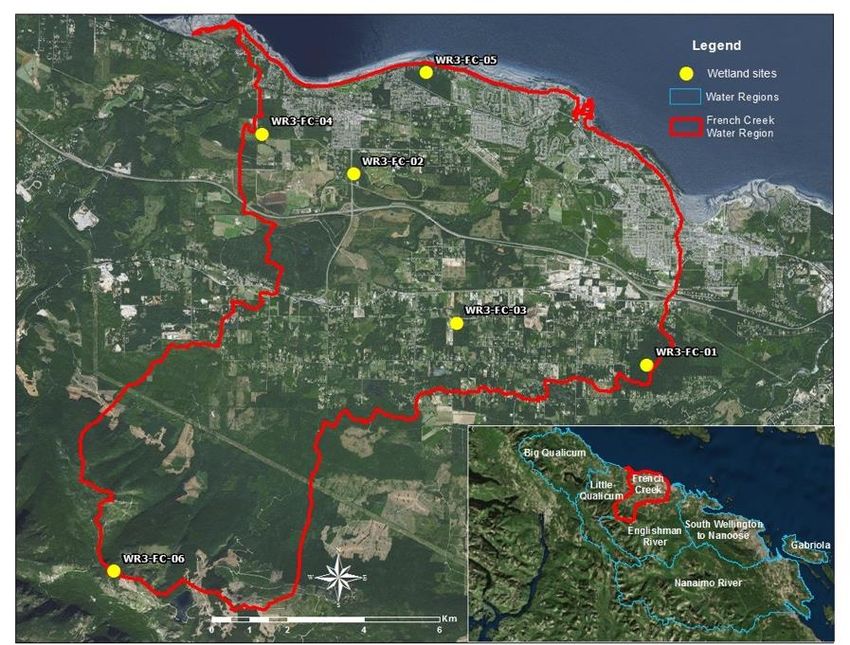
Wetland Mapping & Monitoring in the Regional District of Nanaimo: Five Year Summary Report

       6.1.3 Create Opportunities for the Sustainable Use of Wetlands .......................................................................47
       6.1.4 Create or Improve Opportunities for Community Engagement ................................................................47
   6.2 Recommendations .................................................................................................................... 48
7.0 Future Initiatives to Consider .............................................................................................. 51
   7.1 Continued Wetland Mapping Efforts ........................................................................................ 51
   7.2 Cross-Sectional & Well Observation Analysis .......................................................................... 52
   7.2 Geophysical Surveys ................................................................................................................ 52
   7.3 Valuation and Vulnerability Assessment .................................................................................. 53
   7.4 Restoration Potential................................................................................................................ 54
8.0 Conclusion ............................................................................................................................. 55
9.0 References .............................................................................................................................. 57
Appendix A: Figures of Mapped Wetlands .............................................................................. 63
Appendix B: Reports Produced ................................................................................................. 67

                                                                                                                                              4
Wetland Mapping & Monitoring in the Regional District of Nanaimo: Five Year Summary Report
List of Figures
Figure 1. Locations of mapped wetlands in the SWNWR. ........................................................... 12
Figure 2. Locations of mapped wetlands in the LQWR. .............................................................. 13
Figure 3. Locations of mapped wetlands in the FCWR. ............................................................... 14
Figure 4. Locations of mapped wetlands in the BQWR. .............................................................. 14
Figure 5. Locations of mapped wetlands in the CYPNRWR. ...................................................... 15
Figure 6. Locations of mapped wetlands in the ERWR................................................................ 18
Figure 7. Locations of mapped wetlands in the GIWR. ............................................................... 18
Figure 8. Wetland prioritization initial analysis results. ............................................................... 19
Figure 9. Predictive classifications compared to observed classifications. .................................. 21
Figure 10. Wetland’s observed classifications that matched the predicted classifications........... 22
Figure 11. Dominant classifications of mapped wetlands in the RDN. ........................................ 23
Figure 12. Secondary classifications of mapped wetlands in the RDN. ....................................... 23
Figure 13. BMCA’s two marshes and the trail that divides them. ................................................ 31
Figure 14. Regional District of Nanaimo municipalities and electoral areas. .............................. 34
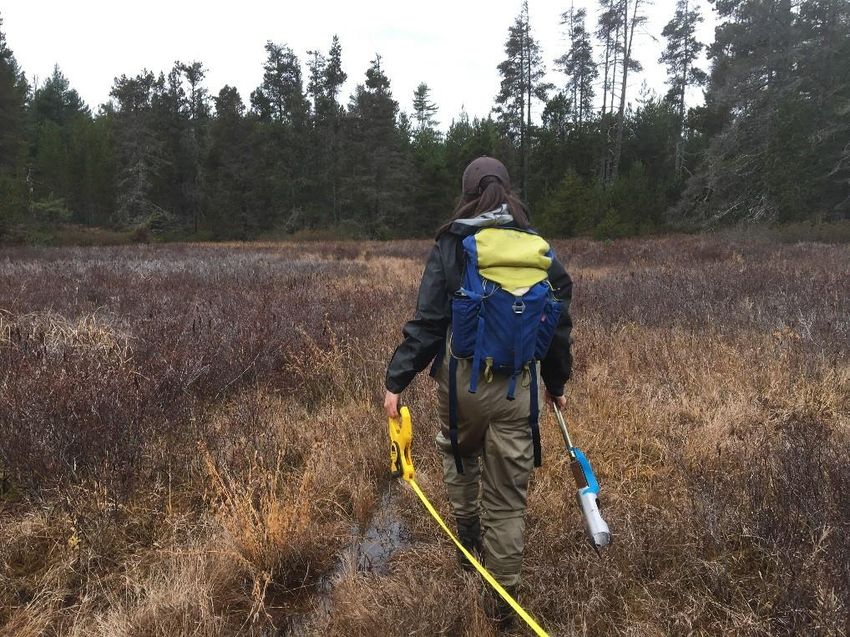
Figure 15. Student Research Assistants mapping and monitoring a local wetland in the RDN. .. 44
List of Tables
Table 1. Wetland classifications. .................................................................................................. 11
Table 2. Summary of existing policy regarding wetlands in the City of Nanaimo OCP. ............. 34
Table 3. Summary of existing policy regarding wetlands in the Town of Qualicum Beach OCP.
....................................................................................................................................................... 35
Table 4. Summary of existing policy regarding wetlands in the District of Lantzville OCP. ...... 37
Table 5. Summary of existing policy regarding wetlands in the Gabriola Island OCP. ............... 37
Table 6. Summary of existing policy regarding wetlands in Electoral Area ‘A’ OCP. ................ 38
Table 7. Summary of existing policy regarding wetlands in Electoral Area ‘C’ OCP. ................ 39
Table 8. Summary of existing policy regarding wetlands in Electoral Area ‘E’ OCP. ................ 39
Table 9. Summary of existing policy regarding wetlands in Electoral Area ‘F’ OCP. ................ 40
Table 10. Summary of existing policy regarding wetlands in Electoral Area ‘G’ OCP. .............. 40
Table 11. Summary of existing policy regarding wetlands in Electoral Area ‘H’ OCP. .............. 41
5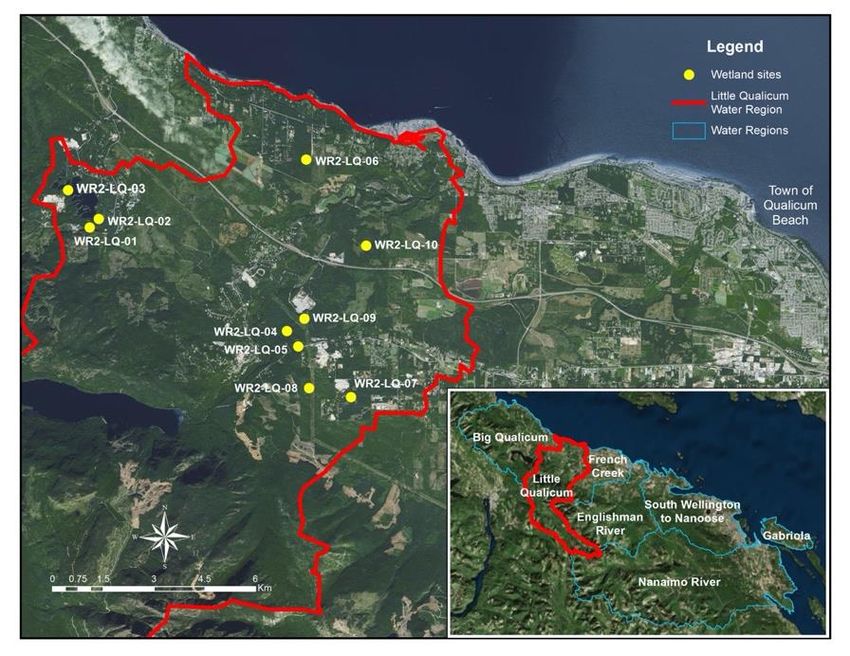
Wetland Mapping & Monitoring in the Regional District of Nanaimo: Five Year Summary Report

Executive Summary
A partnership between the Regional District of Nanaimo’s             Fast Facts
(RDN) Drinking Water and Watershed Protection Program
(DWWP) and Vancouver Island University’s (VIU) Mount                 Project initiated in 2016
Arrowsmith Biosphere Region Research Institute (MABRRI)              5-year partnership with VIU and RDN
began in 2016, in efforts to address the existing data gaps          DWWP
regarding wetlands in the RDN, including where they are
located, how they are classified, and what role they play in         Aggregate mapping and remote
groundwater recharge. The lack of knowledge pertaining to            sensing analysis completed to identify
wetlands can ultimately lead to the increased loss and               locations of wetlands and predicted
degradation of wetlands in the RDN, if people are unaware of         classifications
their intrinsic value (Community Mapping Network, 2017). As
a result, the DWWP and MABRRI established a 5-year                   Groundtruthed and field mapped 42
partnership that would work towards gaining a better                 wetlands in 7 water regions
understanding of the role wetlands plan in the hydrology of the
RDN. This report provides an outline of the work completed;          Reports were written on all 7 of the
next steps for the monitoring project; recommendations for           water regions
implementing best practices and policies into local wetlands;
and future initiatives to consider.                                  6 sites were chosen as priority and re-
Summary of Past 5 Years of Work                                      visited seasonally

The research objectives evolved throughout the 5-year                3 sites were chosen to install
agreement, beginning with aggregated mapping and remote              instrumentation
sensing analysis to identify where wetlands are located, as well
as identify their predicted classifications. Following the           Literature review was produced
analysis, 42 wetlands across the 7 water regions of the RDN          outlining wetland policy and best
were mapped via groundtruthing and field surveys; from those         practices, from which
mapped wetlands a GIS analysis was conducted to prioritize           recommendations were developed
sites for long-term monitoring, with the goal of identifying if
there is a direct connection between the selected wetlands and
                                                                     Future recommendations for
groundwater. In total, 6 priority sites were selected and have
                                                                     continued monitoring: 1) MABRRI
been re-visited seasonally, with 3 of the sites instrumented to
                                                                     continues monitoring; 2) citizen science
monitor water fluctuations throughout the year. Other
                                                                     network established; and 3) monitoring
objectives undertaken included a literature review identifying
                                                                     through VIU
existing policy and best practices pertaining to wetlands.
A comparison of the observed classification and predicted classifications was completed. It was
found that although there was some accuracy to the predictions generated through remote
sensing, there appeared to be limitations. The majority of the wetlands had some overlap
between the observed and predicted classifications; only 9 of the 42 wetlands had none of the
predicted and observed classifications match at all. Only 1 of the 42 wetland’s observed
classifications exactly matched that of the predicted classifications. Although there is value in the
predictive mapping classifications, the observed classifications were the most accurate.
Of the wetlands that were mapped, they were predominantly swamps, followed by marshes, and
a variety of other wetland types. Although the dominant classification of wetland appeared to be

                                                                                                      6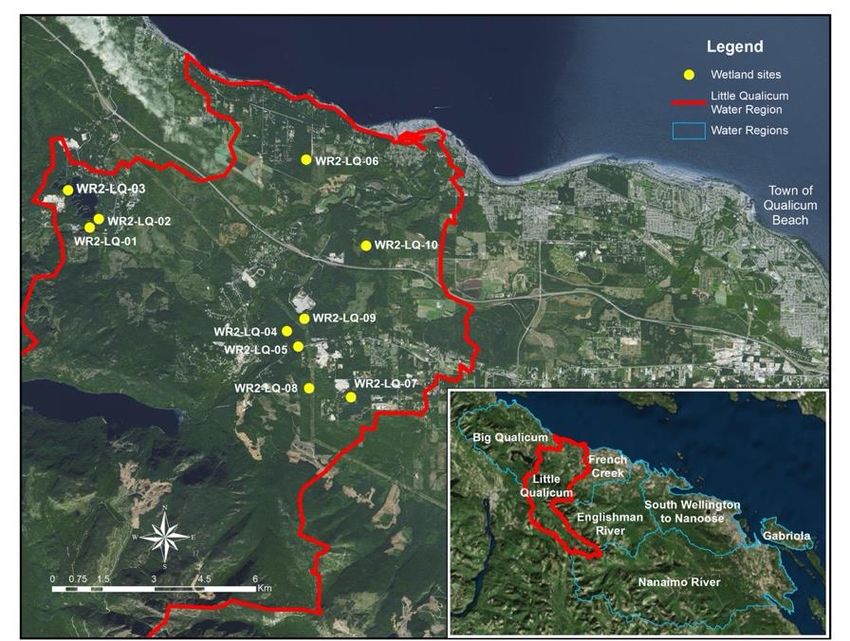
Wetland Mapping & Monitoring in the Regional District of Nanaimo: Five Year Summary Report

largely ‘swamp’, it cannot be said that they are the most dominant wetland in the RDN, as only
42 wetlands were mapped in the field.
Findings from 5 Years of Work
Instrumentation was installed at 3 of the 6 priority wetland sites; each site includes 3
piezometers, multiple trail cameras, and 1 rain gauge. The piezometers measure subsurface water
level and determine whether there is vertical water movement. The rain gauges provide site
specific precipitation. The trail cameras were installed to provide photographic evidence of
precipitation events and account for anomalies. When the data was analyzed, it was found there
are potentially variable connections between the wetlands and groundwater. However, more data
must be collected and a more accurate method to determine relative elevation of piezometers
should be used so water levels can more accurately be corrected to the same elevation datum for
comparison.
Next Steps
The instrumentation that was installed is for long-term monitoring. Therefore, recommended
options for equipment maintenance and continued data collection for these sites were developed.
First, MABRRI continues to monitor and maintain the 6 priority sites. Second, a citizen science
network is established. MABRRI would train and pass on knowledge to a group of dedicated
citizen scientists to carry the monitoring forward. A third option, is for a VIU faculty member
and their students to take on the monitoring, which may have limitations as many courses are 1
semester long and operate once per school year.
Implementing Best Practices/Policies into Local Wetlands
The literature review that was conducted provided an outline of existing policy on wetlands at a
local, regional, and national scale. This information was used to identify the best practices of
implementing policies regarding protection of wetlands. The policies and plans reviewed
provided guiding objectives, which are summarized into the following themes: 1) maintain
healthy wetlands by implementing management and policy strategies; 2) maintain and/or
improve wetlands that are critical for important species; 3) create opportunities for the
sustainable use of wetlands; and 4) create or improve opportunities for community engagement.
With the literature in mind, recommendations were developed, including: implement community
engagement initiatives to raise awareness; create a comprehensive wetland management plan in
the RDN; update Official Community Plan policy on wetlands using consistent language; initiate
incentives for property owners for wetland conservation and enhancement; acquire land with
important wetland species habitat through partnerships or otherwise; encourage sustainable
activities in wetlands that are frequently used; and implement restorative efforts into local
wetlands.
Future Initiatives to Consider
Despite all the work that has been completed in the last 5 years, there are still existing data gaps
with regards to wetlands in the RDN. Therefore, a few future initiatives to gain a better
understanding of wetlands were recommended, including continued wetland mapping efforts, in
order to establish a thorough inventory of wetlands in the region; conducting a cross-sectional
and well observation analysis to gain an understanding of wetland classifications, potential
sediment and bedrock types, and local topography within the water regions; geophysical surveys
to better understand the distribution of surficial materials and improve the conceptual model of
                                                                                                   7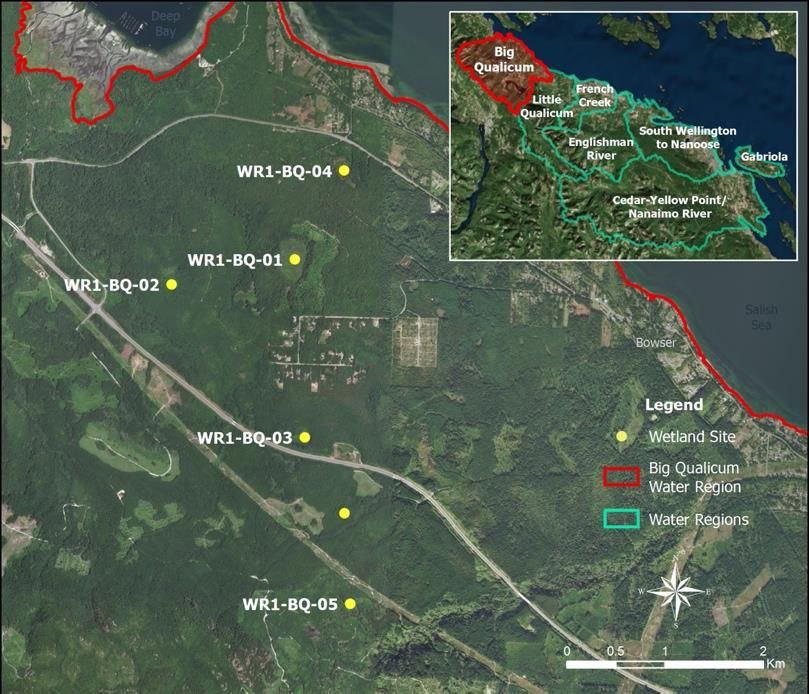
Wetland Mapping & Monitoring in the Regional District of Nanaimo: Five Year Summary Report

water flow within specific study areas; conduct a vulnerability assessment on wetlands
considering threatening anthropogenic threats to be used for management purposes; and, conduct
habitat restoration activities.
In conclusion, although the 5-year research agreement is wrapping up and a lot of objectives
were met, there is still a lot of work that can be done to continue this important research and
advance our understanding and protection of wetlands in the region.

                                                                                                  8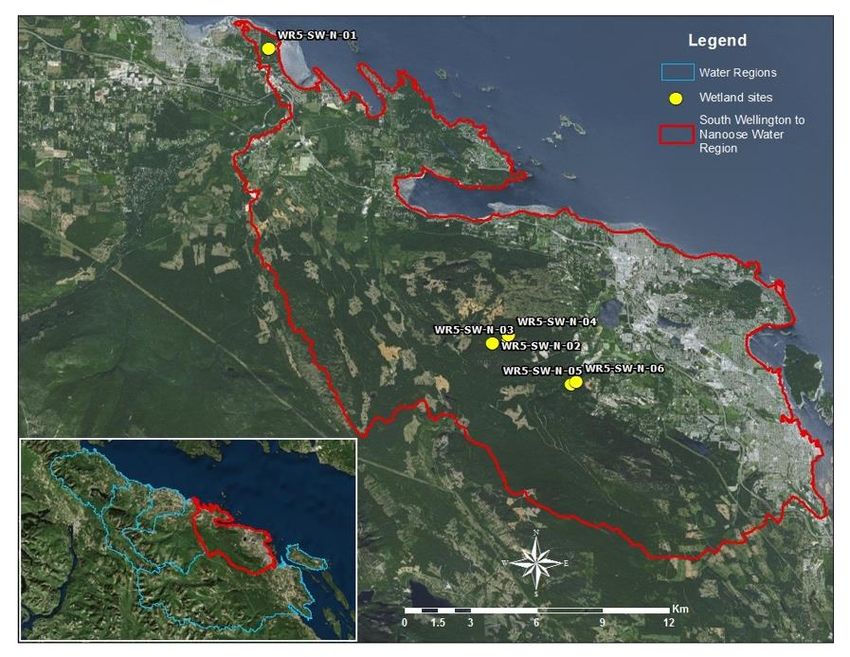
Wetland Mapping & Monitoring in the Regional District of Nanaimo: Five Year Summary Report

1.0 Introduction
The Regional District of Nanaimo (RDN) is a highly populated area with variable topography,
climate, and land uses. There are four major biogeoclimatic zones on Vancouver Island: Coastal
Douglas-fir, Coastal Mountain Hemlock, Mountain Hemlock, and Coastal Mountain-Heather
Alpine (Government of British Columbia, 2017). These biogeoclimatic zones include multiple
subzones, representing diverse climatic conditions, plant communities, and ecosystems of the
region, including a variety of wetland types (MacKenzie & Moran, 2004). There are 5 wetland
classifications recognized in Canada: bog, fen, swamp, marsh, and shallow open water (Bond et
al., 1992), with each being found throughout the RDN. Wetlands are classified based on their
defining characteristics. The soil type and dominant flora species are typically the most used
characteristics to classify a wetland (Alberta Wetland Policy, 2019). Each type of wetland has a
varying but extensive list of ecosystem services in which they provide. Ecosystem services
include both physical goods and services such as crops, plants, and animals, as well as critical
regulating services such as flood mitigation and carbon sequestration (International Union for
Conservation of Nature (IUCN), 2020; Were et al., 2019). At a global scale, wetlands deliver
trillions of dollars a year in ecosystem services (Mitsch et al., 2015). In addition to the ecosystem
services wetlands provide, they are also vital habitat for numerous flora and fauna species and
they also hold important regional aesthetic, cultural, spiritual, educational, scientific, and
recreational values (Olewiler, 2004). As a result, wetlands are much more valuable left intact
than modified or removed.
When the conversations between the RDN and the Mount Arrowsmith Biosphere Region
Research Institute (MABRRI) at Vancouver Island University began in 2015, it was recognized
that there were significant data gaps with regards to wetlands within the RDN. Some of the
knowledge gaps that existed included where they are located, how they are classified, and what
role they play in groundwater recharge throughout the RDN. Wetlands in the RDN face a variety
of threats, such as impacts from climate change, hydrological changes, urban development, and
resource extraction. The lack of knowledge pertaining to wetlands can ultimately lead to the
increased loss and degradation of wetlands in the RDN, as people are unaware of their intrinsic
value (Community Mapping Network, 2017). Thus, it is important to gain a better understanding
of the wetlands in the RDN in order to prioritize wetlands for future monitoring, enhancement,
and restoration activities. Ultimately, the research conducted now will aid in the preservation and
conservation of wetlands in the region for generations to come.

2.0 Research Objectives
As this project was a 5-year partnership, with research beginning in 2016 and occurring through
2020, there were multiple phases and research objectives throughout the project. To begin, in
2016, literature was reviewed, resulting in a research note and state of wetlands report. These
documents aided the MABRRI team in preparing for the mapping and monitoring portions of the
project. Additionally, predictive mapping was analyzed, and sites were selected for field
mapping in the first year. Following the desktop analysis, field mapping began in 2017 and
continued through 2019. Each year, 2 to 3 water regions were selected as focus areas, resulting in
wetlands being mapped in each of the 7 water regions in the RDN after the 3 years of fieldwork.
Following the mapping activities, the MABRRI team shifted their focus to prioritizing which of
the wetlands should be monitored. Different prioritization documents were created: in 2018, the
prioritization emphasized the vulnerability of wetlands in the region, selecting those that were

                                                                                                   9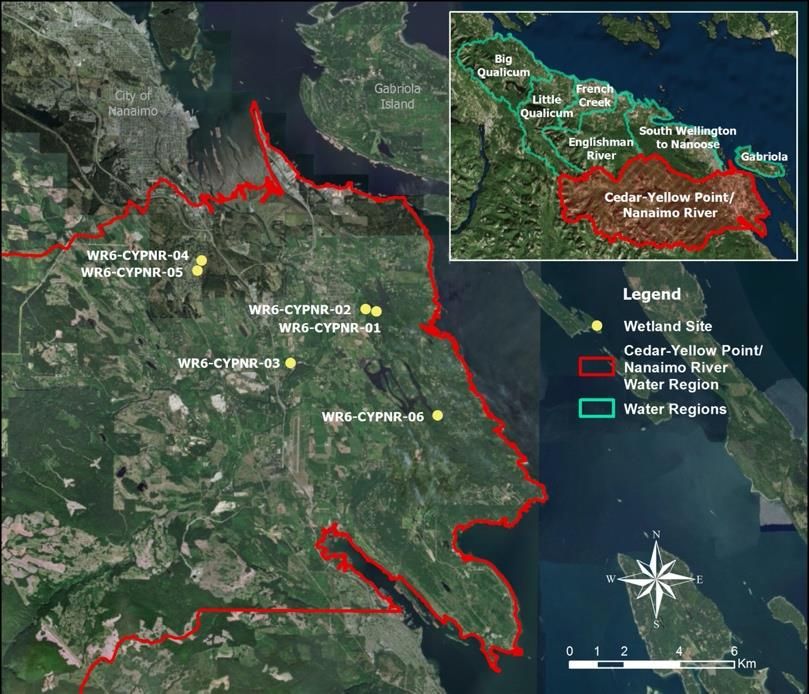
Wetland Mapping & Monitoring in the Regional District of Nanaimo: Five Year Summary Report

most vulnerable for further monitoring; and in 2019, the prioritization rationale was revised to
reflect the next phase of the project, installation of instrumentation. In the 2019 prioritization
document, the wetlands that were prioritized were revisited seasonally to gain a more holistic
understanding of the wetlands in the region and how they change throughout the year. The next
objective, which began in 2019 and extended through 2020, involved the installation of
instrumentation at 3 of the 6 wetlands that were seasonally visited to determine if there is a direct
connection to the groundwater/aquifer below. If there was a connection, the MABRRI team
sought to determine if the wetlands were recharging or discharging the aquifer. The final
objective that was completed during the 5-year agreement was generating a literature review that
outlined existing policy and best practices pertaining to wetlands on a local, provincial, and
international level, with a focus on local policies and examples. All objectives were met in this
study and all reports were made publicly available on the MABRRI and RDN Get Involved
webpages.

3.0 Summary of Past 5 Years of Work
A brief description of the work completed between 2016 and 2020:
3.1 Year 1: 2016
In order to gain a stronger understanding of wetlands, including what information there was
about local wetlands, and what information was to be collected in order to ensure its usability,
the MABRRI research assistants compiled a literature review. The document outlined the
purpose of the partnership and the project; discussed the standard wetland classification systems;
outlined the data that should be collected when mapping wetlands, which followed the BC
WetlandKeeper’s longform datasheet; and, included details of discussions with local naturalists
that had completed mapping and inventory efforts in the Englishman River Water Region.
Finally, the literature review wrapped up with an investigation of existing knowledge on aquifers
and the geology of the RDN.
Additionally, a research note on the preliminary GIS analysis in this wetland and groundwater
study in the RDN was written. The research note detailed how the existing mapping data was
compiled to identify wetlands that are already known and to predict possible locations of
wetlands missed in the original mapping process. In order to do this, the BC Sensitive
Ecosystems Inventory (SEI), Freshwater Atlas (FWA) Wetlands, and Pacific Estuary
Conservation Program (PECP) polygons were combined, following the Ducks Unlimited
technique. The Ducks Unlimited technique combines SEI, FWA Wetlands, and PECP polygons
into a single layer of all wetlands in BC. Combining these layers resulted in all wetlands in the
area highlighted on one map with their associated predicted classifications identified in the
attribute table. All wetlands were classified according to the SEI standards of marsh, fen, bog,
swamp, wet meadow, and shallow water (Table 1). Accuracy of this classification is only as
good as the input data; therefore, additional data may be helpful in narrowing and making
observed data more accurate, which would include both RADAR and LiDAR. For a more
accurate classification of wetlands, groundtruthing was required, both to verify or disprove the
existing classification and determine the mapping accuracy. This mapping was used to identify
wetlands to map in the field and determine the accuracy of the GIS mapping exercise.

                                                                                                  10
Wetland Mapping & Monitoring in the Regional District of Nanaimo: Five Year Summary Report
Table 1. Wetland classifications (Meidinger et al., 2014).
Classification Definition Characteristics
Bog Acidic, nutrient-poor wetlands generally Characteristically support
isolated from mineral rich groundwater or peat-mosses and ericaceous
surface water, their primary source of shrubs such as Labrador tea
water and nutrients is from rainfall. and bog-rosemary.
Fen Underlain by sedge or brown moss peat, Broader range of plants,
fens are closely related to bogs. In including shrubs and small
addition to rainfall, fens receive mineral trees, is able to grow.
and nutrient-enriched water from upslope
drainage or groundwater.
Marsh Characterized by permanent or seasonal They are characterized by
flooding by nutrient-rich waters. Marsh emergent vegetation of reeds,
classification may include some areas of rushes or sedges and the
diurnal flooding of fresh water above the absence of woody vegetation.
normal high high-tide, due to high river
water levels.
Swamp Wooded wetlands dominated by 25% or The vegetation may consist of
more cover of flood-tolerant trees or dense coniferous or deciduous
shrubs. Swamps are characterized by forest, or tall shrub thickets.
periodic flooding and nearly permanent
sub-surface waterflow through mixtures
of mineral and organic materials, swamps
are high in nutrient, mineral and oxygen
content.
Shallow/Open Wetlands characterized by water less than They can also include the
Water 2m in depth in midsummer; transition transition stage between lakes
between deep water bodies and other and marshes. Vegetation often
wetland ecosystems (i.e. bogs, swamps, includes floating algal mats
fens, etc.). and some emergent
vegetation.
The final deliverable of 2016 included a report titled Wetlands and Their Connection to
Groundwater Recharge: Statistical Report on the State of the Wetlands in the RDN. The findings
were based on the wetlands shapefile that was created from the Ducks Unlimited technique. In
total, 9.8% of the RDN is covered by wetlands, of which 2% is on Crown Federal lands, 7% is
on Provincial Crown lands, 2.4% is on Crown Municipal lands, 82.6% is on private land, and
5.9% is on land of unknown ownership. Approximately 169 hectares of land was not classified
as having ownership due to one of the layers not aligning with the wetlands layer; however, it is
suspected that most will fall under Crown Federal lands based on its location being adjacent to
oceanic regions.
3.2 Year 2: 2017
In 2017, the MABRRI research team began field mapping wetlands in the RDN. Following the
mapping of between 4 and 10 wetlands in each region, a Water Region Report was published for
each area. Each report outlines an introduction of the project, the methods used, and a description
11Wetland Mapping & Monitoring in the Regional District of Nanaimo: Five Year Summary Report
of the regional physiography and geology, further looking into the region’s surficial materials
and underlying aquifers. Additionally, the reports provide details of each wetland visited and
concluded with a discussion section that examines the hydrostatigraphy of the water region, the
observed wetland characteristics, and some recommendations for future studies. Each year from
2017 to 2019, the research team worked through the 7 water regions of the RDN, mapping
wetlands in each and producing reports. In 2017, wetlands were mapped, and reports were
produced for the South Wellington-Nanoose and Little Qualicum Water Regions.
In the South Wellington-Nanoose Water Region (SWNWR), 1 wetland was mapped in the
coastal lowlands, while 5 wetlands were mapped in the upland region (Figure 1). The wetland in
the coastal lowlands was classified as a marsh, with a secondary shallow water and forested
swamp classification. All the wetlands in the uplands region were classified as swamps. While
all sites appeared to be healthy and functioning, there were 2 sites with invasive species present:
WR5-SW-N-03 had daphne (Daphne laureola) and WR5-SW-N-04 had English holly (Ilex
aquifolium).
Figure 1. Locations of mapped wetlands in the SWNWR.
The Little Qualicum Water Region (LQWR) had 10 wetlands mapped: 3 wetlands were mapped
in the Spider Lake Provincial Park and Illusion Lakes region; 3 wetlands were mapped in the
Little Qualicum Falls Provincial Park region; and 4 wetlands were mapped in the Dashwood and
Whiskey Creek region (Figure 2). Swamps and marshes were the 2 distinct wetland systems
identified within the LQWR along with 2 unique sites that were classified as ‘wet forest
ecosystems’. During field visits to WR2-LQ-02 and WR2-LQ-03 wetlands, it was observed that
these sites had unique hydrological characteristics that may be indicative of local and regional
hydraulic connections. In both 2016 and 2017, these study sites had significant water storage
during the months of June to mid-August. It was observed in the latter half of August and into
12Wetland Mapping & Monitoring in the Regional District of Nanaimo: Five Year Summary Report
the fall months that the surface water drained from these sites, but neither site has known inflows
or outflows, other than a few seepage points from the surrounding sand and gravel terraces. The
WR2-LQ-02 and WR2-LQ-03 wetlands were identified as priority sites to re-visit and potentially
monitor long-term based on their unique hydrologic characteristics and hydrogeologic position.
Figure 2. Locations of mapped wetlands in the LQWR.
3.3 Year 3: 2018
3.3.1 Field Mapping
The initial mapping of wetlands for the French Creek Water Region (FCWR) began in 2017 but
was finalized in 2018. In total, 5 wetlands were mapped in the coastal lowlands and 1 wetland
was mapped in the uplands (Figure 3). Throughout the FCWR, swamps were the most dominant
wetland systems that were mapped, but more sites would need to be mapped to determine if this
is the only type of wetland in the FCWR. During field visits to WR3-FC-06, it was observed that
the site had unique hydrological characteristics that may be indicative of its position on fractured
bedrock units. As a result of its unique features, it was identified as a priority site that would
benefit from future monitoring efforts. In general, it was identified that the upland sections of the
FCWR contribute to groundwater recharge as it is likely that these sites act to redistribute water
to lower lying areas and have limited water storage in shallow bedrock aquifers.
13Wetland Mapping & Monitoring in the Regional District of Nanaimo: Five Year Summary Report
Figure 3. Locations of mapped wetlands in the FCWR.
The Big Qualicum Water Region (BQWR) had 4 wetlands mapped in the lowlands and 1
mapped in the uplands (Figure 4). All wetlands had either a primary or secondary classification
of swamp, marsh, or bog, with 1 wetland also having a secondary classification of shallow water
wetland. There were 3 wetlands, WR1-BQ-01, WR1-BQ-02, and WR1-BQ-04, that were
observed as having unique ecological and hydrological characteristics; they were selected as
potential priority sites due to their accessibility, proximity to vulnerable Aquifer 416, their size,
surrounding land uses, hydrology, and unique vegetation. These sites had a variety of flora
species that were not observed within other study sites across the RDN, which is likely
influenced by local hydrology and glaciomarine materials that make up the region.
Figure 4. Locations of mapped wetlands in the BQWR.
14Wetland Mapping & Monitoring in the Regional District of Nanaimo: Five Year Summary Report
The Cedar Yellow Point-Nanaimo River Water Region (CYPNRWR) had 2 wetlands mapped in
Hemer Provincial Park, 1 wetland mapped in the Nanaimo River Regional Park, 2 wetlands
mapped in the Richards Marsh Park, and 1 wetland mapped in the Wildwood Ecoforest (Figure
5). Marshes, swamps, shallow water, and low bench flood wetlands were the primary or
secondary classifications of all wetlands in the CYPNRWR. The WR6-CYPNR-01 and WR6-
CYPNR-02 had unique ecological and hydrological characteristics, as both sites were positioned
adjacent to open water bodies and active stream systems. During the site visit at WR6-CYPNR-
01, the research team observed juvenile fish within the adjacent stream, suggesting that the
wetland and central water body may be critical fish rearing habitat. Both sites were very
biodiverse, had an abundance of invasive species, were large in size, and had a variety of
surrounding land uses. Therefore, as a result of these characteristics and the presence of juvenile
fish, WR6-CYPNR-01 was identified as a priority site for future monitoring. Further, WR6-
CYPNR-04 and WR6-CYPNR-05 had unique ecological and hydrological characteristics that
may be indicative of local and regional land uses, hydrology, and management. Based on aerial
photos between 1975 and 2017, both wetlands appeared to have significant changes in size,
water availability, and vegetation following residential development. WR6-CYPNR-04 was
identified as a priority wetland because of its hydrology, location, size (16 ha), its surrounding
land uses being highly developed, the risk of pollution from runoff and illegal dumping, and the
presence of invasive species including red fescue (Festuca rubra), Himalayan blackberry (Rubus
armeniacus), and common tansy (Tanacetum vulgare).
Figure 5. Locations of mapped wetlands in the CYPNRWR.
3.3.2 Reporting
The first prioritizing wetlands document, titled Prioritizing Vulnerable Wetland Systems in the
Regional District of Nanaimo was generated in 2018. This document aimed to identify a
framework for prioritizing wetlands for long-term monitoring based on selected parameters, as
well as identify 1 to 2 wetlands in each water region for further monitoring. The wetlands
selected had been mapped and classified by MABRRI’s research team, but may not be the only
priority wetland systems that exist within each water region. Using the prioritization scheme
15Wetland Mapping & Monitoring in the Regional District of Nanaimo: Five Year Summary Report
outlined below, researchers sought to identify wetlands that are stressed or at-risk, and therefore
require further monitoring. The parameters chosen for prioritization in 2018 included:
Hydrogeographic position
Understanding the hydrogeographic position of the wetland sites provides researchers with
insight about their localized geologic and hydrological position (MacKenzie & Moran,
2004). Most wetlands mapped up until 2018 were located within palustrine positions, which
fall under three categories: basins and hollows; ponds and potholes; and seepage slopes. Most
of the mapped wetlands were basins and hollows, which are defined as sites that are in
depressions and other topographic low points; therefore, they are characterized by high water
tables near or at the surface and receive water from groundwater or precipitation events
(MacKenzie & Moran, 2004). Wetlands located in basins and hollows were prioritized due to
their potential connection with groundwater.
Location
Wetlands have different societal and environmental values depending on their location,
which can have varying effects on society (Bond et al., 1992). Uplands sites are the most
beneficial sites for conservation and monitoring efforts due to their connection to lowland
ecosystems. If contamination were to occur in upland wetlands, there may be a ripple effect
on ecosystems below, as water naturally flows from higher to lower elevations (Board of
Water and Soil Resources [BWSR], 2009). Upland sites provide clean drinking water to
communities and regulate river flows (BWSR, 2009). Additionally, wetlands in urban
environments are critical for local water purification, flood and erosion control, and life-
support functions for wildlife (Bond et al., 1992). As much as possible, wetlands in upland
regions with nearby urban environments were prioritized for future monitoring, ensuring the
focus on wetlands that may ultimately pose greater influence on low-lying wetlands.
Surrounding Land Uses
The surrounding land uses are important to consider when prioritizing wetlands for
monitoring, as changes in land cover and usage may affect wetland health and function over
time. The wetlands that had surrounding land uses that appeared to be unchanging were
prioritized for longer-term monitoring; examples include, parks, recreational sites,
agricultural lands, and established rural developments. Unchanging sites were prioritized to
ensure consistency and accessibility for collecting data long-term.
Hydrologic Function
In recent years, wetland hydrology has been impacted by drainage from agriculture, dyking,
urban development, climate change, and forestry (Bond et al., 1992). These disturbances
have directly impacted the abundance and distribution of wetland systems in Canada (Bond
et al., 1992). For example, climate change has resulted in annual temperature increases and
changes in precipitation patterns, directly influencing wetlands (Intergovernmental Panel on
Climate Change, 2014). Literature suggests that changes in climatic conditions can alter the
functionality of wetland systems while also affecting their ability to absorb waste and purify
water (Bond et al., 1992). Variables should be monitored over time and should be compared
to other wetland sites with similar characteristics to determine overall hydrologic function
16Wetland Mapping & Monitoring in the Regional District of Nanaimo: Five Year Summary Report
(Almendinger, 1998). Functioning wetlands were prioritized for future monitoring, as
changes would be most notable.
Erosion and Deposition
When assessing erosion and deposition attributes, the following structures should be
identified: unstable areas within the wetland; overflow structure, meaning there is a
surrounding bank that can retain water without failure; and inflow and outflow stability. In
areas where erosion has occurred, the functionality of wetlands may be reduced as over
sedimentation can impact vegetation and ecosystem health (Bond et al., 1992). As a result,
sites with no evidence of erosion and deposition were prioritized.
Rare and Endangered Ecosystems
Understanding the type of vegetation at each wetland will provide researchers with insight
regarding the system’s ability to mitigate floods and filter contaminants, while also
maintaining ecological function (Bond et al., 1992). There are numerous ecological
communities in the RDN that are provincially listed as vulnerable or endangered, including
wetland systems (British Columbia Ministry of Environment, 2017b). Rare and endangered
ecosystems found in the RDN should be protected and monitored; these include 21 red and
blue listed ecosystems within the Coastal Douglas Fir, Coastal Western Hemlock, and
Mountain Hemlock biogeoclimatic zones (British Columbia Ministry of Environment,
2017a). Wetlands located within the vulnerable or endangered ecological communities were
prioritized.
Functional Rating
Interactions between geology, soil, water, and vegetation determine each wetland’s
functioning condition (Prichard et al., 2003). Proper functioning condition of a wetland is
when it is stable, resilient, biologically diverse, and contains enough vegetation and/or large
woody debris to dissipate stream energy and high-water flows (Prichard et al., 2003). Proper
functioning wetlands reduce erosion, improve water quality, filter sediment, provide habitat
through ponding and channels, and improve flood-retention and potential for groundwater
recharge (Prichard et al., 2003). Functioning wetlands were prioritized, as they should be
conserved.
3.4 Year 4: 2019
3.4.1 Field Mapping
The mapping activities began in the Englishman River Water Region (Water Region 4) in 2016
and were finalized in 2019. Most wetlands in Water Region 4 are on private forest lands
managed by Mosaic Forest Management, formerly TimberWest and Island Timberlands, who
provided access to the sites. In total, 4 wetlands were mapped (Figure 6); 3 of which were
dominantly classified as swamps, with 1 having secondary classifications of shallow water
wetland and forested swamp. The fourth wetland was classified as a marsh with a secondary
classification of forested swamp.
17Wetland Mapping & Monitoring in the Regional District of Nanaimo: Five Year Summary Report
Figure 6. Locations of mapped wetlands in the ERWR.
The final water region to be mapped, Gabriola Island Water Region (Water Region 7), was
completed in 2019. In total, 5 wetlands on private property were mapped across Gabriola Island
(Figure 7), all of which required permission to access from landowners. In most cases, the
mapped wetlands bordered several different private properties, so only the portions with
permission were mapped. In total, 4 of the 5 wetlands were dominantly swamp, with 1 having a
secondary classification of bog and another having a secondary classification of shallow water
wetland. The other wetland was classified as a marsh.
Figure 7. Locations of mapped wetlands in the GIWR.
18Wetland Mapping & Monitoring in the Regional District of Nanaimo: Five Year Summary Report
3.4.2 Reporting
In 2019, the second prioritizing wetlands document, titled Prioritizing Wetland Systems to Install
Instrumentation in the Regional District of Nanaimo, was generated. In order to install
instrumentation at a few priority sites it was decided by the researchers and the Technical
Advisory Committee that the parameters for site identification needed to be modified from the
first priority report, to focus specifically on parameters relevant to continuous monitoring. The
report is divided into two sections: the first outlining the desktop analysis and the second
discussed the fieldwork component. The first section outlines how the list of priority sites was
generated through two GIS analyses. Analysis 1 ranked wetlands based on their proximity to
volunteer or provincial observation wells, climate stations, and hydrometric stations, with the
wetlands closer to these data collection sites ranking higher. Analysis 2 ranked wetlands based
on their proximity to fish-bearing streams (closer was higher ranked), as well as concentration of
groundwater wells within 1 km and concentration of water rights licenses within 2 km (higher
concentrations were ranked higher). The 2 rankings were combined and ultimately 8 wetlands
were identified as potential priority sites: WR5-SW-N-01, WR1-BQ-04, WR3-FC-02, WR6-
CYPNR-03, WR3-FC-04, WR1-BQ-01, WR2-LQ-06, and WR3-FC-05 (Figure 8). Based on
their proximity to the ocean and their elevation, 2 of the wetlands (WR5-SW-N-01 and WR3-
FC-05) were removed from the list, as these wetlands were likely to have saltwater influence.
The second portion of the priority report discusses the methodologies used for re-visiting priority
sites seasonally, how the instrumentation pilot site (WR1-BQ-01) was selected, and how the
instrumentation was installed. Additionally, initial results from re-visiting each of the sites is
outlined. This report would then be updated in 2020 with further results.
Figure 8. Wetland prioritization initial analysis results.
19Wetland Mapping & Monitoring in the Regional District of Nanaimo: Five Year Summary Report
Based on the priority sites identified through the analyses, 1 wetland (WR1-BQ-01) was selected
to have instrumentation installed to pilot the approach, and see if the data obtained would help
determine if there is a direct connection between the wetland and the underlying aquifer. In late
October 2019, the research team installed 3 piezometers, 1 rain gauge, and 3 trail cameras on-
site. The piezometers measure subsurface water level overtime, recording the water level every
hour. The rain gauge provides on-site precipitation values and the trail cameras provides visuals
for the data collected. As the instrumentation was installed in late October, no data analysis was
completed in 2019 as there was minimal data to review.
The final deliverable of 2019 was the Wetlands Ecosystem Services, Policy & Best Practices:
Literature Review. This literature review discussed the ecosystem services that wetlands provide;
the status of wetlands at local, regional, and national scales; reviewed water governance in
Canada and what is in place federally with regards to wetlands; conducted a review of existing
policy, having examined federal, provincial, and local government policies and authority,
including review of Official Community Plans, Development Permit Areas, covenants, tax
exemptions, density bonuses and non-legislative tools for protection and conservation of
wetlands. Additionally, the literature review concluded with a review of wetland policy best
practices and the 4 principal methods of conserving wetlands: 1) maintain healthy wetlands by
implementing management and policy strategies; 2) maintain and/or improve wetlands that are
critical for important species; 3) create opportunities for the sustainable use of wetlands; and 4)
create or improve opportunities for community engagement.
3.5 Year 5: 2020
The final year of the 5-year research agreement between MABRRI and the RDN included a
review of installed instrumentation, installing more instrumentation, initial data analysis,
updating the 2019 priority report, generating a summary report, and updating the RDN’s online
ArcMap data pertaining to mapped wetlands.
First, the instrumentation that was installed in late October 2019 was reviewed through
preliminary data analysis to verify that it was providing the information that was anticipated to
aid in determining if there is a direct connection between the selected wetland and the underlying
aquifer. It was determined that the set of instrumentation was appropriate, and 2 more sets of
instrumentation were installed at 2 other wetlands in the RDN. In total, 3 piezometers, 1 rain
gauge, and 2 trail cameras were installed at WR1-BQ-04 and WR3-FC-04 in August and
September 2020, respectively. In late 2020, the MABRRI research team worked closely with Dr.
Alan Gilchrist, Vancouver Island University Geography Professor, to analyze the data collected
from the piezometers and rain gauges on site, comparing the data collected to the nearby climate,
hydrometric, and observation well stations to determine any indication of groundwater
connection.
The second priority report, Prioritizing Wetland Systems to Install Instrumentation in the
Regional District of Nanaimo, was updated to include the data collected during seasonal visits in
2020, as well as discuss the installation of the two new sets of instrumentation and outline the
findings from the instrumentation data analysis.
Further, this Five Year Summary Report was generated to provide an overview of the last 5 years
of work that were completed on the wetland project; provide an overview of the findings from all
aspects of the last 5 years; discuss some potential next steps for the monitoring project; dissect
20Wetland Mapping & Monitoring in the Regional District of Nanaimo: Five Year Summary Report
how to implement best practices and policies into local wetlands, including recommendations
and local examples; and provide examples of future initiatives that could be undertaken for a
more in-depth look at local wetlands.
Lastly, in order to update the RDN’s online ArcMap, MABRRI compiled all of the data collected
during mapping activities over the last 5 years and provided it to the RDN in the format of
shapefiles. These shapefiles will be added to the RDN’s online ArcMap and be made public in
early 2021.
4.0 Findings from 5 Years of Work
4.1 Predictive Mapping Versus Observed Classifications
As described in more depth in Section 3.1, the MABRRI research team used ArcMap GIS to
combine multiple layers (BC SEI, FWA Wetlands, and PECP polygons) into a single map. These
layers produced a map that highlighted wetlands across BC, along with their predicted
classifications for 2002, 2014, and 2015. With these predicted classifications, the MABRRI
research team mapped a total of 42 wetlands across the 7 water regions in the RDN. When the
2015 predicted classifications were compared with the observed classifications, it was found that
although there was some accuracy to the predicted classifications, there appeared to be
limitations with the predictive mapping. Only 1 of the 42 wetland’s observed classifications
exactly matched that of the predicted classification (Figure 9). The largest proportion of the
wetlands, 32 out of 42, had some of the same classifications observed as were predicted in the
mapping. However, despite some similarities, in 26 of the 32 wetlands (81%) with some
matching classifications, the predictive mapping over predicted the number of classifications
compared to those that were observed on site. Rather, in 6 of the 42 wetlands the observed
classifications listed outnumbered the predicted classifications. The last 4 wetlands had an equal
number of predicted and observed classifications. Finally, in 21% or 9 of the mapped wetlands,
the predicted and observed classifications did not match at all.
Figure 9. Predictive classifications compared to observed classifications.
In order to investigate the accuracy of the predictive mapping, the data was analyzed further to
determine the number of predicted classifications that were correct when compared to the
observed classifications. Similar to Figure 9, 2.4% of the wetland’s classifications matched
exactly and 21.4% of the wetland’s classifications did not match at all. For those wetland
21Wetland Mapping & Monitoring in the Regional District of Nanaimo: Five Year Summary Report
classifications that had overlap between the predicted and observed, the number of classifications
that overlapped was determined as a percentage for each wetland. For example, if a wetland had
6 different classifications predicted by the mapping, and 2 of those wetland classifications were
observed in the field, that wetland’s classification matched for 33.3% of the classifications listed.
Therefore, according to Figure 10, 33.3% of the wetland’s observed classifications matched
between 1% and 25% of the predicted classifications listed; 38.1% matched between 26% and
50%; and 4.8% matched between 51% and 75%.
Figure 10. Wetland’s observed classifications that matched the predicted classifications.
With the results listed above, it can be stated that although there is value in the existing
predictive mapping classifications, the on-the-ground observation classifications were the most
effective in determining accurate wetland classifications. In addition to the predictive mapping
over-predicting the number and type of potential classifications for most wetlands, a few
limitations were identified with the predictive mapping method. First, the predictive mapping is
unable to see the actual vegetation or soil types that are present, which are critical in classifying a
wetland. For example, in forested wetland areas, it is generally not possible for the aerial
photography to see what is below the forest canopy. Additionally, the substrate composition,
either mineral or organic cannot be determined without a site visit. Both of these limited
observations make classifying wetlands through desktop or predictive mapping a challenge.
Second, it appeared that the predictive mapping would over-predict the potential classifications
to curb the first limitation that was listed here. For example, whenever ‘swamp’ was mentioned,
‘bog’ would also be mentioned; these are two different types of wetlands based on their substrate
composition, with swamps being mineral-based and bogs being organic-based. It was the same
case with ‘fens’ and ‘wet meadows’; both classifications were mentioned despite having
different substrate compositions. It may be that these types of wetlands appear similarly in aerial
photos, however they will require site visits to accurately determine their classifications. The
final limitation that was noted was that there were variations in the classifications that the
predictive mapping was able to provide, versus what was observed in the field. There were only
6 classifications (‘bog’, ‘swamp’, ‘marsh’, ‘fen’, ‘wet meadow’, and ‘shallow water’) that were
used in the predictive mapping classifications, but when in the field, none of the wetlands were
classified as fens or wet meadows, and other classifications such as ‘forested swamp’, ‘wet
forest’, and ‘low flood bench’ were observed.
22You can also read