Environmental Protection in Maritime Traffic - Scrubber Wash Water Survey 162/ 2020
←
→
Page content transcription
If your browser does not render page correctly, please read the page content below
TEXTE

 162/2020
 Environmental
 Protection in Maritime
 Traffic – Scrubber Wash
 Water Survey
 Final report

German Environment Agency
TEXTE 162/2020

Ressortforschungsplan of the Federal Ministry for the
Environment, Nature Conservation and Nuclear Safety

Project No. (FKZ) 3716 51 101 0
Report No. FB000347/ENG

Environmental Protection in Maritime Traffic
– Scrubber Wash Water Survey
Final report

Authors:
Stefan Schmolke, Katrin Ewert, Magnus Kaste, Thomas
Schöngaßner, Torben Kirchgeorg, Octavio Marin-Enriquez

Federal Maritime and Hydrographic Agency (BSH), Hamburg

On behalf of the German Environment Agency
Imprint

Publisher
Umweltbundesamt
Wörlitzer Platz 1
06844 Dessau-Roßlau
Tel: +49 340-2103-0
Fax: +49 340-2103-2285
buergerservice@uba.de
Internet: www.umweltbundesamt.de

 /umweltbundesamt.de
 /umweltbundesamt

Report performed by:
Federal Maritime and Hydrographic Agency (BSH)
Bernhard-Nocht-Str. 78
20359 Hamburg
Germany

Report completed in:
February 2020

Edited by:
Umweltbundesamt FG I 2.2 und II 2.3
Katharina Koppe, Ulrike Pirntke

Publication as pdf:
http://www.umweltbundesamt.de/publikationen

ISSN 1862-4804

Dessau-Roßlau, September 2020

The responsibility for the content of this publication lies with the author(s).
TEXTE Environmental Protection in Maritime Traffic – Scrubber Wash Water Survey – Final report

Abstract: Environmental Protection in Maritime Traffic – Scrubber Wash Water Survey
International regulations for reducing sulphur emissions in the maritime sector have introduced
Exhaust Gas Cleaning Systems (EGCS), commonly referred to as “scrubbers”, as a reduction
technology to minimize atmospheric sulphur emissions. Numerous flag States, organizations and
ship operators carry out research to address the concern that the use of EGCS might shift the
pollution from the atmosphere to the marine water body by additional energy expenditure.
Although this technique may improve the air quality, the consequences for the marine
environment are still unclear and an environmental risk assessment of this technique is still not
standardized.
The main aim of this study is to provide a basis for the evaluation of the increasing use of EGCS
technology on seagoing ships, particularly with regard to water and marine environment
protection. The focus was on gaining more knowledge on the wash water composition and to
estimate expected wash water quantities to be released into the marine environment by
seagoing ships. The study is based on the information gathered from five ships: three ships with
a hybrid system, which were sampled under open and closed-loop conditions, and two ships
with an open-loop system. The standard water parameters and the main pollutants such as
heavy metals, PAHs, nitrate/nitrite, oil content and suspended particular matter, were analysed.
The investigations show, among other things, pronounced pollutant profiles in the wash water
samples, significantly increased pollutant concentrations in the closed-loop samples and
significant variations between the on-board online unit and the parallel comparative
measurements, which were carried out with a system quality-assured by the German Federal
Maritime and Hydrographic Agency (BSH). Discrepancies between the data from both units were
identified; especially concerning the turbidity and PAHPHE measurements. Further research and
calibration standardization work are needed for a clear definition and understanding of PAHPHE
as a threshold value.
A major part of the study was the dispersion modelling for developing a distribution simulation
of wash water and potential concentration of pollutants based on AIS data for the Baltic Sea and
North Sea Region. The results showed that the wash water accumulation in the Baltic Sea is
higher than in the North Sea due to lower water exchange. Although wash water is only emitted
in the surface layer, vertical distribution data suggest that substances emitted by EGCS can also
reach deeper layers within one year.
The study concludes that EGCS may improve the air quality in harbor cities and at sea but will
shift atmospheric pollution to the marine water body. Further research is needed for a better
quantification and evaluation of the total impact on the marine environment of this relatively
new and emerging abatement technology. This has to include an environmental risk assessment
of this new technology, providing sound scientific data for future recommendations and for a
revision of related regulations.

 5
TEXTE Environmental Protection in Maritime Traffic – Scrubber Wash Water Survey – Final report

Kurzbeschreibung: Umweltschutz im Seeverkehr – Scrubber Waschwasser Studie
Internationale Vorschriften zur Verringerung der Schwefelemissionen im Seeverkehr lassen
Abgasnachbehandlungssysteme (EGCS – Exhaust Gas Cleaning Systems), die sogenannten
Scrubber, als eine Technologie zur Reduzierung dieser Emissionen zu. Zahlreiche
Flaggenstaaten, Organisationen und Schiffsbetreiber forschen, um herauszufinden, ob und
inwieweit die Verwendung von EGCS die Verschmutzung aus der Atmosphäre in das Meer
verlagern könnte. Obwohl diese Technik die Luftqualität verbessern kann, sind die Folgen für
die Meeresumwelt noch unklar, und eine umfassende Umweltrisikobewertung dieser Technik ist
noch nicht vorhanden.
Hauptziel dieser Studie ist es, eine Grundlage für die Bewertung des zunehmenden Einsatzes der
EGCS-Technologie auf Seeschiffen zu schaffen, insbesondere im Hinblick auf den Gewässer- und
Meeresschutz. Der Schwerpunkt liegt auf der Gewinnung weiterer Erkenntnisse über die
Waschwasserzusammensetzung und der Abschätzung der zu erwartenden
Waschwassermengen, die von Seeschiffen in die Meeresumwelt abgegeben werden. Die Studie
basiert auf den Informationen von fünf Schiffen: Drei Schiffe mit einem Hybridsystem, die unter
offenen und geschlossenen Bedingungen getestet wurden, und zwei Schiffe mit einem offenen
System. Die Untersuchungen zeigen u.a. ausgeprägte Schadstoffprofile, deutlich erhöhte
Schadstoffkonzentrationen in den Closed-loop Proben und deutliche Abweichungen zwischen
den On Board Online Units und den parallelen Vergleichsmessungen, die mit einer zweiten im
Bundesamt für Seeschifffahrt und Hydrographie (BSH) qualitätsgesicherten Online Unit
durchgeführt wurden. Insbesondere zeigten die Trübung und PAHPHE deutliche Abweichungen.
Darüber hinaus besteht weiterer Forschungs- und Kalibrierungsbedarf, um PAHPHE als
Schwellenwert klar zu definieren und zu verstehen.
Einen wesentlichen Bestandteil der Studie stellt die Modellierung für die Entwicklung einer
Verbreitungssimulation von Waschwasser und potenzieller Schadstoffkonzentrationen auf Basis
von AIS-Daten dar. Die Ergebnisse zeigen, dass die Waschwasseranreicherung im Ostseeraum im
Vergleich zur Nordsee höher sind, was auf einen geringeren Wasseraustausch zurückzuführen
ist. Obwohl Waschwasser nur in die Oberfläche abgegeben wird, deuten vertikale
Verteilungsdaten darauf hin, dass die vom EGCS emittierten Stoffe innerhalb eines Jahres auch in
die tiefere Schicht gelangen.
Die Studie kommt zu dem Schluss, dass EGCS zwar die Luftqualität in den Hafenstädten und auf
See verbessern kann, aber die Verschmutzung in die Meeresgewässer verlagert wird. Weitere
Forschungsarbeiten sind erforderlich, um die Gesamtauswirkungen auf die Meeresumwelt
dieser relativ neuen Reinigungstechnik für Schiffsabgase besser zu quantifizieren und zu
bewerten. Dazu gehört auch eine Umweltverträglichkeitsprüfung dieser neuen Technik, die
fundierte wissenschaftliche Daten für künftige Empfehlungen und die Überarbeitung
entsprechender Vorschriften liefert.

 6
TEXTE Environmental Protection in Maritime Traffic – Scrubber Wash Water Survey – Final report

Table of content
List of Figures........................................................................................................................................... 9
List of Tables .......................................................................................................................................... 12
List of Abbreviations .............................................................................................................................. 14
Summary ............................................................................................................................................... 16
Zusammenfassung................................................................................................................................. 19
1 Introduction................................................................................................................................... 22
 1.1 Overview ............................................................................................................................... 22
 1.2 Legal Framework ................................................................................................................... 23
 1.2.1 International Regulations ................................................................................................. 23
 1.2.2 National Regulations in Germany ..................................................................................... 24
 1.3 EGCS Technology in the Maritime Sector ............................................................................. 25
 1.4 Aim of this Study ................................................................................................................... 26
2 Market Analysis ............................................................................................................................. 28
 2.1 Method.................................................................................................................................. 28
 2.2 Future Development of the EGCS Market ............................................................................ 28
 2.3 Conclusions – Market Analysis .............................................................................................. 31
3 Chemical Wash Water Characterization ....................................................................................... 33
 3.1 Introduction .......................................................................................................................... 33
 3.2 Materials and Methods ......................................................................................................... 33
 3.2.1 Ships Selection .................................................................................................................. 33
 3.2.2 Sample Preparation for EGCS on Ships ............................................................................. 34
 3.2.3 Sampling on Board ............................................................................................................ 35
 3.2.4 Preparation, Storage and Analyses ................................................................................... 36
 3.2.5 BSH On-board Measurements (pH, turbidity, PAHPHE) ..................................................... 36
 3.3 Results and Discussion – Chemical Analyses ........................................................................ 37
 3.3.1 BSH Laboratory Analyses .................................................................................................. 37
 3.3.1.1 Alkalinity ....................................................................................................................... 37
 3.3.1.2 Nitrate and Nitrite ........................................................................................................ 38
 3.3.1.3 Suspended Particulate Matter ...................................................................................... 38
 3.3.1.4 Polycyclic Aromatic Hydrocarbons (PAHs) .................................................................... 39
 3.3.1.5 Hydrocarbon Oil Index .................................................................................................. 41
 3.3.1.6 Metals ........................................................................................................................... 41
 3.3.2 BSH On-board Measurements (pH, turbidity, PAHPHE) ..................................................... 45

 7
TEXTE Environmental Protection in Maritime Traffic – Scrubber Wash Water Survey – Final report

 3.3.2.1 Comparison of on-board Data ...................................................................................... 45
 3.3.2.2 Comparison PAHPHE On-Board Values with Laboratory Values .................................... 47
 3.4 Conclusions - Chemical Wash Water Characterization ......................................................... 49
4 Dispersion Modelling..................................................................................................................... 50
 4.1 Introduction .......................................................................................................................... 50
 4.2 Model and Method ............................................................................................................... 51
 4.2.1 The HIROMB-BOOS Model ................................................................................................ 51
 4.2.2 Model Application............................................................................................................. 53
 4.2.3 Scenarios and General Assumption .................................................................................. 53
 4.2.3.1 General Assumption Regarding the EGCS Type Used................................................... 54
 4.2.3.2 Current State Scenario 2018 (CSS) ................................................................................ 54
 4.2.3.3 Maximum Installation Scenario (MIS) .......................................................................... 54
 4.2.4 Data Input ......................................................................................................................... 55
 4.2.4.1 EMMA Model ................................................................................................................ 55
 4.2.4.2 Rasterization ................................................................................................................. 57
 4.2.5 Post-processing of the Model Results .............................................................................. 57
 4.2.5.1 Distribution of Wash Water .......................................................................................... 57
 4.2.5.2 Derivation of the Pollutant Concentration ................................................................... 58
 4.3 Results and Discussion – Dispersion Modelling .................................................................... 59
 4.3.1 General Wash Water Distribution and Total Wash Water Emissions............................... 59
 4.3.2 Maximum Concentrations ................................................................................................ 62
 4.3.3 Spatial and Vertical Distribution ....................................................................................... 65
 4.3.3.1 Spatial Distribution ....................................................................................................... 65
 4.3.3.2 Vertical Distribution ...................................................................................................... 68
 4.3.4 Temporal Variation of Pollutant Concentrations .............................................................. 71
 4.4 Conclusions - Dispersion Modelling ...................................................................................... 75
5 Conclusions and Outlook ............................................................................................................... 76
6 Acknowledgements ....................................................................................................................... 79
7 References ..................................................................................................................................... 80
8 Appendix........................................................................................................................................ 83
 8.1 EGCS Market Study – Detailed Results ................................................................................. 84
 8.2 Chemical Analyses ................................................................................................................. 87
 8.3 Handout for Ship Operator as Submitted to PPR.................................................................. 89

 8

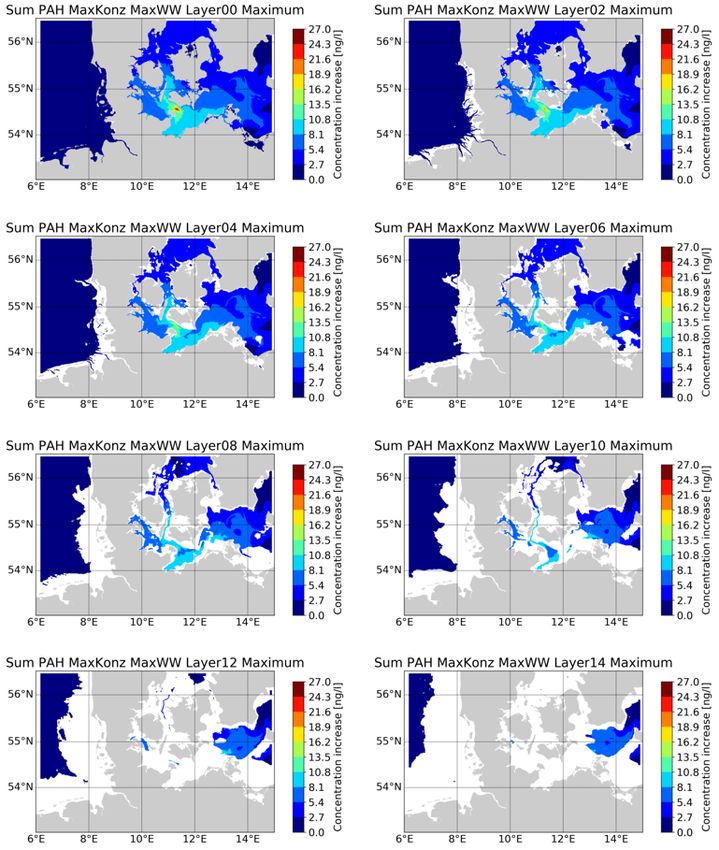
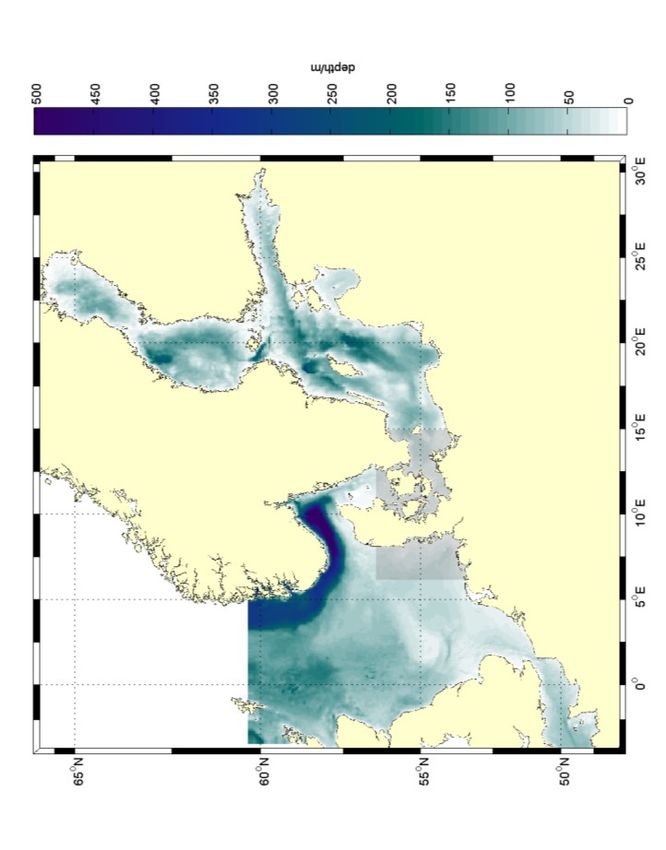
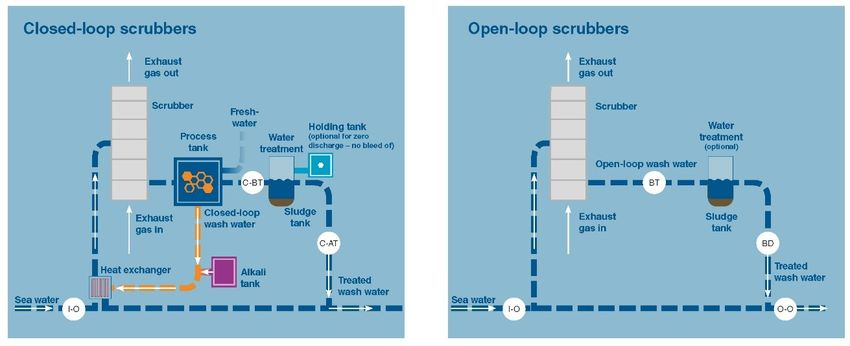
TEXTE Environmental Protection in Maritime Traffic – Scrubber Wash Water Survey – Final report

List of Figures
Figure 1: Process flow for the two modes of operation of wet scrubbers: closed-loop (left)
 and open-loop (right) ..............................................................................................26
Figure 2: Total number of ships with scrubbers (in operation and on-order) .......................29
Figure 3: Accumulated number of notified vessels with an approved EGCS .........................30
Figure 4: EGCS market share by type of scrubber system from GISIS (left) and installed and
 on-order scrubbers by type from DNV GL (right) ....................................................30
Figure 5: EGCS market share by ship type ..............................................................................31
Figure 6: Sampling points: I-O: seawater inlet, O-O: open-loop wash water outlet, C-AT:
 closed-loop after treatment, C-BT: closed-loop before treatment, BD: before
 dilution.....................................................................................................................34
Figure 7: Alkalinity of EGCS wash water at the different sampling points: seawater inlet (I-
 O), open-loop outlet (O-O) and closed-loop outlet (C-AT) ......................................37
Figure 8: Nitrate and nitrite concentrations of EGCS wash water at the different sampling
 points: seawater inlet (I-O), open-loop outlet (O-O) and closed-loop outlet (C-AT).
 Please note the different concentration scale of the C-AT results .........................38
Figure 9: Suspended particulate matter concentrations of EGCS wash water at the different
 sampling points: seawater inlet (I-O), open-loop outlet (O-O) and closed-loop
 outlet (C-AT). Please note the different concentration scale of the C-AT results ...39
Figure 10: PAH concentrations of EGCS wash water at the different sampling points:
 seawater inlet (I-O), open-loop outlet (O-O) and closed-loop outlet (C-AT). Left: all
 PAHs analysed in this study. Right: only PAHEPA16 ...................................................39
Figure 11: Hydrocarbon oil index (HOI) of EGCS wash water at selected sampling points:
 seawater inlet (I-O), open-loop outlet (O-O) and closed-loop outlet (C-AT). Please
 note the different concentration scale of the C-AT results. na: not analysed ........41
Figure 12: Vanadium (V) and nickel (Ni) concentrations in the dissolved (DF) and particulate
 matter (SPM) fraction of EGCS wash water at the different sampling points:
 seawater inlet (I-O), open-loop outlet (O-O) and closed-loop outlet (C-AT). Please
 note the different concentration scale of the C-AT results .....................................42
Figure 13: Copper (Cu) and Zinc (Zn) concentrations in the dissolved (DF) and particulate
 matter (SPM) fraction of EGCS wash water at the different sampling points:
 seawater inlet (I-O), open-loop outlet (O-O) and closed-loop outlet (C-AT). Please
 note the different concentration scale of the C-AT results .....................................42
Figure 14: Cadmium (Cd), arsenic (As), iron (Fe), lead (Pb), manganese (Mn) concentrations
 in the dissolved (DF) and particulate matter (SPM) fraction of EGCS wash water at
 the different sampling points: seawater inlet (I-O), open-loop outlet (O-O) and
 closed-loop outlet (C-AT).........................................................................................43
Figure 15: Comparison between ship-monitoring data and BSH in situ data. A: NTUout-in
 (outlet - inlet turbidity) for open-loop and closed-loop. B: PAHPHE out-in (outlet -
 inlet PAHPHE). C: pH values of seawater outlet of open-loop systems (O-O) and
 closed-loop systems (C-AT) .....................................................................................46
Figure 16: Bathymetry of the coarse gridded area with a resolution of 3 nm. The grey shaded
 area indicates the area of the nested fine grid .......................................................51
 9
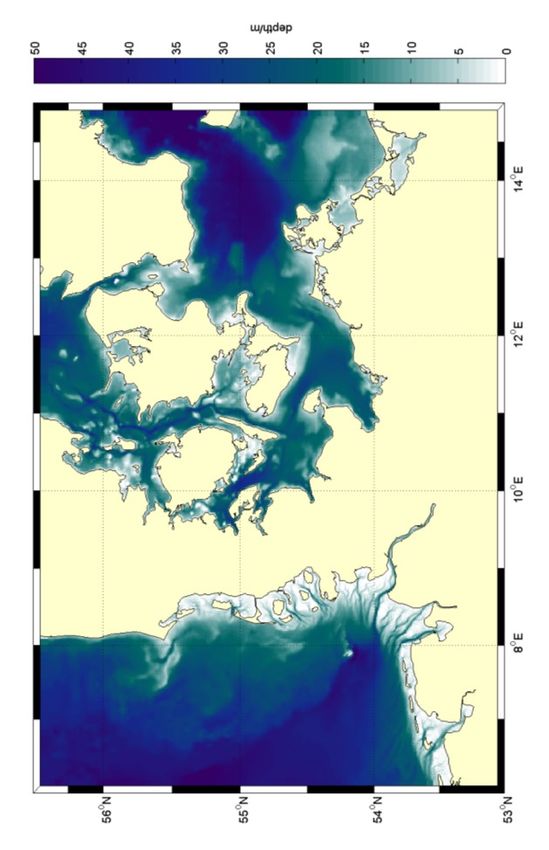
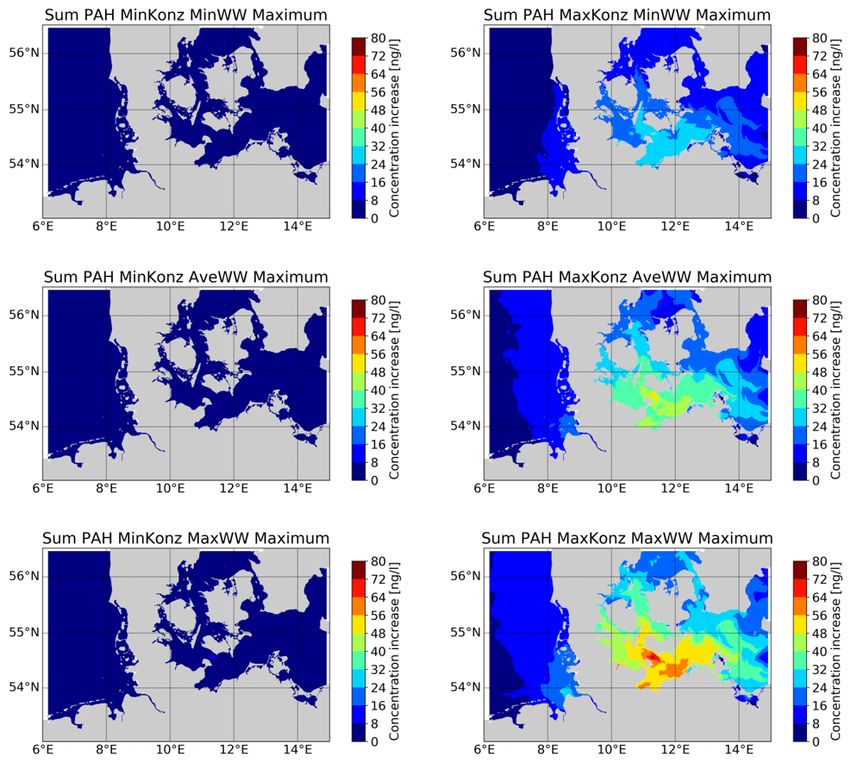
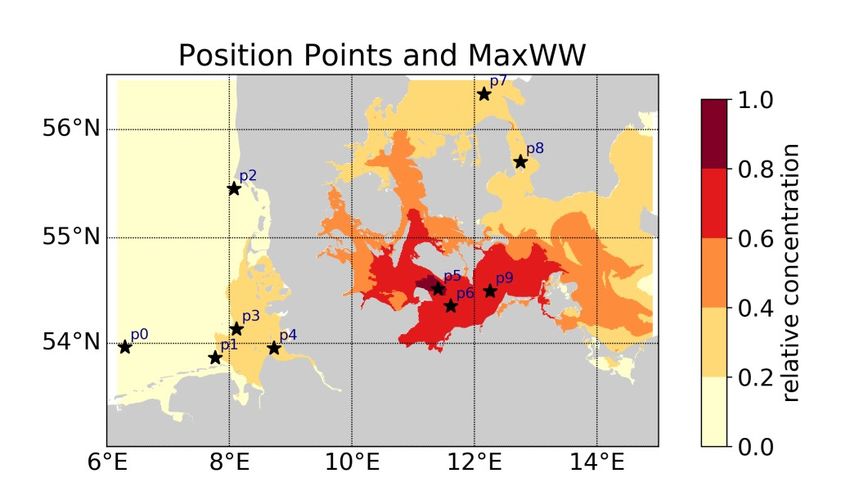
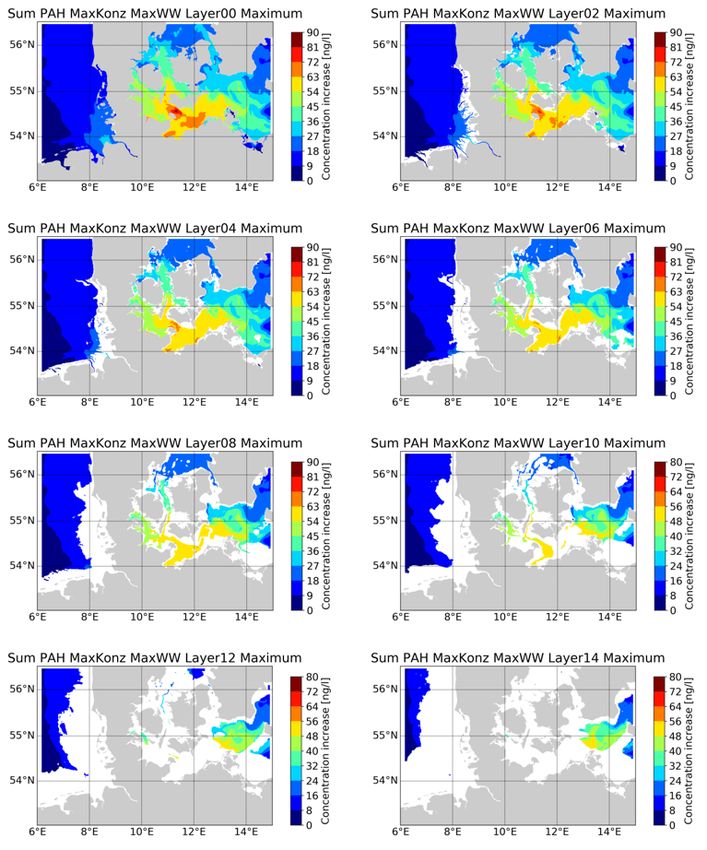
TEXTE Environmental Protection in Maritime Traffic – Scrubber Wash Water Survey – Final report

Figure 17: Bathymetry of the fine gridded area with a resolution of 900 m ...........................52
Figure 18: Example of wash water emission computed for the CSS for one day. The left
 picture shows the open-loop mode and the right picture shows the closed-loop
 mode of the EGCS. Red shapes indicate the Federal waterways. Please note the
 different scales of both figures................................................................................54
Figure 19: Wash water emission computed for the MIS for one day. Left picture shows open-
 loop and right side closed-loop EGCS. Red shapes indicate the Federal waterways.
 Please note: The order of magnitude of the closed-loop emissions are 1000 times
 lower ........................................................................................................................55
Figure 20: Total annual amount of emitted wash water from the EMMA model for the
 current state scenario (CSS), left, and the maximum installation scenario (MIS),
 right, after rasterization. Red shapes indicate the Federal waterways ..................57
Figure 21: Maximum concentration of wash water for CSS (left, one year) and MIS (right,
 three years). Wash water is modelled with the minimum wash water emission
 rate. (Consider different concentration scales).......................................................60
Figure 22: Maximum concentration of wash water for CSS (left, one year) and MIS (right,
 three years). Wash water is modelled with the average wash water emission rate.
 (Consider different concentration scales) ...............................................................60
Figure 23: Maximum concentration of wash water for CSS (left, one year) and MIS (right,
 three years). Wash water is modelled with the maximum wash water emission
 rate. (Consider different concentration scales).......................................................60
Figure 24: Maximum modelled concentration of Sum PAH in the CSS over one year in the
 surface layer. The pictures show different combinations of input data MinKonz
 and MaxKonz with MinWW, AveWW and MaxWW ...............................................66
Figure 25: Concentration increase of Sum PAH for CSS (MaxKonz_MaxWW) on the coarse
 gridded area ............................................................................................................67
Figure 26: Maximum concentration of Sum PAH in the MIS over three years. The pictures
 show different combinations of input data MinKonz and MaxKonz with MinWW,
 AveWW and MaxWW ..............................................................................................67
Figure 27: Maximum concentration of Sum PAH in the CSS over one year for eight different
 model layers (MaxKonz_MaxWW) ..........................................................................69
Figure 28: Maximum concentration of Sum PAH in the MIS over three years for eight
 different model layers (MaxKonz_MaxWW) ...........................................................70
Figure 29: Locations of the points for the time-series (black stars). The background is the
 concentration of wash water in the MIS relative to the highest value obtained in
 this scenario.............................................................................................................71
Figure 30: Concentration increase of Sum PAH at five different locations in the North Sea
 (CSS_MaxKonz_MaxWW) ........................................................................................72
Figure 31: Concentration increase of Sum PAH at five different locations in the Baltic Sea
 (CSS_MaxKonz_MaxWW) ........................................................................................73
Figure 32: Concentration increase of Sum PAH in the North Sea during the period 2015-2017
 with three wash water emission rates (MIS): AveWW (solid), MaxWW (dotted),
 MinWW (dotted) .....................................................................................................73

 10
TEXTE Environmental Protection in Maritime Traffic – Scrubber Wash Water Survey – Final report

Figure 33: Concentration increase of Sum PAH in the Baltic Sea during the period 2015-2017
 with three wash water emission rates (MIS): AveWW (solid), MaxWW (dotted),
 MinWW (dotted) .....................................................................................................74

 11
TEXTE Environmental Protection in Maritime Traffic – Scrubber Wash Water Survey – Final report

List of Tables
Table 1: Limit values for the sulphur (m/m) content of fuels used on board according to
 Regulations 14.1 and 14.4 of the MARPOL Convention Annex VI (Resolution
 MEPC.176 (58)) ........................................................................................................22
Table 2: Wash water discharge criteria as described in section 10.1 of the “2015 EGCS
 Guidelines” (Resolution MEPC.259 (68)) .................................................................24
Table 3: Information about the sampled ships (system, ship type) ......................................34
Table 4: Wash water volume (m3/h) at the discharge point (incl. dilution water), engine
 load (%MCR), flowrate (m3/MWh) during the sampling and sulphur content (%) of
 used fuel (na = data not available) ..........................................................................35
Table 5: Parameters, abbreviations and corresponding methods ........................................36
Table 6: Comparison of naphthalene (NAPH), phenanthrene (PHEN) and PAHEPA16 from
 different studies ......................................................................................................40
Table 7: Comparison of vanadium (V), nickel (Ni), zinc (Zn) and copper (Cu) concentrations
 (dissolved fraction) from BSH samples with other studies .....................................44
Table 8: Ship-monitoring data and BSH on-board measurement data of pH, turbidity and
 PAHPHE ......................................................................................................................45
Table 9: Comparison of PAHPHE on-board values with BSH laboratory analyses of PAHEPA16
 and Hydrocarbon Oil Index (HOI) ............................................................................48
Table 10: Ship data and wash water emissions (in open-loop mode) measured during
 sampling campaigns ................................................................................................56
Table 11: List of abbreviations of the six different contamination emissions: These are
 retrieved from three wash water emission rates (MinWW, AveWW, MaxWW) and
 from two measured concentrations during the sampling campaigns (Min_Konz
 and Max_Konz) ........................................................................................................58
Table 12: Statistics of distributed wash water from different types of EGCS: open-loop with
 maximum emission (open-loop max), closed-loop, combination of open-loop with
 maximum emission and closed-loop (both types) and ratio between closed-loop
 and open-loop concentration (CL/OL ratio). Listed are: maximum, average, and
 standard deviation (SD) of wash water concentration in l/m³ for the scenarios CSS
 and MIS ....................................................................................................................59
Table 13: Total annual wash water emissions (sum of open and closed-loop) and
 corresponding emissions (MinKonz_MinWW - MaxKonz_MaxWW) of the different
 analysed substances in the coarse gridded area (compare Figure 16) ...................61
Table 14: Maximum reached concentration for each substance for CSS over the total model
 period of one year in the surface layer. DF: Dissolved metals; SPM: metals in
 suspended particulate matter. Note the different units .........................................63
Table 15: Maximum concentration for each substance for the MIS over the total model
 period of three years in the surface layer. DF: Dissolved metals; SPM: metals in
 suspended particulate matter. Note the different units .........................................64

 12
TEXTE Environmental Protection in Maritime Traffic – Scrubber Wash Water Survey – Final report

Table A- 1: Amount of vessels with approved EGCS (as equivalent method) as notified by flag
 States in GISIS and the respective total fleet of those notifying parties .................84
Table A- 2: Supplier market share of EGCS in the maritime industry ........................................85
Table A- 3: Amount of vessels with approved EGCS (as equivalent method) by ship type and
 the respective total fleet of every ship type ...........................................................86
Table A- 4: Overview of analytical results for seawater inlet (I-O), open-loop discharges (O-O)
 and closed-loop discharges (C-AT) ..........................................................................87

 13
TEXTE Environmental Protection in Maritime Traffic – Scrubber Wash Water Survey – Final report

List of Abbreviations
 AAS Atomic absorption spectroscopy
 AA-EQS Annual average - environmental quality standard
 AEfS Air Emissions from Ships
 AIS Automatic Identification System
 AveWW Average wash water emission rate
 ASCII American Standard Code for Information Interchange

 BSH Bundesamt für Seeschifffahrt und Hydrographie (Federal Maritime and
 Hydrographic Agency, Germany)
 CDNI Strasbourg Convention on the Collection, Deposit and Reception of Waste
 during Navigation on the Rhine and Inland Waterways of 9 September 1996
 CL Closed-loop scrubber system
 CO2 Carbon dioxide
 CSS Current State Scenario 2018
 DF Dissolved fraction (referred to metals)
 DWD Deutscher Wetterdienst (German Weather Service)
 dwt Dead weight tons
 EAM Emission Abatement Methods
 ECA Emission Control Area
 EEZ Exclusive Economic Zone
 EGCS Exhaust Gas Cleaning System (scrubber)
 EMMA Emissions-Modell Marine Aktivitäten (Emission Model Marine Activities)
 EMSA European Maritime Safety Agency
 EPA US Environmental Protection Agency
 EQS Environmental quality standard
 FNU Formazine Nephelometric Units
 GISIS Global Integrated Shipping Information System
 HBM Hiromb BOOS Modell
 HFO Heavy fuel oil
 ICP-MS Inductively coupled plasma mass spectrometry
 HOI Hydrocarbon oil index
 IMO International Maritime Organisation
 MARPOL International Convention for the Prevention of Pollution from Ships of the
 International Maritime Organization
 LOD Limit of detection
 MAC-EQS Maximum allowable concentration - environmental quality standard
 MaxKonz Maximum of measured substance concentration in wash water
 MaxWW Maximum wash water emission rate
 MCR Maximum continuous rating
 MEPC Marine Environment Protection Committee
 MinKonz Minimum of measured substance concentration in wash water
 MinWW Minimum wash water emission rate

 14
TEXTE Environmental Protection in Maritime Traffic – Scrubber Wash Water Survey – Final report

 MIS Maximum Installation Scenario
 m/m Mass fraction (ratio of the mass of a particular substance to the total mass)
 MSFD Marine Strategy Framework Directive
 MWh Megawatt hour
 NetCDF Network Common Data Format
 ng nanogram
 nm Nautical miles
 NOx Nitrogen oxides
 NTU Nephlometric turbidity units
 OGewV Oberflächengewässerverordnung (Surface Water Ordinance)
 OL Open-loop scrubber system
 PAH Polycyclic Aromatic Hydrocarbon
 PAHPHE Polycyclic Aromatic Hydrocarbons as phenanthrene-equivalent
 pg picogram
 pH defined as the decimal logarithm of the reciprocal of the hydrogen ion activity
 ppm Parts per million
 PPR IMO Sub-Committee on Pollution Prevention and Response
 (S)ECA (Sulphur) Emission Control Area
 SeeUmwVerhV Verordnung über das umweltgerechte Verhalten in der Seeschifffahrt
 (Regulations on Environmentally Sustainable Behaviour in Maritime Shipping)
 SOx Sulphur oxides
 SPE Solid-phase extraction
 SPM Suspended particulate matter
 TXRF Total X-ray fluorescence spectroscopy
 UBA Umweltbundesamt (German Environment Agency)
 UNCLOS United Nations Convention on the Law of the Sea
 v Volume
 WFD Water Framework Directive
 WHG Wasserhaushaltsgesetz (Federal Water Act)
 ZHK-UQN Zugelassene Höchstkonzentation - Umweltqualitätsnorm

 15
TEXTE Environmental Protection in Maritime Traffic – Scrubber Wash Water Survey – Final report

Summary
International regulations (MARPOL Annex VI) for reducing sulphur emissions in the maritime
sector have introduced EGCS as an alternative technology to low sulphur fuels to minimize
atmospheric sulphur emissions from ships. Numerous flag States, organizations and ship
operators carry out research to address the concern that the use of EGCS might shift the
pollution from the atmosphere to the marine water body by additional energy expenditure.
Although this technique may improve the air quality, the consequences for the marine
environment are still unclear and an environmental risk assessment of this technique is still not
standardized.

The main aim of the study is to provide a basis for the evaluation of the increasing use of EGCS
technology on seagoing ships, particularly with regard to water and marine environment
protection. The focus was on gaining more knowledge on the characterization of the wash water
composition and to estimate expected wash water quantities to be discharged into the marine
environment by seagoing ships. The study is based on the information gathered by a sampling
campaign from five ships: three ships with a hybrid system, which were sampled under open
and closed-loop conditions, and two ships with an open-loop system.

The starting point for the study was a market analysis for EGCS as well as a survey of current
literature to gather publicly available information about the current spread and application of
the technique in shipping industry. The data found in Global Integrated Shipping Information
System (GISIS) served to evaluate the scrubber market. Because not all flag States participate by
actively notifying in GISIS, the databank is not complete. For that reason, the results might differ
from other market studies, but also because the latter include installations on-order and not
only systems that have already been installed. Those market studies revealed that by 2020
around 5% of the global fleet will be EGCS-equipped, followed by a stop in the market growth
after 2021. Furthermore, the data demonstrate that the market is dominated by open-loop
systems. A prognosis for the scrubber market after the first years of implementation of the 2020
Global Sulphur Cap is very uncertain because there are many factors affecting the decision of the
ship owners: fluctuating fuel prices, uncertain fuel demand and availability, modification of legal
framework and development of new technologies.

Furthermore, a concept of a practicable sampling campaign was developed in the absence of
established standards and ship operators were convinced to participate in this campaign. With
the help of valuable networks and good cooperation with the ship-owners, it was possible to
successfully carry out the elaborated sampling campaign and accompanying measurements on
board as well as the subsequent laboratory analysis of the wash water samples and data
obtained. During sampling, several limitations were faced, such as missing sampling points,
unsuitable material and unsuitable size of the tubing at the sampling points. For better
comparability in future investigations, better-designed sampling points are necessary to avoid
any contamination during sampling from the tubing or other contamination sources.

Several parameters for the characterization of the samples were required, for instance pH value,
the composition of dissolved components and suspended particulate matter. The wash water
samples were analysed for certain pollutant contents (e.g. PAHs, metals). In addition to the wash
water sampling and further chemical analysis, ship-specific data (e.g. engine performance data,

 16
TEXTE Environmental Protection in Maritime Traffic – Scrubber Wash Water Survey – Final report

EGCS specifics) as well as general operational conditions during the campaign such as speed,
engine load and fuel quality, were recorded and included in the evaluation of the test results.

The results of the chemical analyses demonstrated the presence of several substances scrubbed
out from the ship exhaust fumes. In general, closed-loop wash water showed higher
concentrations of the investigated compounds compared to open-loop wash water, due to the
water recirculation process and the lower flowrate. In particular, PAHs, nickel and vanadium
were enriched in both, open and closed-loop samples. Nitrate and nitrite did not show clearly
enrichment in open-loop wash water, due to high variability of inlet and outlet concentrations,
but elevated concentrations in the closed-loop system. The alkalinity was reduced to almost zero
in both systems and pH was decreased in the discharged wash water.

Since the BSH conducts a general monitoring of the chemical status of both, the North Sea and
the Baltic Sea, the data were used to discuss the measurement results from the EGCS campaign.
The concentrations of measured PAHs and several metals, in particular vanadium and nickel, in
the discharged wash water were in both EGCS modes significantly higher than current
environmental concentrations.

The comparison between the data generated by the ship-monitoring on-board unit and parallel
on-board measurements showed significant discrepancies, especially concerning turbidity and
PAHPHE. This demonstrates that the collection of reliable data by the online systems can only be
guaranteed with better specifications (e.g. more frequent maintenance and calibration, training
of the crew). Further research and calibration work for a clear definition and understanding of
PAHPHE are important to set comparable and protective threshold values to prevent the
discharge of PAHs or oil to the marine environment.

Based on the developed EGCS deployment scenarios (current state scenario (CSS): 81 ships with
EGCS; maximum installation scenario (MIS): 5,885 ships with EGCS) and using real ship
movement data, wash water dispersion simulations were calculated using a numerical transport
model. The results were used as basis for the calculation of pollutant dispersion and enrichment
in the North- and Baltic Sea due to EGCS operation. General assumptions were necessary for the
model regarding the scrubber type used. In the model, all ships were treated as if they were
equipped with hybrid systems and were using open-loop, where it is allowed. The results show a
low pollutants contribution of closed-loop discharge water compared to the total estimated
discharge (from both, closed- and open-loop) and demonstrate that, although concentrations are
significantly lower in open-loop systems (due to the high dilution), a significant quantity of
pollutants is emitted to the marine environment by the use of open-loop EGCS systems.
However, closed-loop discharges are a highly contaminated point source (especially for PAHs).

The results from the model calculations demonstrate that in areas with low water exchange, like
the Baltic Sea, wash water and thus pollutants enrichment is stronger than in areas with more
frequent water exchange like the North Sea. In the area with the highest modelled wash water
input, the sum of maximum modelled pollutant concentrations in the seawater and current
environmental concentrations were still below environmental assessment criteria (maximum
allowable concentrations, MAC-EQS) in both scenarios. However, depending on the scenario, the
modelled additional concentrations of investigated PAHs due to EGCS operation can reach
similar or even higher concentrations compared to current environmental concentrations.
Hence, wash water emissions from EGCS may lead to a significant increase of the environmental

 17
TEXTE Environmental Protection in Maritime Traffic – Scrubber Wash Water Survey – Final report

concentrations in areas with high ship traffic and low water exchange. Furthermore, the
modelled three years period (MIS) indicates ongoing increasing wash water accumulation over
the entire period, especially in the Baltic Sea. Therefore, the use and impact of EGCS in areas
with low water exchange (e.g. Baltic Sea, lagoons or harbours) or other sensitive areas needs to
be further investigated, in particular with regard to long-term effects.

Concluding, the increasing application of EGCS on ships may improve the air quality in harbour
cities and coastal areas, but will shift atmospheric pollution to the marine water body. The
presented EGCS study provides scientific data about the EGCS market, chemical wash water
characterization and modelled emissions to the water column to improve the understanding
about the potential impacts on the marine environment. Further research is needed to better
quantify and evaluate the total impact on the marine environment of this relatively new and
emerging abatement method. This has to include an environmental risk assessment of this new
technology, to provide sound scientific data for future recommendations and revision of related
regulations.

 18
TEXTE Environmental Protection in Maritime Traffic – Scrubber Wash Water Survey – Final report

Zusammenfassung
Internationale Vorschriften (MARPOL Anhang VI) zur Verringerung der Schwefelemissionen im
Seeverkehr lassen Abgasnachbehandlungssysteme als technische Alternative zu
schwefelreduzierten Kraftstoffen zu. Zahlreiche Flaggenstaaten, Organisationen und
Schiffsbetreiber forschen um herauszufinden, ob und inwieweit die Verwendung von EGCS die
Verschmutzung unter erhöhtem Energieaufwand aus der Atmosphäre in das Meer verlagern
könnte. Obwohl diese Technik die Luftqualität verbessern kann, sind die Folgen für die
Meeresumwelt noch unklar, und eine Umweltrisikobewertung dieser Technik ist noch nicht
standardisiert.
Hauptziel dieser Studie ist es, eine Grundlage für die Bewertung des zunehmenden Einsatzes der
EGCS-Technologie auf Seeschiffen zu schaffen, insbesondere im Hinblick auf den Gewässer- und
Meeresumweltschutz. Der Schwerpunkt lag auf der Gewinnung weiterer Erkenntnisse über die
Charakterisierung der Waschwasserzusammensetzung und der Abschätzung der zu
erwartenden Waschwassermengen, die von Seeschiffen in die Meeresumwelt abgegeben
werden. Die Studie basiert auf den Informationen von einer Probenahmekampagne auf fünf
Schiffen: Drei Schiffe mit einem Hybridsystem, die unter offenen und geschlossenen
Bedingungen getestet wurden, und zwei Schiffe mit einem offenen System.
Ausgangspunkt für die Studie waren eine Marktanalyse für EGCS sowie eine Analyse der bis dato
veröffentlichten Studien und öffentlich verfügbaren Informationen. Die im Global Integrated
Shipping Information System (GISIS) gefundenen Daten dienten der Bewertung des Marktes. Da
nicht alle Flaggenstaaten durch aktive Benachrichtigung in GISIS teilnehmen, ist die Datenbank
nicht vollständig. Aus diesem Grund können sich die Ergebnisse von anderen Marktstudien
unterscheiden, aber auch, weil letztere Anlagen im Auftrag und nicht nur bereits installierte
Systeme beinhalten. Diese Studien ergaben, dass bis 2020 rund 5% der weltweiten Flotte mit
EGCS ausgestattet sein werden, gefolgt von einem Stopp des Marktwachstums nach 2021.
Darüber hinaus zeigen die Daten, dass der Markt von Open-Loop-Systemen dominiert wird. Eine
Prognose für den EGCS-Markt nach den ersten Jahren der Einführung des Global Sulphur Cap ist
sehr unsicher, da es viele Faktoren gibt, die die Entscheidung der Reeder beeinflussen:
schwankende Kraftstoffpreise, ungewisse Kraftstoffnachfrage und -verfügbarkeit, Änderung der
rechtlichen Rahmenbedingungen und Entwicklung neuer Technologien.
Es galt, eine praktikable Probenahmekampagne in Abwesenheit etablierter Standards zu planen
und Schiffsbetreiber davon zu überzeugen, an dieser Kampagne mitzuwirken. Mithilfe
wertvoller Netzwerke und guter Kooperation der Reederschaft gelang es, die ausgearbeitete
Probenahme und begleitende Messungen an Bord sowie die anschließende Analyse der
Waschwasserproben und erlangten Daten erfolgreich durchzuführen. Bei der Probenahme gab
es mehrere Einschränkungen, wie z.B. das Fehlen geeigneter Probenahmestellen oder
ungeeignete Materialien und Dimensionen der Leitungen an den Entnahmepunkten. Die
Bedingungen für eine kontaminationsfreie Probenahme waren daher häufig unzureichend. Für
eine bessere Vergleichbarkeit bei zukünftigen Untersuchungen sind besser ausgelegte
Probenahmestellen erforderlich, um eine Kontamination während der Probenahme durch das
Rohrmaterial oder anderen Kontaminationsquellen zu vermeiden.
Das erforderliche Minimum für die Charakterisierung der Proben waren z.B. pH-Wert, die
Zusammensetzung von gelösten Komponenten und Schwebstoffe. Die Waschwasserproben
wurden auf bestimmte Schadstoffgehalte (z.B. PAK, Metalle) analysiert. Neben der
Waschwasserprobenahme und weiteren Messungen sollten auch schiffsspezifische Daten (z.B.
Motorleistungsdaten, EGCS-Eigenschaften) sowie allgemeine Betriebsbedingungen während der
Kampagne wie Schiffsgeschwindigkeit, Motorlast, Kraftstoffqualität, etc. erfasst und in die
 19
TEXTE Environmental Protection in Maritime Traffic – Scrubber Wash Water Survey – Final report

Auswertung der Testergebnisse einbezogen werden. Diese Analysen zeigten, dass neben dem
Schwefel auch weitere Schadstoffe aus den Schiffsabgasen ausgewaschen wurden. Im
Allgemeinen zeigte das Waschwasser im Closed-Loop aufgrund der Wasserrezirkulation und des
niedrigeren Durchflusses eine höhere Konzentration der untersuchten Verbindungen als das
Waschwasser aus Open-Loop Systemen. Insbesondere PAKs, Nickel und Vanadium wurden
sowohl in Closed- als auch Open-Loop Proben angereichert. Nitrat und Nitrit zeigten keine
eindeutige Anreicherung im Open-Loop Waschwasser, da die Einlass- und
Auslasskonzentrationen sehr variabel waren. Es wurden aber erhöhte Konzentrationen im
Closed-Loop System gemessen. Die Alkalinität wurde im Waschwasser beider EGCS-Systeme auf
nahezu Null reduziert und der pH-Wert im abgeleiteten Waschwasser deutlich gesenkt.
Das BSH betreibt regelmäßig ein chemisches Monitoring, das zur Zustandsbewertung von Nord-
und Ostsee beiträgt. Chemische Umweltbelastungsdaten aus dieser Quelle wurden ebenfalls zur
Validierung der Messergebnisse aus der EGCS-Kampagne herangezogen. Die Konzentrationen
der gemessenen PAKs und mehrerer Metalle, insbesondere Vanadium und Nickel, im
Waschwasser waren in beiden untersuchten EGCS-Modi signifikant höher als die aktuellen
Umgebungskonzentrationen.
Der Vergleich zwischen den Daten, die von der schiffseigenen Online-Messeinrichtung und den
parallelen Messungen vom BSH an Bord erzeugt wurden, ergab signifikante Unterschiede,
insbesondere bei der Trübung und dem PAHPHE. Dies zeigt, dass die Erfassung zuverlässiger
Daten durch die Onlinesysteme nur mit besseren Vorgaben (z.B. häufigere Wartung und
Kalibrierung, Schulung der Besatzung) gewährleistet werden können. Weitere Forschungs- und
Kalibrierarbeiten für eine Definition und ein klares Verständnis von PAHPHE sind notwendig, um
vergleichbare und ambitionierte Grenzwerte festzulegen, um die Einleitung von PAKs oder Öl in
die Meeresumwelt zu verhindern.
Basierend auf den entwickelten EGCS-Einsatzszenarien (Current State Scenario (CSS): 81 Schiffe
mit EGCS; Maximum Installation Scenario (MIS): 5.885 Schiffe mit EGCS) und unter Verwendung
realer Schiffsbewegungsdaten wurden Waschwasserausbreitungssimulationen mit einem
numerischen Transportmodell berechnet. Diese bilden die Grundlage für die weitere
Betrachtung der Schadstoffverteilung und -anreicherung in der Nord- und Ostsee durch den
EGCS-Betrieb. Allgemeine Annahmen waren hinsichtlich des verwendeten Scrubbertypes
erforderlich. Im Modell verwenden alle Schiffe Hybrid-Systeme. Es wurden angenommen, dass
sie im Open-Loop Betriebszustand fahren, wo es erlaubt ist. Dies ergibt, im Vergleich zur
abgeschätzten Gesamtemission aus allen EGCS-Systemen, einen geringen Beitrag aus Closed-
Loop Systemen. Weiterhin konnte gezeigt werden, dass die Konzentrationen in Open-Loop
Waschwasser zwar vergleichsweise deutlich niedriger sind (aufgrund der hohen Verdünnung),
aber durch das beträchtliche Einleitungsvolumen eine erhebliche Menge an Schadstoffen in die
Meeresumwelt abgeben wird. Emissionen aus Closed-Loop Scrubbern sind dagegen eine
hochkontaminierte Punktquelle (insbesondere für PAKs).
Die Ergebnisse der Modellrechnungen zeigen, dass in Gebieten mit geringem Wasseraustausch,
wie der Ostsee, die Anreicherung von Waschwasser und damit von Schadstoffen stärker ist als in
Gebieten mit häufigerem Wasseraustausch, wie der Nordsee. In dem Gebiet mit dem höchsten
modellierten Waschwassereintrag, lag die Summe der maximal modellierten
Schadstoffkonzentrationen im Meerwasser und der aktuellen Umweltkonzentrationen in beiden
Szenarien noch unter den Umweltqualitätsnormen (zugelassene Höchstkonzentration, ZHK-
UQN). Je nach Szenario können die modellierten Konzentrationen der untersuchten Schadstoffe
z.B. PAKs jedoch ähnliche oder sogar höhere Konzentrationen erreichen als die aktuellen
Umgebungskonzentrationen. Daher könnten Waschwasseremissionen aus EGCS zu einem
signifikanten Anstieg der Umgebungskonzentrationen in Gebieten mit hohem Schiffsverkehr
 20
TEXTE Environmental Protection in Maritime Traffic – Scrubber Wash Water Survey – Final report

und geringem Wasseraustausch führen. Darüber hinaus wird im modellierten
Dreijahreszeitraum (MIS) eine kontinuierlich steigende Waschwasserakkumulation ermittelt,
insbesondere in der Ostsee. Daher sollte der Einsatz und die Auswirkungen von EGCS vor allem
in Gebieten mit niedrigem Wasseraustausch (z.B. Ostsee, Buchten oder Häfen) oder anderen
sensiblen Gebieten weiter untersucht werden, insbesondere im Hinblick auf langfristige
Auswirkungen.
Zusammenfassend kann festgestellt werden, dass der zunehmende Einsatz von EGCS Systemen
auf Schiffen zwar die Luftqualität in Hafenstädten und Küstengebieten verbessern kann, aber
dabei die Schadstoffe nicht aus der Umwelt entfernt, sondern lediglich in den marinen
Wasserkörper verlagert werden. Diese EGCS-Studie liefert wissenschaftliche Daten über den
EGCS-Markt, die chemische Zusammensetzung des Waschwassers und eine Abschätzung des
Eintrags in die Wassersäule, um das Verständnis über die möglichen Auswirkungen auf die
Meeresumwelt zu verbessern. Weitere Forschungsarbeiten sind erforderlich, um die
Gesamtauswirkungen dieser relativ neuen Abgasreinigungstechnologie auf die Meeresumwelt
besser zu quantifizieren und zu bewerten. Dazu könnte eine umfassende
Umweltrisikobewertung dieser Technik gehören, die fundierte wissenschaftliche Daten für die
Entwicklung künftiger Empfehlungen und die Weiterentwicklung von Vorschriften und
Regelungen bietet.

 21
TEXTE Environmental Protection in Maritime Traffic – Scrubber Wash Water Survey – Final report

1 Introduction
1.1 Overview
Even though maritime transport has the highest relative energy efficiency pro carried cargo
compared to other means of transportation (IMO, 2019), its contribution to global air pollution
has to be considered significant. On most ships the main engines, especially the older designs of
2-stroke and 4-stroke engines, rely on the use of heavy fuel oil (HFO), which is a residue of crude
oil distillation characterized by its high viscosity and high sulphur content. Sulphur oxides (SOx),
formed during fuel combustion, are air pollutants of great concern that have negative impacts on
human health (e.g. on the respiratory system, especially due to fine sulphur particles) as well as
on the environment (as precursor of acid rain, affecting aquatic species, forests and crops and
contributing to acidification of the oceans). The continuous growth of marine traffic has raised
concerns worldwide about the ecological impact of the shipping industry, leading to international
environmental regulations to improve the air quality (IMO, 2019).
On 19 May 2005, Annex VI of the International Convention for the Prevention of Pollution from
Ships (MARPOL Convention) of the International Maritime Organization (IMO) entered into
force in order to prevent air pollution from ships, regulating and specifying limit values for the
main sources of air pollution, inter alia, SOx, NOx and CO2. A revision was adopted during the 58th
session of the Marine Environment Protection Committee (MEPC) and entered into force on
1 July 2010. This revision gradually strengthened the limit values considering the technology
development and experience gained through its implementation. Regarding the SOx emissions,
the global progressive reduction on sulphur content in fuels are incorporated in Regulation 14.1,
commonly referred to as the Global Sulphur Cap. Special areas have been designated (ECA-
Emission Control Areas) where limit values (Regulation 14.4) were set even lower, as exhibited
in Table 1. The Baltic Sea, North Sea, American Caribbean Sea and North America are currently
defined as designated areas where the ECA Sulphur Cap applies (IMO, 2019).

Table 1: Limit values for the sulphur (m/m) content of fuels used on board according to
 Regulations 14.1 and 14.4 of the MARPOL Convention Annex VI (Resolution
 MEPC.176 (58))

 Global requirements (S)ECA requirements

 4.50% m/m prior to 1 January 2012 1.50% m/m prior to 1 July 2010

 3.50% m/m on and after 1 January 2012 1.00% m/m on and after 1 July 2010

 0.50% m/m on and after 1 January 2020 0.10% m/m on and after 1 January 2015

Regulation 4.1 of MARPOL Annex VI (Resolution MEPC.176 (58)) allows for “any fitting,
material, appliance or apparatus to be fitted in a ship or other procedures, alternative fuel oils,
or compliance methods used as an alternative to that required by this Annex if such (…) are at
least as effective in terms of emissions reductions as that required by this Annex, including any
of the standards set forth in regulations 13 and 14“. Regulation 4.4 of Annex VI states that those
alternatives shall endeavour not to impair or damage the environment, human health, property,
or resources. Exhaust Gas Cleaning Systems (EGCS), commonly referred to as “scrubbers”, are
recognized as an equivalent compliance method according to Regulation 4 of MARPOL Annex VI,
capable of fulfilling the aforementioned standards of Regulation 14 while still allowing for the
use of non-compliant fuel. Although this alternative was originally conceived as an exception and
was intended to enable the medium-term operation of older propulsion technologies unsuitable

 22
You can also read