Eukaryotic Biodiversity and Spatial Patterns in the Clarion-Clipperton Zone and Other Abyssal Regions: Insights From Sediment DNA and RNA ...
←
→
Page content transcription
If your browser does not render page correctly, please read the page content below
ORIGINAL RESEARCH
                                                                                                                                               published: 25 May 2021
                                                                                                                                      doi: 10.3389/fmars.2021.671033

                                            Eukaryotic Biodiversity and Spatial
                                            Patterns in the Clarion-Clipperton
                                            Zone and Other Abyssal Regions:
                                            Insights From Sediment DNA and
                                            RNA Metabarcoding
                                            Franck Lejzerowicz 1,2* , Andrew John Gooday 3,4 , Inés Barrenechea Angeles 5,6 ,
                                            Tristan Cordier 5,7 , Raphaël Morard 8 , Laure Apothéloz-Perret-Gentil 9 , Lidia Lins 10 ,
                                            Lenaick Menot 11 , Angelika Brandt 12,13 , Lisa Ann Levin 14 , Pedro Martinez Arbizu 15 ,
                                            Craig Randall Smith 16 and Jan Pawlowski 5,9,17
                          Edited by:        1
                                              Center for Microbiome Innovation, University of California, San Diego, San Diego, CA, United States, 2 Department
                     Chiara Romano,
                                            of Pediatrics, University of California, San Diego, San Diego, CA, United States, 3 National Oceanography Centre,
      Center for Advanced Studies of
                                            Southampton, United Kingdom, 4 Life Sciences Department, Natural History Museum, London, United Kingdom,
                 Blanes (CSIC), Spain       5
                                              Department of Genetics and Evolution, University of Geneva, Geneva, Switzerland, 6 Department of Earth Sciences,
                       Reviewed by:         University of Geneva, Geneva, Switzerland, 7 NORCE Climate, NORCE Norwegian Research Centre AS, Bjerknes Centre
             Owen S. Wangensteen,           for Climate Research, Bergen, Norway, 8 MARUM – Center for Marine Environmental Sciences, University of Bremen,
  UiT The Arctic University of Norway,      Bremen, Germany, 9 ID-Gene Ecodiagnostics, Campus Biotech Innovation Park, Geneva, Switzerland, 10 Marine Biology
                               Norway       Research Group, Ghent University, Ghent, Belgium, 11 IFREMER, REM/EEP/LEP, Centre de Bretagne, Plouzané, France,
                    Vera G. Fonseca,        12
                                               Senckenberg Research Institute and Natural History Museum, Frankfurt, Germany, 13 Institute for Ecology, Evolution
    Centre for Environment, Fisheries       and Diversity, Goethe University Frankfurt, Frankfurt, Germany, 14 Integrative Oceanography Division, Center for Marine
   and Aquaculture Science (CEFAS),         Biodiversity and Conservation, Scripps Institution of Oceanography, University of California, San Diego, San Diego, CA,
                     United Kingdom         United States, 15 German Centre for Marine Biodiversity Research, Senckenberg am Meer, Wilhelmshaven, Germany,
                                            16
                  *Correspondence:             Department of Oceanography, University of Hawai‘i at Mānoa, Honolulu, HI, United States, 17 Institute of Oceanology,
                    Franck Lejzerowicz      Polish Academy of Sciences, Sopot, Poland
               flejzerowicz@ucsd.edu

                                            The abyssal seafloor is a mosaic of highly diverse habitats that represent the least
                 Specialty section:
       This article was submitted to        known marine ecosystems on Earth. Some regions enriched in natural resources, such
Deep-Sea Environments and Ecology,          as polymetallic nodules in the Clarion-Clipperton Zone (CCZ), attract much interest
             a section of the journal
         Frontiers in Marine Science
                                            because of their huge commercial potential. Since nodule mining will be destructive,
        Received: 22 February 2021
                                            baseline data are necessary to measure its impact on benthic communities. Hence, we
           Accepted: 19 April 2021          conducted an environmental DNA and RNA metabarcoding survey of CCZ biodiversity
           Published: 25 May 2021           targeting microbial and meiofaunal eukaryotes that are the least known component of
                              Citation:     the deep-sea benthos. We analyzed two 18S rRNA gene regions targeting eukaryotes
            Lejzerowicz F, Gooday AJ,
    Barrenechea Angeles I, Cordier T,       with a focus on Foraminifera (37F) and metazoans (V1V2), sequenced from 310 surface-
 Morard R, Apothéloz-Perret-Gentil L,       sediment samples from the CCZ and other abyssal regions. Our results confirm huge
 Lins L, Menot L, Brandt A, Levin LA,
     Martinez Arbizu P, Smith CR and
                                            unknown deep-sea biodiversity. Over 60% of benthic foraminiferal and almost a third
       Pawlowski J (2021) Eukaryotic        of eukaryotic operational taxonomic units (OTUs) could not be assigned to a known
     Biodiversity and Spatial Patterns      taxon. Benthic Foraminifera are more common in CCZ samples than metazoans and
       in the Clarion-Clipperton Zone
 and Other Abyssal Regions: Insights        dominated by clades that are only known from environmental surveys. The most striking
       From Sediment DNA and RNA            results are the uniqueness of CCZ areas, both datasets being characterized by a high
                      Metabarcoding.
            Front. Mar. Sci. 8:671033.
                                            number of OTUs exclusive to the CCZ, as well as greater beta diversity compared
    doi: 10.3389/fmars.2021.671033          to other abyssal regions. The alpha diversity in the CCZ is high and correlated with

Frontiers in Marine Science | www.frontiersin.org                                  1                                              May 2021 | Volume 8 | Article 671033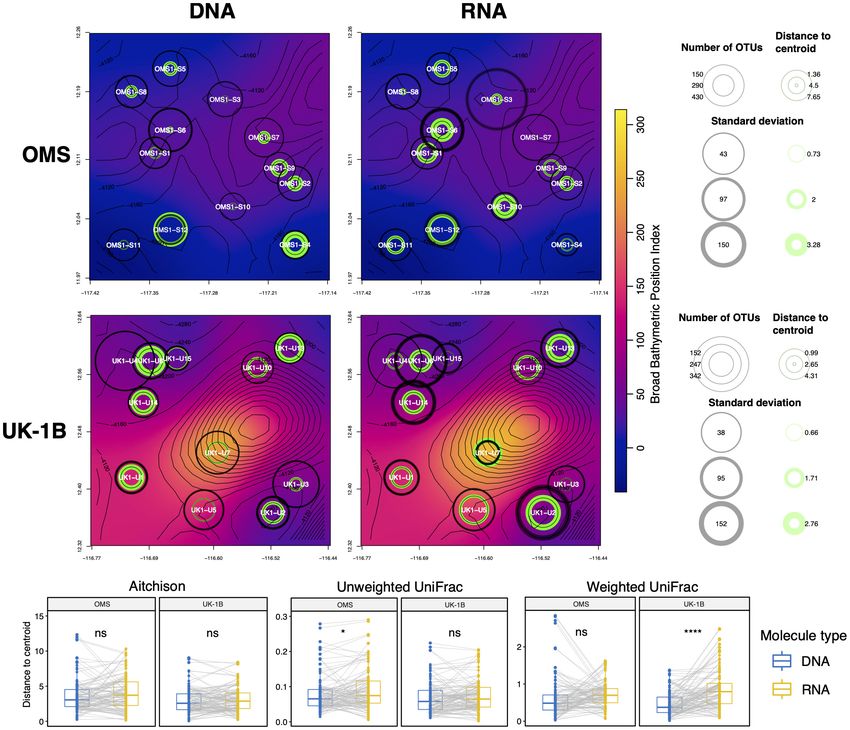
Lejzerowicz et al.                                                                                                Eukaryotic eDNA/eRNA From CCZ Benthos

                                            water depth and terrain complexity. Topography was important at a local scale, with
                                            communities at CCZ stations located in depressions more diverse and heterogeneous
                                            than those located on slopes. This could result from eDNA accumulation, justifying the
                                            interim use of eRNA for more accurate biomonitoring surveys. Our descriptions not
                                            only support previous findings and consolidate our general understanding of deep-
                                            sea ecosystems, but also provide a data resource inviting further taxon-specific and
                                            large-scale modeling studies. We foresee that metabarcoding will be useful for deep-
                                            sea biomonitoring efforts to consider the diversity of small taxa, but it must be validated
                                            based on ground truthing data or experimental studies.
                                            Keywords: deep-sea sediment, eukaryotic biodiversity, Foraminifera, metazoans, 18S rRNA gene, bioinformatics,
                                            seafloor bathymetry

INTRODUCTION                                                                      notably in the deep-sea sediment (Lejzerowicz et al., 2013a;
                                                                                  Corinaldesi et al., 2018), justifies the use of environmental
The deep seabed encompasses a vast mosaic of poorly sampled                       RNA (eRNA). Indeed, eRNA has been proposed as a proxy
habitats, many of them characterized by fine-grained sediments                    for active species in various environments (Logares et al.,
that, for more than 50 years, have been known to host                             2012; Adamo et al., 2020; Giner et al., 2020). It yields
surprisingly high levels of biodiversity (Hessler and Sanders,                    compositions that differ from eDNA in deep-sea sediments
1967; Ramirez-Llodra et al., 2010; Rex and Etter, 2010). It                       (Guardiola et al., 2016) and may therefore be more useful for
conceals a variety of material resources, services and history that               interpreting biodiversity and biogeographic patterns. Yet further
are of cultural value to human societies (Wenhai et al., 2019;                    understanding of deep-sea processes can be obtained using
Turner et al., 2020) as well as ecosystems of considerable and                    metabarcoding, since this environment offers ideal conditions
growing economic importance (Armstrong et al., 2012; Thurber                      for the preservation of biomolecules, including eRNA which
et al., 2014). However, estimating and conserving deep-sea                        may persist in complex forms (Cristescu, 2019; Wood et al.,
biodiversity remain major challenges (Costello and Chaudhary,                     2020).
2017), with many of the species found in deep-sea samples being                      Besides fundamental methodological issues, the use of
undescribed (Glover et al., 2018). In some groups, this novelty                   metabarcoding has practical benefits in the context of current
is often at high taxonomic levels (Goineau and Gooday, 2019).                     and likely future human impacts on ocean-floor communities
Alongside biodiversity, understanding biogeographic patterns of                   (Glover and Smith, 2003; Thiel, 2003; Levin et al., 2020a; Le et al.
benthic species on the ocean floor has been a long-standing                       in revision), combined with the growing and far-reaching effects
and fundamental concern in deep-sea biology (Ekman, 1953;                         of global climatic changes (Levin and Le Bris, 2015; Danovaro
Vinogradova, 1997). In some cases, species horizontal ranges                      et al., 2017; Sweetman et al., 2017; Morato et al., 2020), which
appear to be wider in the deep sea, particularly at abyssal depths,               will alter areas targeted for deep seabed mining (Levin et al.,
than in shelf and coastal waters (McClain and Hardy, 2010;                        2020b). The largest proportion of our samples was obtained in
Costello and Chaudhary, 2017), as landscapes of overlooked                        the eastern equatorial Pacific Clarion-Clipperton Zone (CCZ).
habitats such as bedrock offer corridors for dispersal (Riehl                     This area lies beyond national jurisdictions (Rabone et al., 2019)
et al., 2020). However, the sheer scale of undescribed deep-                      and hosts vast deposits of polymetallic nodules (Hein et al., 2013;
sea biodiversity, combined with the rarity of many species and                    Petersen et al., 2016) that are the focus of an emerging seabed
the vast spatial extent and chronic under-sampling of the deep                    mining industry regulated by the International Seabed Authority
seabed, make it very difficult to establish geographical ranges                   (ISA). These activities will impact benthic ecosystems in a variety
and the prevalence of endemicity, particularly for species that                   of ways (Levin et al., 2016) and likely lead to the irreversible loss
are small in size.                                                                of biodiversity (Niner et al., 2018), at least locally (Vonnahme
   Previous attempts to tackle deep-sea biodiversity and                          et al., 2020). The ISA requires contractors licensed for mineral
biogeography have been based mainly on morphological analyses,                    exploration and prospecting within the CCZ to conduct baseline
with a bias toward larger, more conspicuous animals (Higgs                        surveys of benthic biodiversity, and subsequent exploitation
and Attrill, 2015). These issues have been explored using                         contracts will require monitoring of mined areas to evaluate
metabarcoding (Taberlet et al., 2012), which is mainly based                      environmental impacts. Metabarcoding in the CCZ has been
on environmental DNA (eDNA) and thus rather biased toward                         restricted to eDNA. It has been used to document prokaryotes in
small, more inconspicuous taxa. Metabarcoding studies targeting                   nodules (Blöthe et al., 2015) and in comparison with surrounding
the DNA of bacteria (Zinger et al., 2011), Foraminifera (Lecroq                   sediments and overlying water (Lindh et al., 2017, 2018), whereas
et al., 2011) as well as protists and meiofaunal animals                          eukaryotic studies pointing to the importance of habitat diversity
(Bik et al., 2012; Guardiola et al., 2015; Sinniger et al.,                       and eDNA transport (Laroche et al., 2020a,b) were limited to
2016) were conducted at global scale in the deep sea, but                         the Western CCZ. No comparison with other abyssal regions
with relatively few samples. Evidence for DNA preservation,                       was yet attempted.

Frontiers in Marine Science | www.frontiersin.org                             2                                        May 2021 | Volume 8 | Article 671033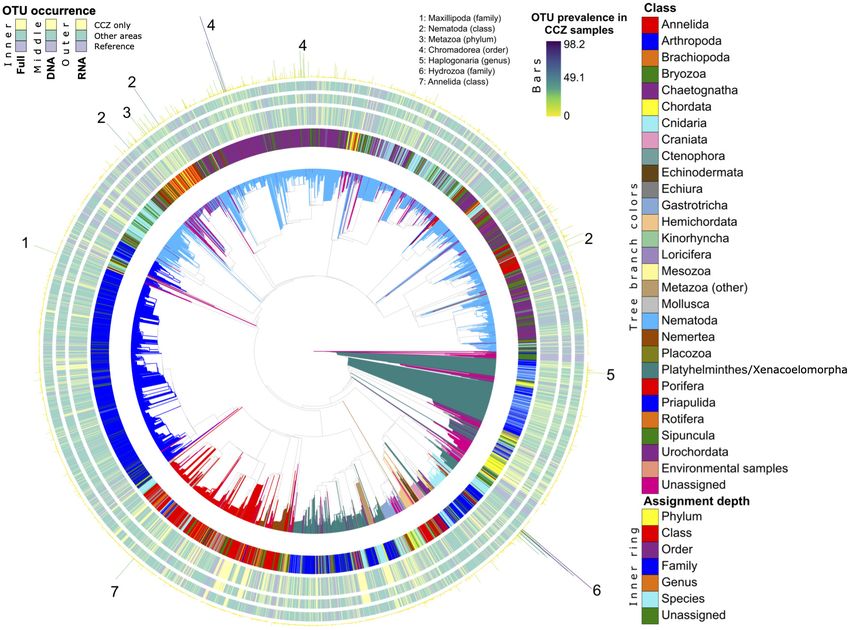
Lejzerowicz et al.                                                                                       Eukaryotic eDNA/eRNA From CCZ Benthos

   Here, we perform eDNA and eRNA metabarcoding on 310                    Preservation Solution (6 ml) before shipment to the University of
deep-sea sediment samples from the Eastern CCZ and other                  Geneva (Switzerland). For each station, the latitude and longitude
abyssal regions, including Northwest Pacific, Southern Ocean              were used to obtain environmental data layers presented in
and several Atlantic regions in order to identify biogeographic           Howell et al. (2016), including seafloor slope (in degrees) and
patterns at larger scales and their relation to key environmental         Bathymetric Position Indices (BPI, Broad, and Fine). A positive
parameters at local scales, notably topographic heterogeneity.            BPI value indicates a location higher than its surroundings (e.g.,
We rely on two 18S rRNA gene markers to reconstruct the                   ridges) whereas a negative value indicates features such as valleys
taxonomic composition, diversity and distribution of benthic              and troughs (Weiss, 2001).
Foraminifera (37F marker) and Metazoa (V1V2 marker) that live
or have lived in the Eastern CCZ region and explore some basic
questions concerning: (1) the composition of sediment-dwelling
                                                                          Nucleic Acids Extraction, PCR
eukaryotic assemblages at abyssal depths in the oceans; (2) levels        Amplification and High-Throughput
of alpha diversity at particular abyssal sites and how they compare       Sequencing
over different spatial scales; and (3) global (between oceans) to         For each of 310 sediment samples, the total RNA and DNA
local (between stations) biogeographic patterns based on beta             contents of ca. 2 g of material were extracted as in Lejzerowicz
diversity turnover and dispersion. We rely on compositionally             et al. (2015) and cDNA was generated from DNase-treated RNA
aware techniques that are necessary for omics data analysis,              as in Pawlowski et al. (2014). It was ensured that no DNA
and on phylogenetic metrics to reflect on the evolutionary                molecules carried over into the RNA extracts based on the
relatedness of communities sampled from eDNA or eRNA, that                absence of PCR amplification with each primer set and after
we systematically compare for more insightful interpretation. We          60 cycles. From each sample, approximately 21 ng of DNA
discuss our conclusions in the context of recent metabarcoding            and cDNA extract were incorporated in 30-µl volume PCR
and eco-evolutionary studies in the CCZ, in order to understand           amplifications performed in duplicate for each of the two 18S
how environmental molecular data can be applied in future                 rRNA gene amplification primers pairs targeting Foraminifera
baseline surveys and the importance of small-sized organisms              and Eukaryota (Supplementary Table 1 and Supplementary
for deep-sea management and conservation in the face of rising            Material): the 37F hypervariable region using primers s14F1 and
pressures to mine minerals from the abyssal seafloor.                     s15 (Lejzerowicz et al., 2014), and the V1V2 region using R22mod
                                                                          and F04 (Sinniger et al., 2016). Forward and reverse primers
                                                                          tagged at their 50 -ends with 8-nt tags were used in order to
MATERIALS AND METHODS                                                     pool different amplicons to the same libraries and demultiplex
                                                                          the resulting reads to samples. The tagged primer combinations
Description of the Deep-Sea Sediment                                      and their dispatching to libraries were designed to avoid and
Sampling and Environmental Variable                                       detect sequence-to-sample misidentifications due to mistagging
Deep-sea sediments were collected at abyssal depths during                (Esling et al., 2015) and to balance the base composition of
eight expeditions to the Atlantic, Southern and Pacific Oceans            the first sequenced positions (Illumina template cycles, see
(Figure 1). The largest number of samples originated from the             Mitra et al., 2015). The PCR duplicates of a given sample
Clarion-Clipperton Zone (CCZ) in the eastern Equatorial Pacific.          were amplified using the same tagged primer combinations,
They were taken mainly at the eastern end of this region, during          but pooled in different sequencing libraries in order to be
the MANGAN’16 cruise in the BGR exploration license area and              able to analyze them separately. In total, 1,998 PCR products
during the second ABYSSLINE cruise (AB02) in Stratum B (one               were mixed into 51 pools (on average: 44 ng per PCR; 39.2
of two 30 × 30 km study areas in which most samples were                  PCRs per pool). The pools were transformed into sequencing
collected) of the UK-1 license area (hereafter called UK-1B) and          libraries using the TruSeq Nano PCR-free Library Preparation
a similar stratum within the OMS area. These two AB02 strata              Kit, which were Illumina-sequenced on two HiSeq 2500 runs
have very different topographies: UK-1B has approximately ten             (2 lanes; 36 libraries) and 5 MiSeq runs (5 lanes; 15 libraries).
volcanic seamounts and hills on the abyssal plain, whereas the            Strict procedures were respected to limit extraneous and cross
OMS stratum is much flatter with low, gently undulating abyssal           contamination: (i) maximum 12 samples per session (one PCR
ridges and troughs. Some samples were taken in the French                 session included the four markers and duplicates), (ii) separate
(IFREMER) license area, located further to the west although still        laboratory spaces for no-DNA (PCR preparation), low-DNA
in the eastern half of the CCZ, during the BIONOD cruise. Sterile         (extraction and DNA/RNA/cDNA handling) and high-DNA
or disposable spoons were used to subsample the top surface               (post-PCR) concentrations, (iii) lab coat and gloves worn at all
sediment centimeter (ca. 2 g) according to a nested sampling              time, (iv) cleaning with DNA AWAYTM Surface Decontaminant
design: up to three replicates per core; up to two cores per coring       (Thermo Fisher Scientific), and (v) wiping of each pipet tip on
device deployment, and up to three deployments per station that           absorbent paper to avoid releasing the aerosols of primer, DNA or
were grouped into 16 areas and six larger regions (Table 1).              PCR products before gentle tip disposal. Technical information
Approximately 2 ml of fresh surficial sediments were collected            for each sample along with environmental variables and metadata
with a multiple corer and placed in sterile tubes at −80◦ C with          information required by the MIMARKs standards (Yilmaz et al.,
(VEMA, SYSTCO II, KuramBio I, MANGAN’16, and AB02) or                     2011), including sequence frequencies after each filtering step (see
without (MSM39, DIVA-3, and BIONOD) LifeGuard (Qiagen)                    next section), are available in Supplementary Table 2. Data and

Frontiers in Marine Science | www.frontiersin.org                     3                                       May 2021 | Volume 8 | Article 671033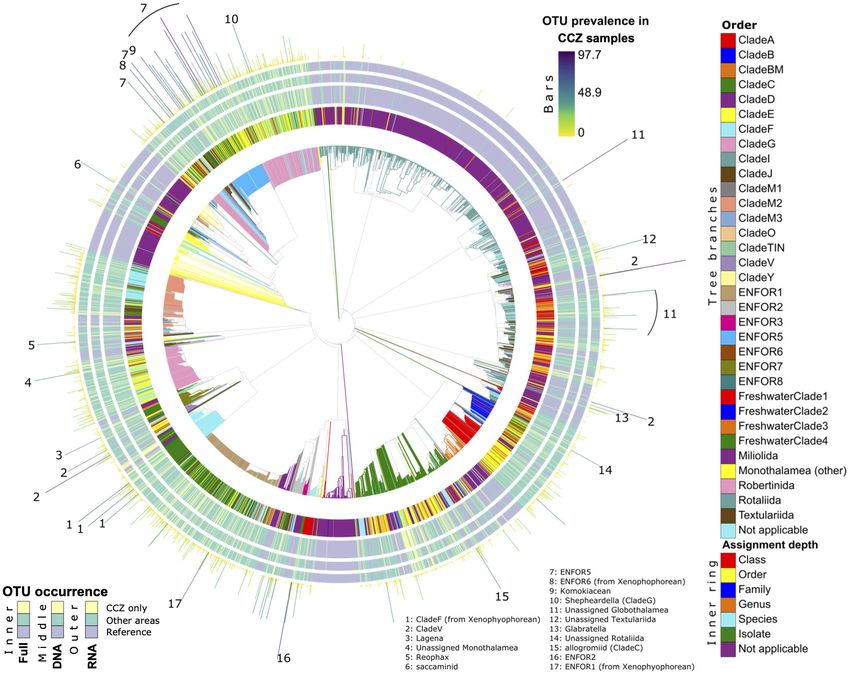
Lejzerowicz et al.                                                                                                              Eukaryotic eDNA/eRNA From CCZ Benthos

    FIGURE 1 | Location of the sequenced sediment samples. Samples in the Pacific Ocean include two regions: the CCZ (five different areas, see inset) and the
    Northwest Pacific (Kuril-Kamchatka area). Samples in the Atlantic Ocean include three regions (North, Mid, and South Atlantic), as well as three areas (and stations)
    in the Southern Ocean region.

metadata are publicly available in FigShare1 and at the European                          Reference Databases and Taxonomic
Bioinformatics Institute under accession number PRJEB44134.                               Assignments
                                                                                          For the taxonomic assignment of foraminiferal OTUs, an
Bioinformatic Sequence Data Processing                                                    alignment of 3,145 18S rRNA gene sequences belonging to
HiSeq sequencing generated ambiguous bases at a few positions                             classes Monothalamea, Globothalamea, and Tubothalamea as
corresponding to the amplification primer sequences (i.e., after                          well as planktonic isolates was curated (PRF2 , Morard et al.,
the tags; Supplementary Figure 1). A python script was used                               2015). Each sequence entails the hypervariable 37F region that
to correct these ambiguities if their number corresponded to                              has proved powerful for foraminiferal species identification
the hamming distance with the closest primer sequence. The                                (Pawlowski and Lecroq, 2010; Lecroq et al., 2011; Lejzerowicz
corrected paired-end fastq files of each library were processed                           et al., 2014), is flanked by at least 50 and 150 nucleotides
to (i) demultiplex sequences to samples using DTD (Dufresne                               at its 50 and 30 ends, and contains no ambiguous nucleotide
et al., 2019)2 , which allows the counting of sequences associated                        (N) or species-level duplicate. A phylogeny built using RAxML
with unexpected primer combinations (or mistags, see Esling                               v8.2.12 (1,000 bootstraps, GTRGAMMAI model; Stamatakis,
et al., 2015), (ii) quality-filter and merge paired reads using                           2014) was manually inspected using EMPress (Cantrell et al.,
pandaseq 2.11 (options -t 0.6 -A pear -T 24 -o 30) (Masella                               2020) to identify and remove rotaliid sequences branching with
et al., 2012), (iii) filter mistags out of each sample (see Esling                        monothalamids, in contradiction with the current foraminiferal
et al., 2015, Supplementary Material), (iv) dereplicate sequences                         phylogeny (Holzmann and Pawlowski, 2017; Supplementary
using mothur (Schloss et al., 2009) and remove the resulting                              Figure 2). The resulting 3,002 18S fragments were harmonized
unique sequences that are singletons or that occur in only one                            to six taxonomic levels (class; order; family; genus; species; and
of the two PCR replicates, (v) cluster sequences into operational                         isolate) in order to serve as a reference database.
taxonomic units (OTUs) to reduce diversity inflation due to PCR                               For the taxonomic assignment of Eukaryota OTUs, both the
and sequencing errors using swarm v3 (option -f) (Mahé et al.,                            Protist Ribosomal Reference database (PR2 , Guillou et al., 2013)
2015), (vi) filter potentially chimeric sequences using UCHIME                            and SILVA 138.1 (SSU Ref NR 99, Quast et al., 2013) were used,
(Edgar et al., 2011) in de novo mode as implemented in QIIME2                             without Insecta and harmonized to the eight taxonomic levels
(Bolyen et al., 2019), and (vii) remove samples with less than                            of the PR2 taxonomic framework (kingdom; domain; phylum;
3,000 reads or less than 10 OTUs.                                                         class; order; family; genus; species). Although the taxonomic
                                                                                          ranks from PR2 were employed, SILVA was kept because PR2
1
    https://figshare.com/account/home#/projects/98972                                     is biased toward protists whereas SILVA remains a generalist
2
    github.com/yoann-dufresne/DoubleTagDemultiplexer                                      database useful for Metazoa assignments. It is important to note

Frontiers in Marine Science | www.frontiersin.org                                     4                                               May 2021 | Volume 8 | Article 671033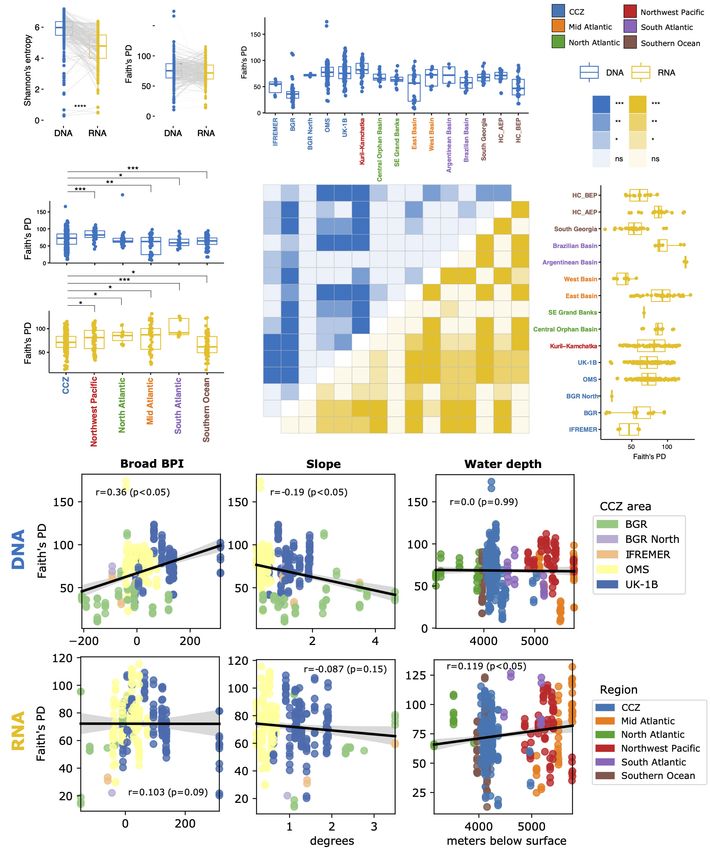
Lejzerowicz et al.                                                                                                         Eukaryotic eDNA/eRNA From CCZ Benthos

TABLE 1 | Origins and numbers of deep-sea sediment material, and successfully PCR-amplified and sequenced samples.

                                                                                                     PCRs                                       Reads

                                                                                              V1V2            37F                 37F                       V1V2

Region          Expedition        Cruise       Area/ Stratum Stations     Sediment   DNA RNA DNA RNA                      DNA            RNA         DNA           RNA
                                  report                                samples (DNA
                                                                          and RNA)

CCFZ           ABYSSLINE 02 Smith et al.,            OMS         12       67 (49)        118     122     130        85   5825513     1762646       9163968     4196374
                              2013
                                                     UK-1B       11       66 (60)        124     124     130        83   4068014     2060791       9060095     6002215
                     BIONOD       Menot,        BGR North        2         2 (1)          2          1   0          3     67503          5857           0          18236
                                  2012
                                                      BGR        2         2 (1)          4          2   0          4    513177         11141           0      568777
                                                    IFREMER      3         3 (2)          6          4    0         4    606679         62151           0      258482
                MANGAN’16          Not                BGR        11       38 (20)         50     15      0          58   3135323        187228          0      2110184
                                 available
Mid Atlantic         VEMA         Devey,         East Basin      2         17 (7)         27     33      33         34   1243418        687412     1875064     1543698
                                   2015
                                                West Basin       2         10 (4)         12         8   18         12   547636         61634       387766     169837
North                MSM39        Mulitza      Central Orphan    3         11 (3)         16     10      0          20   1298106        315858          0      1156835
Atlantic                        et al., 2015       Basin
                                                    SE Grand     2         7 (0)          14         1   0          12   1680373         4623           0      462307
                                                     Banks
Northwest       KuramBio I      Brandt and        Kuril-         11       33 (33)         62     66      64         66   7327166     2715442       3085158     2940135
Pacific                         Malyutina,      Kamchatka
                                   2015
South                DIVA-3      Martínez       Argentinean      2         2 (0)          4          2   1          2    248527         77578       32564      250088
Atlantic                           Arbizu          Basin
                                et al., 2015
                                               Brazilian Basin   6         6 (0)          12         8    0         8    1123375        102496          0      307278
Southern         SYSTCO II        Wolf-             HC_AEP       1        12 (12)         20     24      20         24   1035445        701209     1258836     825238
Ocean                            Gladrow,
                                   2013
                                                    HC_BEP       1        16 (10)         32     17      32         21   2571136        428049     3238188     1097734
                                               South Georgia     1        18 (14)         32     31      2          30   4332986        892373      60307      1811967
                                                     Totals      71        310           535     468     430    466      35624377 10076488 28161946 23719385

that the PR2 taxonomy does not include Xenacoelomorpha,                             build a phylogeny suitable for phylogenetic sequence placement
which in this database is not distinguished from Platyhelminthes                    with SEPP (Mirarab et al., 2012). Then, our homologous V1V2
(Ruiz-Trillo et al., 1999).                                                         OTU sequences were placed onto this tree and their prevalence
   Each OTU representative sequence was assigned using four                         in CCZ samples was visualised in EMPress (for either or both
different methods, including (i) vsearch 2.7.0 (Rognes et al., 2016)                types of molecule). In order to evaluate the quality of the
and (ii) BLAST+ (Camacho et al., 2009) both as implemented                          placements, five SEPP repetitions were performed, using five
in QIIME2, as well as (iii) IDTAXA (Murali et al., 2018) and                        different placement sizes (parameter “-P”).
(iv) SINTAX (Edgar, 2016). For every individual method, the                            In parallel, our OTU sequences were co-clustered with
deepest assignment associated with a probability of at least 0.9                    the OTU sequences from Sinniger et al. (2016) in order to
was retained. Finally, OTUs were classified to the last common                      evaluate the amount of metazoan novelty in a deep-sea benthic
ancestor found by at least two out of the four assignment                           sequencing survey. Two to 17 samples were randomly sub-
methods, and also across the two databases for Eukaryota OTUs.                      sampled from Sinniger et al. (2016) and OTUs re-replicated into
                                                                                    reads (following table counts) that were concatenated with a
Metazoa Novelty                                                                     similar number of unique sequences per OTU randomly sampled
A V1V2 subset composed of OTUs assigned to Metazoa was                              from our study, using the same number of samples and the same
created for comparison with the OTUs reported in Sinniger et al.                    reads proportions. Clustering was then performed using swarm
(2016). From the corresponding author, the Metazoa OTU read                         v3 (as above) on the concatenated sequences of each sampling
counts table (17 samples) was obtained, as well as their aligned                    size and the proportion of resulting clusters containing sequences
representative sequences (8,517) and associated phylogeny,                          from both studies was measured (or “co-clusters”). Each random
which was used as a guide tree for RAxML (GTRCAT model) to                          sub-sampling of sequences from 2 to 17 samples was repeated

Frontiers in Marine Science | www.frontiersin.org                              5                                                   May 2021 | Volume 8 | Article 671033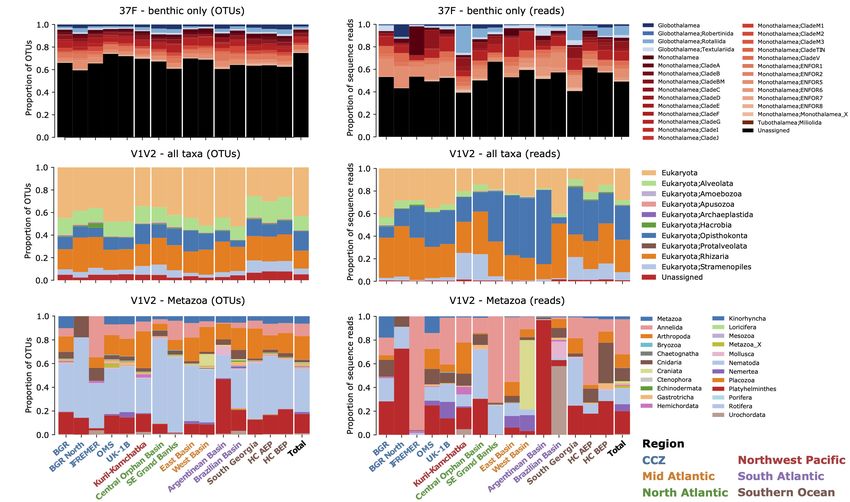
Lejzerowicz et al.                                                                                      Eukaryotic eDNA/eRNA From CCZ Benthos

one hundred times. The whole procedure was also repeated for             Analysis (RPCA) (Aitchison, 1982, 1986) using the EMPeror
each of three stations of Sinniger et al. (2016) from which were         visualization tool in QIIME2 (Vázquez-Baeza et al., 2013). This
generated 2–6 samples in this study.                                     Aitchison metric includes a centered log-ratio transformation
                                                                         step, as performed in DEICODE, which also includes a
Alpha Diversity                                                          matrix completion step for sparse data (Martino et al., 2019).
Phylogenetic placement of the 37F OTUs sequences onto the                Dissimilarity matrices were also built using the more traditional
foraminiferal phylogeny (without planktonic sequences) and               Jaccard and Bray-Curtis dissimilarity metrics (e.g., Legendre and
of the V1V2 OTUs onto the SILVA v128 phylogeny pre-                      Legendre, 2012).
computed for use with SEPP was performed in QIIME2                          These dissimilarity matrices were subject to one-way group
(Janssen et al., 2018). QIIME2 was used to calculate the                 comparisons of beta diversity between regions, areas or stations
Faith’s Phylogenetic Diversity (PD) index (Faith, 1992) based            using PERMANOVA, as well as for differences in dispersion
on these trees, in addition to the Shannon’s entropy index               within each of these groups using PERMDISP (no group with
for alpha diversity analyses. The Faith’s PD metric computes             fewer than 10 samples included, 999 permutations, performed
the amount of root-to-tip branch length on the phylogeny                 using QIIME2). Additionally, the added beta diversity was
represented by each community’s OTUs, but it does not                    evaluated by randomly sampling the matrices 10 times for
account for the number of reads associated with these OTUs.              each of an increasing number of samples and measuring
Hence, the Shannon’s entropy index was also calculated as                the minimum distance among these samples, thus building
it incorporates relative read abundances. Both indices were              dissimilarity-decay curves. These curves are similar to rarefaction
computed after rarefaction to 3,000 reads per sample. For                curves but performed on samples dissimilarity, providing a way
each marker, the difference between regions, areas, stations and         to explore the novelty space of communities, as proposed in
coring device deployments was tested based on the Kruskal–               Huttenhower et al. (2012, see Figures 3D,E) and McDonald et al.
Wallis H test for independent samples (Kruskal and Wallis,               (2018a). The dissimilarity matrices and ordinations obtained
1952) using the python library scipy (Virtanen et al., 2020).            before and after the removal of non-metazoan OTUs were also
To satisfy sample independence, tests were performed for                 compared using Mantel tests (Mantel, 1967) with QIIME2 and
each set of replicates and for DNA and RNA separately, and               PROTESTs (Jackson, 1995) with the R package vegan (Oksanen,
p-values were adjusted using the python library statsmodels              2011), respectively.
for false discovery rate control on multiple testing (Benjamini
and Hochberg, 1995). Post-hoc pairwise comparisons between
individual regions and areas were performed using the Faith’s            Local-Scale Heterogeneity and Relation
PD index (after Kruskal–Wallis H tests results showed significant        to Bathymetry in the CCZ
differences at these scales; see section “Results”) implemented          Local-scale heterogeneity was assessed in terms of community
in the R package conover.test (Conover and Iman, 1979).                  turn-over by measuring the beta-diversity dispersion of each
For these geographic scales, the difference in alpha diversity           station within the UK-1B and OMS strata of the CCZ. First,
between DNA and RNA samples was also assessed using                      RPCA ordination was performed (as above) but only for
paired Kruskal–Wallis tests (Bonferroni adjusted per scale).             the CCZ samples and separately for the DNA and RNA
Finally, the correlation between the Faith’s PD index and each           versions of these samples. Then, the position of the centroid
environmental variable was measured using Spearman’s rho                 formed in these RPCA spaces (in three dimensions) by the
with scipy.                                                              maximum of six samples (three replicates from each of two
    The OTU richness found exclusively at intersections of areas         sediment cores of the same deployment) was calculated at each
was measured across the 37F benthic Foraminifera and V1V2                station and the distances separating these samples from their
Eukaryota datasets, as well as at intersections of stations within       centroid were collected. For an illustration, see Supplementary
the CCZ UK-1B and OMS strata. The R package upSetR (Conway               Figure 20 where the samples are colored per station on the
et al., 2017) was used to also report the number of sequence reads       RPCAs used to calculate distance-to-centroids. This approach
associated with each of the 30 most-important intersections in           is similar to that proposed using the distance-to-plane in
terms of OTU richness.                                                   the human gut microbial ecosystem (Halfvarson et al., 2017).
                                                                         We describe the average and standard deviation of these
Beta Diversity                                                           distances-to-centroids at each station on the UK-1B and OMS
Based on placement trees, the Weighted and Unweighted                    maps and in relation to bathymetry. Maps and their isodepth
UniFrac distances were computed for beta diversity analyses.             contour lines were fetched using the function getNOAA.bathy()
These distances measure phylogenetic relatedness by quantifying          (R package marmap, Pante and Simon-Bouhet, 2013) and
the amount of unique branch length between communities                   the Bathymetric Position Index environmental variable was
(Lozupone and Knight, 2005; McDonald et al., 2018b).                     smoothed over space using the function Smooth() (sigma = 0.05,
Metabarcoding and other environmental-sequencing data                    R package spatstat, Baddeley et al., 2015). Finally, the DNA
are compositional, as the true total of each sample is not               and RNA distributions of these distances to stations’ centroids
known (Quinn et al., 2018). Hence, the compositionally robust            were compared using paired t-tests with the R package
Aitchison distance was employed to build sample dissimilarity            ggpubr. All code to perform and reproduce the analyses is
matrices and identify clusters in Robust Principal Component             available upon request.

Frontiers in Marine Science | www.frontiersin.org                    6                                       May 2021 | Volume 8 | Article 671033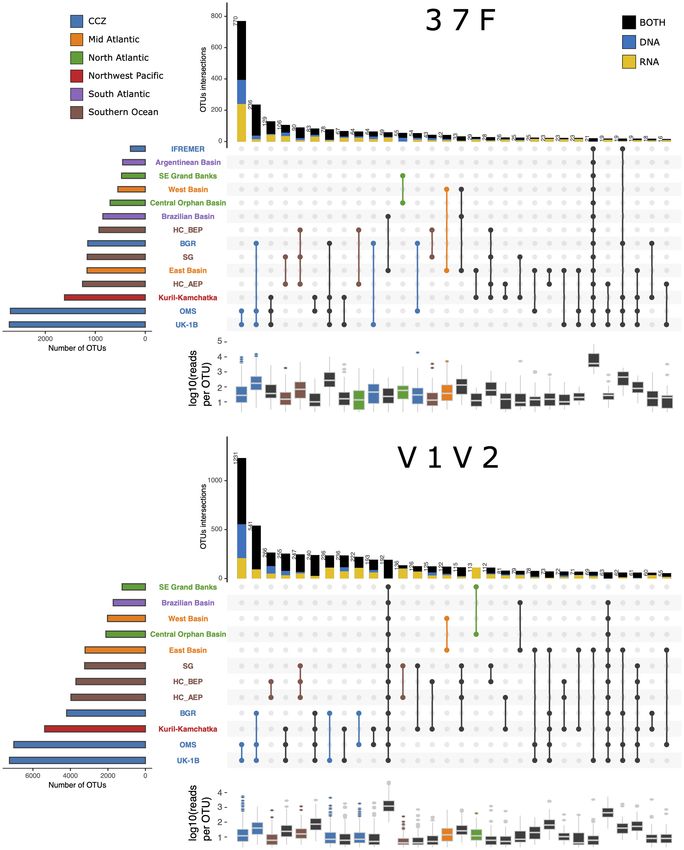
Lejzerowicz et al.                                                                                                         Eukaryotic eDNA/eRNA From CCZ Benthos

  FIGURE 2 | Taxonomic composition and relative abundance. Proportions of OTUs found for each taxon across samples from each area (A,C,E) and relative
  abundances of reads per taxon (B,D,F). (A,B) the 37F dataset (benthic Foraminifera only), (C,D) the full V1V2 dataset, and (E,F) the V1V2 dataset reduced to
  Metazoa. Bars are grouped per region and the total proportions are shown on the right of each panel.

RESULTS                                                                               representing 74.5 and 43.6% of the total number of OTUs for 37F
                                                                                      and V1V2, respectively. Yet, up to 619 V1V2 OTUs and almost a
Sequence Data and Taxonomic                                                           hundred 37F OTUs are consistently assigned to the same genus by
                                                                                      the four methods. A few OTUs (max. 214) are assigned differently
Assignment
                                                                                      by two pairs of methods (“conflicts”), but are resolved at family
Quality, replicates and frequency filtering discarded 13.4 and
                                                                                      (37F) and domain (V1V2) levels (Supplementary Figure 5).
26.9% of the 1,158 and 1,226 samples successfully PCR-amplified
                                                                                      Assignments found consistent at the genus level by two or three
and sequenced for the 37F and V1V2 marker, respectively,
                                                                                      methods represent 20.5 ± 0.01% of all V1V2 OTUs but only
with the more numerous CCZ samples being most affected
                                                                                      5.6 ± 0.02% of all 37F OTUs.
(Supplementary Figure 3A). We performed analyses of an
average of 474.7 ± 44 (standard deviation) samples and
24.4 ± 10.7 million reads per marker and molecule type (Table 1).                     High-Level Taxonomic Composition
The rarefaction depth of 3,000 reads per sample was chosen as                         We summarized the taxonomic composition of benthic
a tradeoff between a high number of reads and a high number                           foraminifera and eukaryotes in terms of OTU proportions and
of samples for analysis, with the final number of samples being                       sequence read relative abundances in each area (Figure 2). The
1,003 for 37F and 896 for V1V2 (Supplementary Figure 3B). The                         foraminiferal dataset is composed mainly of benthic species
sequencing depths obtained across PCR replicates are consistent                       (Figures 2A,B). The proportion of planktonic sequences (order
for each marker and for DNA and RNA with an average                                   Globigerinida) is negligible (0.37% of OTUs, Supplementary
Pearson’s r correlation of 0.71 (Supplementary Figure 3C, all                         Figures 7, 8A,B). The foraminiferal dataset is dominated
p-values < 0.001). Sequence clustering across markers and                             by unassigned sequences, both in number of OTUs and
replicates resulted in a total of 12,742 and 43,091 OTUs for the                      abundance of reads (Supplementary Tables 3, 4). The
37F and V1V2 markers, respectively.                                                   assigned sequences belong mainly to the single-chambered
   For taxonomic assignment of V1V2 OTUs, using PR2 or                                class Monothalamea. Among them, the groups only known from
SILVA resulted in very similar assignment profiles across                             previous environmental foraminiferal metabarcoding surveys
taxonomic levels and methods intersections (Supplementary                             (“ENFOR”) can represent more than half of the reads assigned
Figure 4). When the four methods agree, it is mainly for                              in a particular area. On average, the single group ENFOR5
non-assignments, which is the case for the majority of OTUs,                          accounts for 13.3 ± 3.1% of the reads in the six CCZ areas. The

Frontiers in Marine Science | www.frontiersin.org                                 7                                              May 2021 | Volume 8 | Article 671033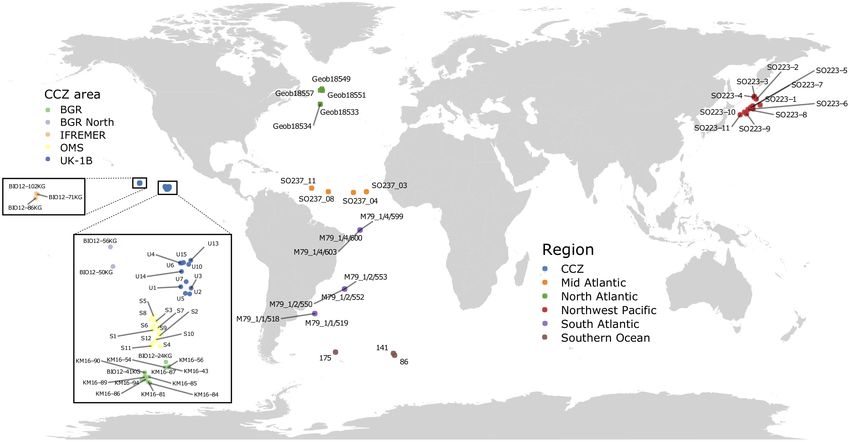
Lejzerowicz et al.                                                                                      Eukaryotic eDNA/eRNA From CCZ Benthos

proportion of multi-chambered Globothalamea is minor in the              only 1–2% of the clusters contained sequences from both
CCZ, although it is well represented in the Kuril-Kamchatka              studies (Supplementary Figure 11A) and the proportions remain
(Northwest Pacific) and South Georgia (Southern Ocean) areas,            low when comparing samples from exactly the same stations
where it contributes 24.2 and 13.3% of the reads, respectively.          (Supplementary Figure 11B).
Interestingly, the high-level taxonomic composition of OTUs                  All metazoan clades recovered in Sinniger et al. (2016) are also
is very similar in all sampled areas, in contrast to the relative        found in the present study (Figure 3). The taxon that dominates
abundance of reads, which are much lower for globothalamiids             in all deep-sea samples is the phylum Nematoda, the OTUs of
in the CCZ compared to other regions (Wilcoxon-Mann-                     which (in light blue) cover almost half of the tree (Figure 3).
Whitney tests on log-ratios, for DNA: U = 2.82 × 10⁶ ,                   Some of them are assigned to species or genus level but many
p-value = 3.27 × 10⁻⁷ ; and for RNA: U = 3.55 × 10⁶ ,                    remain at order level. Another frequently occurring group is the
p-value = 2.75 × 10⁻¹⁴ , Supplementary Figure 9).                        Arthropoda (in dark blue), generally assigned to family level.
    The eukaryotic dataset (V1V2 all taxa) is composed mainly            Most of them belong to the class Maxillopoda, which includes
of OTUs assigned to Alveolata, Opisthokonta, Rhizaria, and               the benthic harpacticoid and planktonic calanoid copepods. Next
Stramenopiles (Figure 2C), while Opisthokonta and Rhizaria               to the arthropods in the tree are annelids (in red) that also
dominate in terms of read abundances (Figure 2D). The average            represent a highly diversified group, but with few OTUs assigned
proportion of unassigned OTUs per area is 46.7 ± 0.05%,                  to genus or species level. The platyhelminthes/xenacoelomorphes
without the Southern Ocean areas, where it is 34.7 ± 0.02%               (in dark green) branch separately and are assigned principally
(Supplementary Tables 5–8). The taxonomic profiles are very              to the class level. The platyhelminthes/xenacoelomorphes branch
similar for the whole CCZ region. Overall, about a fourth of the         closely to several unassigned sequences (in pink), which possibly
reads (22.6 ± 0.09%) from CCZ belong to Opisthokonta, and                also belong to this group.
these are distributed in 17.2% of the 43,091 OTUs, a proportion              An important proportion of metazoan OTUs are unique to
similar to that of the supergroup of Rhizaria (15.9% of OTUs).           the CCZ (Figure 3, yellow in inner ring). Many of them can be
CCZ Opisthokonta includes Metazoa (6.2 ± 0.02% of OTUs),                 found among annelids and platyhelminthes/xenacoelomorphs.
but also Fungi that represent 14.7 and 15.8% of reads in UK-             They are represented either in DNA or in RNA, but rarely
1B and OMS, respectively (Supplementary Figure 6). In the                in both datasets. Only a few OTUs have been found to
other regions, the proportion of reads is also similar, except for       be highly prevalent in CCZ samples (bars). Most of them
the supergroup of Stramenopiles (dominated by diatoms), which            belong to nematodes, but there are also a few hydrozoans,
represents a large fraction of the reads in the Kuril-Kamchatka          annelids, and platyhelminthes/xenacoelomorphes that are highly
(Northwest Pacific) and South Georgia (Southern Ocean) areas.            prevalent in the CCZ.
    For analyses of the metazoan component, a large part of the              The phylogenetic placement of Foraminifera OTUs results
V1V2 dataset was removed, including Alveolata, Amoebozoa,                in quite a different image (Figure 4 and Supplementary
Apusozoa, Archaeplastida, Hacrobia, Stramenopiles, Rhizaria,             Figure 10A), mainly because the reference tree comprises
non-metazoan Opisthokonta, as well as unassigned “Eukaryota”             several taxonomic groups represented by shallow-water species.
(Supplementary Figure 7). In the CCZ samples, these                      This applies particularly to the class Globothalamea and
removed taxa are highly prevalent and altogether represent               monothalamid Clade E, as well as the freshwater and soil clades.
85.8% of the reads (Supplementary Figures 8C,D). Among                   Compared to Metazoa, many foraminiferal sequences are highly
the most abundant metazoans prevalent in the CCZ are                     prevalent in CCZ samples (both with DNA and RNA) and
Nematoda (present in 97.9% of the samples), followed by                  notably the environmental clades ENFOR5 and the highly diverse
Platyhelminthes/Xenacoelomorpha (77.9%), and Annelida                    ENFOR1. High prevalence in the CCZ is also observed in
(63.3%). The Echinodermata, Gastrotricha, Mollusca,                      Clades V and F. All these clades are dominated by undescribed
Nemertea, and Porifera are present in, at most, only 23.3%               monothalamous species, often represented by environmental
of the CCZ samples.                                                      sequences only. On the other hand, the CCZ foraminiferal dataset
                                                                         contains very few OTUs assigned to Clade C, despite the fact that
Phylogenetic Novelty                                                     this clade comprises the megafaunal xenophyophores, which are
To establish biodiversity novelty in the CCZ region we placed the        common in the CCZ.
metazoan and foraminiferal datasets in molecular phylogenies
(Figures 3, 4). In the case of metazoans, we performed OTU               Uniqueness of CCZ Areas
comparisons with the global-ocean study of Sinniger et al.               Areas within the CCZ region are distinct from the other regions
(2016). An evaluation of the quality of this step reveals that           studied in terms of exclusively shared OTUs, with 1,124 37F
for a given OTU, alternative placements associated with a low            OTUs and 2,230 V1V2 OTUs (Figure 5) representing 19.8 and
probability would place this OTU very close to the retained              14% of the CCZ OTUs, respectively. The numerous OTUs shared
placement node on the tree (Supplementary Figure 10C).                   between UK-1B and OMS, the most-heavily sampled areas, are
Hence, we are confident that our Metazoa placements can be               also rare in terms of sequence read abundances and half of
interpreted in the framework of the Sinniger tree. To further            them were detected both using eDNA and eRNA (Figure 5 and
measure metazoan novelty, we co-clustered at similar sampling            Supplementary Figure 12). Among other regions, only the three
effort the Metazoa OTUs of this study with the OTUs from                 Southern Ocean areas share relatively high numbers of OTUs
Sinniger et al. (2016). With all Sinniger’s samples included,            that are unique to this region. This is especially true for the two

Frontiers in Marine Science | www.frontiersin.org                    8                                       May 2021 | Volume 8 | Article 671033
Lejzerowicz et al. Eukaryotic eDNA/eRNA From CCZ Benthos FIGURE 3 | Phylogenetic diversity and novelty of Metazoa OTUs. The phylogeny from Sinniger et al. (2016) is shown, expanded with V1V2 OTUs placements from this study. Tree branches are colored at the Class and Order levels. Concentric bar plots indicate, for each OTU its assignment depth (innermost ring), whether it is exclusive to the CCZ using both DNA and RNA (large inner ring), using DNA only (middle ring) or using RNA only (outer ring). These OTU-occurrence measures indicate whether a tip corresponds to an OTU found only in the CCZ (“CCZ only”, in yellow), to an OTU also found in any other area (“Other areas”, in turquoise), or whether a tip corresponds to a sequence from the reference phylogenies used for placement (“Reference”, in purple). The prevalence of each OTU in the CCZ samples is indicated in terms of percent of samples where it is detected in this area (outermost bars). The finest taxonomy of OTUs highly prevalent in the CCZ are indicated. stations exposed to high chlorophyll exports in the 37F dataset Alpha Diversity (HC_AEP and South Georgia), but less so in the V1V2 dataset Different levels of alpha diversity characterize the benthic where there are half the numbers of shared OTUs than in closely foraminiferal and eukaryotic communities at each spatial scale. located areas (HC_AEP and HC_BEP). Interestingly, the CCZ Overall across datasets, this is seen more clearly when using areas also share exclusive OTUs at several intersections with Faith’s PD (PD) compared to Shannon’s entropy (H’) and in the Kuril-Kamchatka area (Northwest Pacific region), although most cases when using DNA (Supplementary Figure 13). For the number of shared OTUs is much lower than between 37F, only the difference between regions using H’ and RNA was CCZ areas. not supported statistically, while other significant tests showed There is a relationship between the number of reads in an the largest difference effect using DNA at the region (Kruskal– OTU and the number of areas in which it occurs (Figure 5, box Wallis H = 29.1 for PD; 17.8 for H’) and area (H = 105.3 for plots). Moreover, highly prevalent OTUs are detected by both PD; 77.3 for H’) scales compared to RNA (for PD: H = 16.8 DNA and RNA, which is also the case for the many OTUs present and 36.7 at region and area scales, respectively). Interestingly, at all stations within each CCZ area (Supplementary Figure 12, this effect size was slightly larger using RNA for 37F PD at local box plots). Besides these cosmopolitan, high-frequency OTUs, scales, such as between stations (H = 76.7 for DNA; 82.1 for the most important OTU intersections within CCZ areas are RNA) and deployments (H = 63.4 for DNA; 67 for RNA). For between pairs of stations, including OTUs only detected using V1V2, the trend remains that RNA does not show alpha diversity DNA or RNA molecules (Supplementary Figure 12). Notably, difference between regions (for both indices), whereas it yields any two stations within UK-1B and OMS strata tend to share a greater difference between areas (H = 23.5 for PD; 16.5 for between 10 and 15 exclusive 37F OTUs that can be represented by H’) compared to DNA (H = 36.9 for PD; 22.6 for H’). However, hundreds of reads (Supplementary Figures 12A,B). This number alpha diversity differences are much more pronounced using of OTUs exclusive to pairwise CCZ station intersections is higher DNA at local scales (between stations) both for PD (H = 92.6 for for V1V2 (c.a. 40–100) than for 37F, and for OTUs associated with DNA; 37.3 for RNA) and H’ (H = 89.9 for DNA; 35 for RNA) fewer reads (Supplementary Figures 12D,E). (all Kruskal–Wallis tests have adjusted p-values < 0.05). Also, Frontiers in Marine Science | www.frontiersin.org 9 May 2021 | Volume 8 | Article 671033
Lejzerowicz et al. Eukaryotic eDNA/eRNA From CCZ Benthos
FIGURE 4 | Phylogenetic diversity and novelty of Foraminifera OTUs. The Foraminifera phylogeny is shown, expanded with 37F OTUs placements from this study. All
legends similar to Figure 3.
it should be noted that for V1V2 not all areas (and stations) the eukaryotic DNA dataset, the CCZ stands out as the most
are compared since many DNA co-extractions failed (Table 1 diverse region (no data for BGR and IFREMER) (Supplementary
and Supplementary Table 2). For the CCZ, DNA and RNA Figures 15B,C). Interestingly, within-station DNA and RNA
yield similar levels of alpha diversity for V1V2, whereas for diversity vary more for Eukaryota than for Foraminifera, as is
37F, the diversity of DNA is higher than that of RNA, but clear from the wider dynamic range of values for the former
only using Shannon’s entropy (Figure 6A and Supplementary dataset (Supplementary Figures 16A vs. 16B, box plots). It also
Figures 14, 15A). Hence, we restricted the following analyses to appears that between-station RNA diversity differences are more
Faith’s PD index. frequent for Foraminifera than for Eukaryota, as illustrated by
Alpha diversity in the CCZ differs from that of every other the higher number of significant post hoc tests for the latter
region as assessed by post-hoc pairwise comparisons following dataset (see dark yellow cells in heatmaps in Supplementary
Kruskal–Wallis H tests (37F: Figure 6B; V1V2: Supplementary Figures 16A vs. 16B).
Figure 15B). For the foraminiferal DNA dataset, the CCZ appears Foraminifera 37F alpha diversity in the CCZ is associated
as the second most diverse region after Kuril-Kamchatka. Alpha with topography, but only for DNA (Figure 6D). Faith’s PD was
diversity of the CCZ as a whole does not differ from the North positively correlated with Broad BPI (Spearman’s rho = 0.36,
Atlantic region because the diversity within its individual areas p-value < 0.05) and negatively with seafloor slope (rho = −0.19,
and stations (all confined to the eastern CCZ) varies significantly p < 0.05). Eukaryota V1V2 alpha diversity is also associated
(Figure 6C and Supplementary Figure 16A). Indeed, the UK-1B with topography for DNA, but only with Fine BPI (Spearman’s
and OMS strata have a similar, high Faith’s PD whereas the BGR rho = 0.23, p-value < 0.05) (Supplementary Figure 15D). In
and IFREMER areas have very low values for this index (there relation to water depth, the Foraminifera RNA diversity exhibits a
were too few samples for testing against BGR North). In fact, positive but weak correlation with increasing depth (rho = 0.119,
the BGR stations exhibit consistently lower DNA diversity values p-value < 0.05). Conversely, only DNA associates with depth for
than all other CCZ stations, with the notable exceptions of the the Eukaryota, in a stronger negative correlation (rho = −0.222,
two IFREMER stations where nodule abundance was particularly p-value < 0.05) (Supplementary Figure 15D).
high (BIO12-102KG and BIO12-86), and station SO237-3 in the
West Basin in the central Atlantic (Supplementary Figure 16A). Beta Diversity
This Atlantic station is also characterized by the presence of For both Foraminifera and Eukaryota, the CCZ samples form
large polymetallic nodules (see cruise report; Devey, 2015). For clusters on the Robust PCAs that are well separated from the
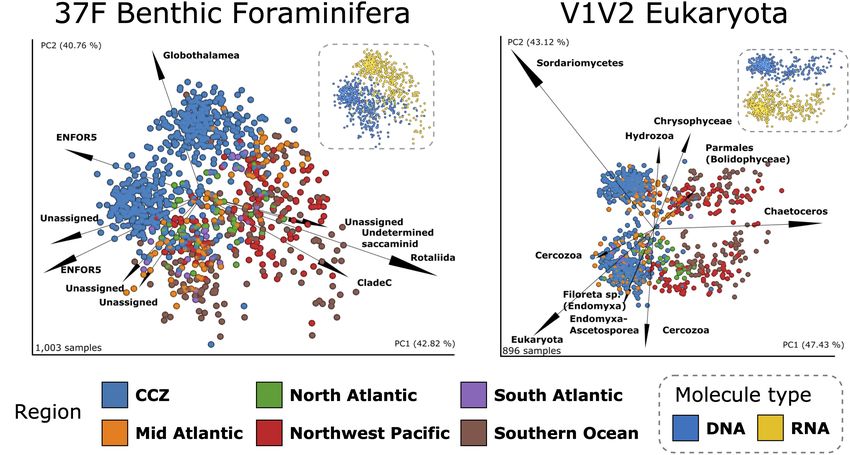
Frontiers in Marine Science | www.frontiersin.org 10 May 2021 | Volume 8 | Article 671033Lejzerowicz et al. Eukaryotic eDNA/eRNA From CCZ Benthos FIGURE 5 | Diversity specific to region intersections. Number and read frequencies for (A) the 37F (benthic) and (B) the V1V2 (all taxa) OTUs shared at different intersections of regions (matrix rows). Only the 30 intersections that are the largest in terms of numbers of OTUs are shown, and ordered by decreasing OTU numbers. The bars on the top panel indicate the number of OTUs in the intersection denoted by the connected dots on the middle panel. Bars are colored according to molecule (blue: DNA; yellow: RNA; black: both). The bars on the left panel indicate the total number of OTUs in each area (or station), while the box plots on the bottom panel indicate the distribution of reads in each OTU per intersection. samples of other deep-sea regions (Figures 7A,B), except for to an asymptotic minimum for both 37F and V1V2 and both for the Mid Atlantic samples that intermingle to some extent with DNA and RNA (Supplementary Figure 18). Unsurprisingly, this the CCZ samples in the case of V1V2 (Figure 7B). Strikingly, pattern holds when sampling globally, with an increased baseline the DNA and RNA samples also formed two larger clusters, value of added beta diversity (Supplementary Figure 18, see each of which shows separate groupings of CCZ samples. We “All samples”). therefore performed RPCA on DNA and RNA separately (as For 37F, the separation between CCZ and Atlantic areas for alpha diversity analyses). For both 37F and V1V2, this also is driven by several ENFOR5 OTUs and several Unassigned resulted in grouping samples according to region, and even areas, OTUs pointing for DNA in these different, respective area with the notable exception of CCZ areas, which formed a large directions whereas for RNA, it is two Unassigned and one and highly variable cluster (Supplementary Figure 17). Indeed, poorly assigned Globothalamea OTUs that characterize CCZ the beta diversity that we demonstrate within the CCZ is far samples, as opposed to two Rotaliida OTUs that are strongly from being representative of all that can be sampled there, as associated with OTU-rich Atlantic samples. In the case of indicated by the dissimilarity-decay curves that do not saturate V1V2, it appears that for the DNA RPCA ordination, two Frontiers in Marine Science | www.frontiersin.org 11 May 2021 | Volume 8 | Article 671033
Lejzerowicz et al.                                                                                                             Eukaryotic eDNA/eRNA From CCZ Benthos

  FIGURE 6 | Alpha diversity comparisons between molecules, regions and areas, and correlations with environmental variables for the Foraminifera dataset.
  (A) Paired Kruskal–Wallis test between DNA and RNA alpha diversity indices within the CCZ. Gray lines indicate same-sample paired comparisons. Pairwise
  post hoc tests separately for the DNA and RNA samples to compare the Faith’s PD alpha diversity between individual regions (B) and areas (C). Significant
  differences between regions are shown using box-to-box connectors (B) whereas for areas, these are indicated in the heatmaps (blue triangle: within-DNA
  comparisons; yellow triangle: within-RNA comparisons). (D) Spearman correlations between the Faith’s PD alpha diversity of DNA or RNA samples and
  environmental variables in the CCZ. Slope and Broad BPI are only available for the CCZ region whereas water depth is shown across regions. Spearman’s rho
  statistics and p-values are indicated on insets. ***p-value ≤ 0.01; **p-value ≤ 0.03; *p-value ≤ 0.05; no label/ns: p-values > 0.05; no color (heat map): no testing.
  Results for the V1V2 dataset are shown in Supplementary Figure 15.

OTUs assigned to the diatom Chaetoceros (pelagic) acting                                 whereas a diversity of Cercozoa OTUs (including some assigned
in one direction, and an OTU assigned the fungal taxon                                   to Endomyxa-Ascetosporea parasites), and two OTUs assigned to
Sordariomycetes acting in the opposite direction, drive the                              Radiolaria (pelagic), strongly influence sample separation along
separation along the first axis (PC1), i.e., the separation of                           the second axis (PC2).
Kuril-Kamchatka, Southern Ocean and CCZ samples (these                                       No clear clustering of the areas results from the RPCAs based
taxa were already most influential with both DNA and RNA                                 on the Metazoa subset, except for DNA where one Annelida OTU
on the RPCA, Figure 7B). For the RNA ordination, the                                     drives the separation between UK-1B and OMS samples and most
CCZ and Southern Ocean separate under the influence of an                                of the Southern Ocean samples (Supplementary Figure 17). Beta
unassigned eukaryotic OTU and a Fungi OTU (along PC1)                                    diversity comparisons, performed before and after removal of

Frontiers in Marine Science | www.frontiersin.org                                   12                                               May 2021 | Volume 8 | Article 671033
Lejzerowicz et al.                                                                                                        Eukaryotic eDNA/eRNA From CCZ Benthos

  FIGURE 7 | Deep-sea benthic communities beta diversity. Robust PCAs based on the Aitchison metric for (A) the 1,003 37F samples (B) the 896 V1V2 samples.
  PCR-amplified samples (scatter), are colored according to region and the top 10 most influential OTUs biplots (arrows) are labeled with their deepest taxonomic
  assignment. Insets represent the same RPCAs but colored according to molecule type. The percentages indicated for PC1 and PC2 are large because they
  represent the variance explained in the three first dimensions.

non-Metazoa OTUs using Mantel tests on dissimilarity matrices                         associated with steeper slopes seem more dissimilar on these
or PROTEST on three-dimensional ordinations, revealed that                            RPCAs (Supplementary Figure 20), we plotted these distances
the beta diversity changed considerably as a result of this filter.                   to station centroids on bathymetric maps of the CCZ strata
Mantel’s r correlations were 0.65 and 0.59 for the Aitchison                          UK-1B and OMS (Figure 8A). Communities at stations located
metric on DNA and RNA matrices, respectively, with an even                            in depressions (i.e., associated with low Broad BPI values, blue
lower procrustes PROTEST fit of ca. 0.4 for both DNA and                              background) were systematically more variable, as indicated by
RNA (Supplementary Table 9). Nevertheless, a relatively good                          higher values for the distances to centroids in terms of average
conservation of the beta diversity pattern was achieved using                         and standard deviation values (green circles). This relation was
the Jaccard binary metric (Mantel’s r = 0.75 and PROTEST’s                            highly pronounced for the DNA samples and in the OMS stratum
1-M2 = 0.78, all p-values < 0.001, Supplementary Table 9).                            where distances to stations centroids increased with BPI, yielding
    Differences between regions, areas and stations were                              more variable communities locally. Overall, the distances to
statistically supported for each dataset in PERMANOVA                                 station centroids computed based on the compositionally robust
performed on the Aitchison metric (DNA Pseudo-                                        Aitchison metric are not different between DNA and RNA,
F37F/V1V2 = 20.44/20.43; RNA Pseudo-F37F/V1V2 = 16.03/16.43;                          while using the phylogenetic, Unweighted UniFrac metric,
all p-values < 0.001) and for all other beta diversity metrics                        we found RNA heterogeneity to be significantly greater than
(Supplementary Figures 19A–C). However, the dispersion of                             DNA (Figure 8B).
the samples within each group was also significantly different
between groups, except for the phylogenetic beta diversity metric
Weighted UniFrac, which yielded the greatest difference between                       DISCUSSION
regions using DNA (Pseudo-F = 35.54, p-value < 0.01). We
also tested for differences between areas and stations within                         Metabarcoding Data and the Abyss
the CCZ only and found statistical support unaffected by                              Omics techniques allowing rapid and standardized profiling of
PERMDISP dispersion for comparisons based on DNA among                                environmental molecules may represent a powerful approach
37F stations and V1V2 areas (PERMANOVA Pseudo-F = 4.027                               to filling deep-sea knowledge gaps (Levin et al., 2019) and
and 3.194, respectively, both p-values < 0.001, Supplementary                         addressing key goals for this decade (Howell et al., 2020).
Figures 19B–D).                                                                       Metabarcoding, in particular, is being increasingly developed
                                                                                      for biomonitoring purposes in marine environments (Chariton
Spatial Heterogeneity                                                                 et al., 2010; Aylagas et al., 2018, 2020; Brandt et al., 2020;
Since PERMDISP testing revealed differences in group                                  Le et al. in review). It has successfully documented the local
dispersions and notably for stations, we calculated as a measure                      impacts of marine industries, including aquaculture (Pawlowski
of local heterogeneity the distances to centroids for samples                         et al., 2014; Lejzerowicz et al., 2015; Pochon et al., 2015; Cordier
from each station on 37F CCZ RPCAs (for DNA and RNA                                   et al., 2018) and oil and gas extraction in coastal ecosystems
separately, see section “Materials and Methods”). Since stations                      (Lanzén et al., 2016; Laroche et al., 2016; Cordier et al., 2019;

Frontiers in Marine Science | www.frontiersin.org                                13                                             May 2021 | Volume 8 | Article 671033
Lejzerowicz et al. Eukaryotic eDNA/eRNA From CCZ Benthos
FIGURE 8 | Spatial heterogeneity expressed in terms of station beta diversity dispersion in relation to bathymetry for the 37F dataset. (A) At each station of the
UK-1B and OMS strata (CCZ), we computed the distance separating the samples to the station centroid they form in the RPCA spaces obtained separately for DNA
and RNA. Average and standard deviations for these distances-to-centroids are shown at each station (max. six samples per station) of each map panel (green
rings), as well as for the number of OTUs (gray rings). The background color represents the Broad Scale BPI (Bathymetric Position Index) values smoothed over the
plotted area. (B) Paired t-tests comparing the distributions of distance-to-centroid values between DNA and RNA are shown for the Aitchison dissimilarity metric
(also used for the Robust PCA and maps) as well as for the phylogenetic, Weighted UniFrac dissimilarity metric.
Mauffrey et al., 2020) where extensive ecological knowledge has performed in PCA spaces that are robust to this effect, allowing
allowed ground truthing. Metabarcoding has also been used comparison and testing. These outstanding technical aspects are
for surveys of CCZ areas focusing on prokaryotic microbial particularly relevant for the deep seafloor, which is characterized
communities (Shulse et al., 2017), metazoans (Laroche et al., by substantial small-scale faunal patchiness (Snelgrove and
2020a) and allochthonous pelagic eDNA deposited in sediments Smith, 2002) that is difficult to sample, particularly using
(Laroche et al., 2020b). metabarcoding (Lejzerowicz et al., 2014).
General methodological considerations regarding eukaryotic Although metabarcoding is an important tool that can
metabarcoding have been reviewed recently (Santoferrara et al., overcome some of the limitations inherent in morphology-based
2020). Besides the robust multiplexing design and PCR replicates studies of deep-sea biota (Le et al., in review), there are some
that we used to filter cross-contaminations and spurious data caveats to be born in mind when considering metabarcoding
(Esling et al., 2015), and extraction replicates to improve diversity data obtained in deep-sea settings. First, because the amounts of
estimates (Lanzén et al., 2017), another commonly overlooked sediment analyzed are small (2–10 g), the data will be weighted
issue is the compositional nature of sequencing data, which toward small-sized organisms (meiofauna and smaller). Macro-
includes metabarcoding (Gloor et al., 2016, 2017; Martino et al., to megafauna would necessarily occur only as sloughed cells,
2019). Indeed, a simple transformation (e.g., with the Aitchison eggs, larvae, or tissue fragments, which would yield high amounts
metric) allows circumventing the fact that, following sediment of fresh, readily amplified molecules and explain the occasional
sampling, extraction, PCR and sequence subsampling, it is dominance of large animals when taxonomic composition is
impossible to know the true total abundance of taxa in samples expressed in terms of the relative abundances of reads (e.g.,
and thus to compare compositions on the basis of abundance see Craniata in Figure 2F). This caveat may also apply to
(or relative abundance) (Morton et al., 2017; Knight et al., 2018). some protists, notably megafaunal xenophyophores. Although
Our analyses of beta diversity turnover and dispersion were these giant agglutinated Foraminifera are abundant and diverse
Frontiers in Marine Science | www.frontiersin.org 14 May 2021 | Volume 8 | Article 671033You can also read